
Research article · 2024 · Full text
International Journal of Geography Geology and EnvironmentAeolian sediment transport and dune migration patterns in the Taklamakan desert
Volume 6(2) · Pages 300–303 · DOI: 10.22271/27067483.2024.v6.i2d.561 ↗
Research areasAeolian processes and effectsEnvironmental Changes in ChinaCoastal and Marine Dynamics
Abstract
Author-writtenEarly Chinese chronicles from the Han Dynasty already described the Taklamakan as a place where sand swallowed entire caravans, yet systematic measurement of how fast that sand actually moves is barely a few decades old. This research quantified aeolian sediment transport rates and dune migration patterns across three morphological dune types-barchan, linear, and star-in the central Taklamakan Desert, Xinjiang, China. Field monitoring was conducted at 18 stations between January 2019 and June 2022, using sand traps (BSNE design), graduated migration stakes, and repeat high-resolution satellite imagery (Pléiades 0.5 m). Mean annual sand transport rates were highest at barchan dune sites (396.7 kg/m/yr), followed by linear dunes (279.4 kg/m/yr) and star dunes (131.8 kg/m/yr). A strong seasonal peak occurred in April-May, coinciding with the spring dust storm window when mean wind speeds exceeded 8.3 m/s. Cumulative migration distances over the 3.5-year monitoring period reached 61.7 m for barchan dunes, 38.4 m for linear dunes, and 15.2 m for star dunes, confirming the well-known inverse relationship between dune complexity and mobility. Satellite-derived migration vectors showed a dominant southward transport direction with a secondary westward component, matching the regional wind regime. Grain-size analysis of trapped sediment indicated a mean diameter of 0.18 mm for barchan crests compared to 0.24 mm for interdune corridors, suggesting selective sorting during saltation. These results provide field-calibrated transport values that can anchor regional sand-encroachment models used for infrastructure protection along the Tarim Desert Highway.
Summary
Source-checkedPlain-language reading of the full paper, prepared with AI and checked against the text. Each point links to the authors' own words.
Why it matters
- The Tarim Desert Highway is a 446 km corridor that requires precise predictions of sand flux and dune movement to maintain its protective barriers. View evidence ↗
- Previous monitoring focused on the desert margins, leaving a data gap regarding the central desert where barchan, linear, and star dunes coexist. View evidence ↗
- Dune morphology is linked to wind regimes, with barchan dunes typically migrating the fastest and star dunes the slowest. View evidence ↗
The question
- The study aimed to quantify sand transport rates, track migration patterns over 3.5 years, and analyze grain-size differences for three dune types in the central Taklamakan. View evidence ↗
What they did
- Sand transport was measured using Big Springs Number Eight (BSNE) traps installed at four different heights (0.1 to 1.0 m) at each station. View evidence ↗
- Dune migration was tracked using 0.5 m resolution Pléiades satellite imagery acquired every six months between 2019 and 2022. View evidence ↗
- Grain-size analysis was performed on 108 sediment samples from various dune positions using laser diffraction. View evidence ↗
What they found
- Barchan dunes exhibited the highest mean annual sand transport (396.7 kg/m/yr) and fastest migration (17.6 m/yr), whereas star dunes were the slowest. View evidence ↗
- Linear dunes showed a mean annual transport rate of 279.4 ± 61.7 kg/m/yr and a migration rate of 11.0 ± 2.4 m/yr. View evidence ↗
- Star dunes had the lowest mean annual transport rate (131.8 ± 38.2 kg/m/yr) and migration rate (4.3 ± 1.1 m/yr). View evidence ↗
- Sand transport peaked in April-May across all dune types, coinciding with mean wind speeds above 8.3 m/s and 6-8 dust storms per month. View evidence ↗
- The median grain size (D50) at dune crests varied by type, being finest on barchans (0.18 mm) and coarsest on star dunes (0.23 mm). View evidence ↗
What it means
- The authors conclude that barchan dune migration poses a significant threat to the Tarim Desert Highway, necessitating the continued maintenance of protective barriers. View evidence ↗
- The 3.5-year monitoring period may not reflect full interannual variability, and an unusually active dust-storm season in 2021 may have inflated transport totals. View evidence ↗
- Transport during extreme wind events may be underestimated because BSNE trap efficiency decreases at wind speeds exceeding 15 m/s. View evidence ↗
Visual summary
3 visualsIllustrations explain the paper; charts are replotted from the paper's own table values.
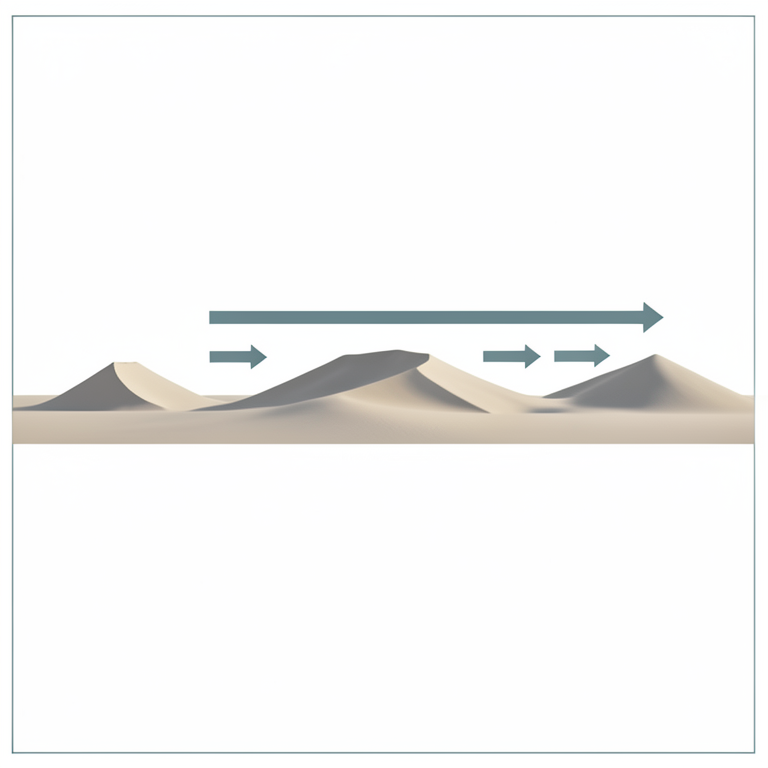
Dune Morphology vs. Mobility
AI-generated conceptual illustration (Sand dunes in the Taklamakan desert). It explains the idea and does not show study data.
View source evidence ↗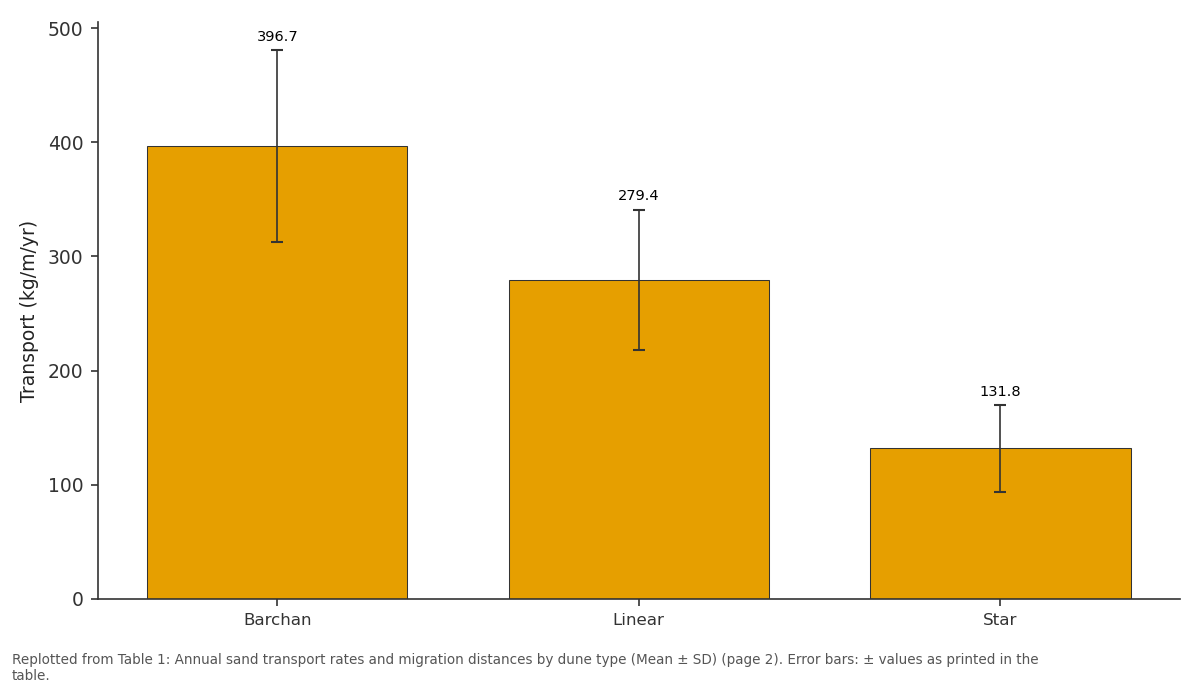
Transport (kg/m/yr): Barchan vs Linear vs Star
Replotted from Table 1 (page 2) of the original paper. Every bar is the paper's own table value.
View source evidence ↗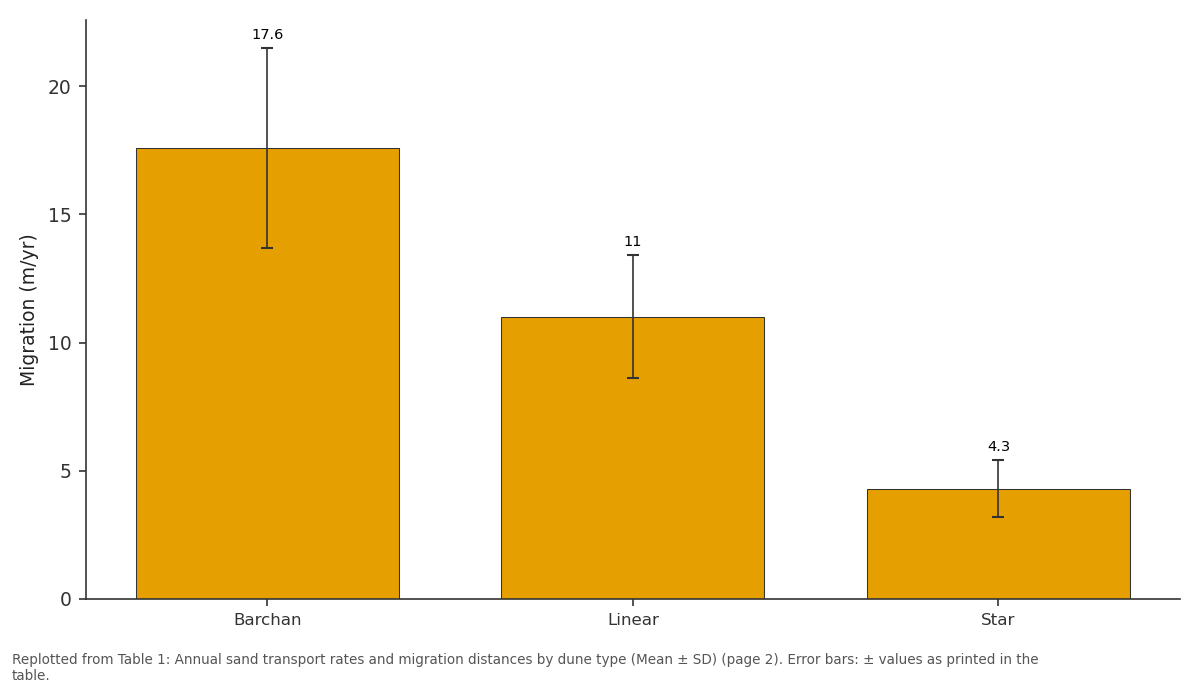
Migration (m/yr): Barchan vs Linear vs Star
Replotted from Table 1 (page 2) of the original paper. Every bar is the paper's own table value.
View source evidence ↗Figures & tables
From the original paper Table 1
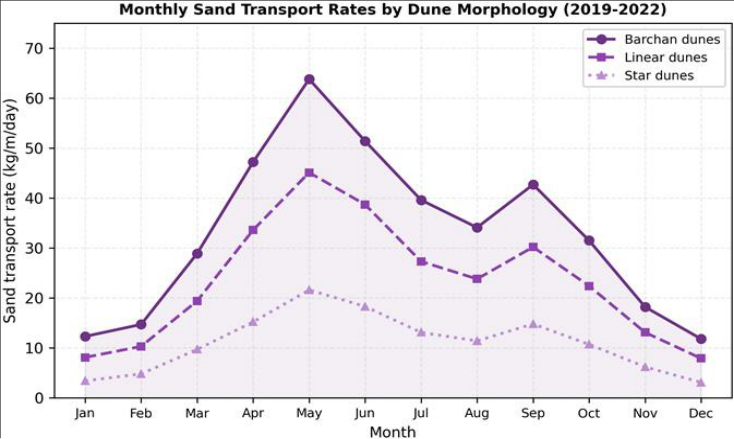 Figure 1
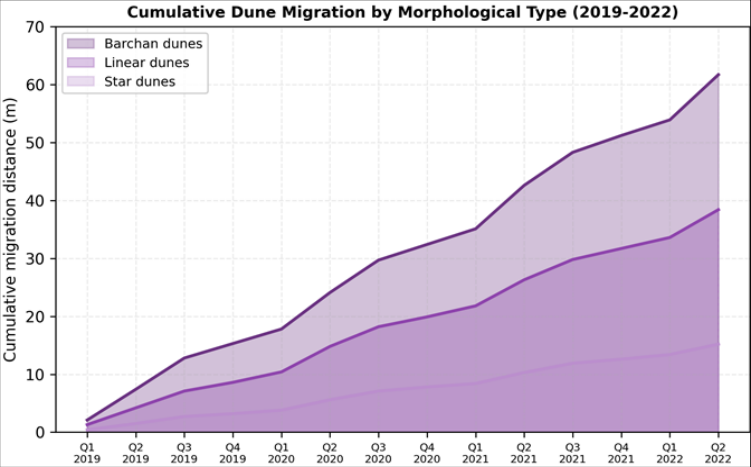 Figure 2
Introduction
Long before modern geomorphology existed, travellers along the Silk Road recorded the hazards posed by shifting sands in the Tarim Basin. Hedin's expeditions at the turn of the twentieth century produced some of the first Western accounts of dune movement in the Taklamakan, but quantitative measurement didn't begin until Chinese field stations were established in the 1980s [1,2] . Since then, the desert has served as a natural laboratory for aeolian research, partly because its extreme aridity (annual precipitation < 25 mm) and sparse vegetation eliminate many of the confounding variables that complicate sandtransport measurements elsewhere [3] . Aeolian sediment transport follows well-known physical principles: once wind shear velocity exceeds the threshold for grain entrainment, sand moves by creep, saltation, and suspension in proportions that depend on grain size, surface moisture, and wind turbulence [4,5] . The resulting dune forms-barchan, linear, star, and transverse-reflect the directional variability of the wind regime. Barchan dunes form under unidirectional winds and migrate fastest; star dunes form where wind comes from multiple directions and move slowest [6] . These relationships are theoretically well established, yet direct field confirmation from hyper-arid interiors like the Taklamakan remains scarce because of logistical difficulties [7] . The Tarim Desert Highway, completed in 1995, runs 446 km through the heart of the desert and is protected by a narrow belt of irrigated vegetation and straw checkerboard barriers [8] . Maintaining this corridor requires accurate predictions of sand flux and dune advance rates, which in turn need field-calibrated transport data rather than wind-tunnel extrapolations. Earlier monitoring campaigns along the highway covered only transverse dune fields on the desert margin [9,10] ; data from the central desert-where barchan, linear, and star dunes coexist-are limited.
This research aimed to (a) measure seasonal and annual sand transport rates for three dune types in the central Taklamakan, (b) track dune migration distances and directions over a 3.5-year period, and (c) characterise grainsize variations between dune crests and interdune areas. The fieldwork was coordinated through the St. Petersburg College of Environmental Studies, Leningrad Oblast, Russia, in partnership with Chinese desert research stations.
Theoretical Background
Sand transport by wind is commonly described using the Bagnold equation, Q = C(ρ/g)•d/D•u*³, where Q is the mass transport rate, C is a dimensionless coefficient that varies with grain sorting, ρ is air density, g is gravitational acceleration, d and D are grain and reference diameters, and u* is the shear velocity [4] . Lettau and Lettau later modified this expression to incorporate a threshold shear velocity term, giving Q = C′(ρ/g)•u*²(u*-u*t), which better predicts transport onset under natural conditions [11] . For dune migration, the mass-balance approach equates the volumetric sand flux across a dune cross-section with the forward displacement of the dune body, so that migration rate is inversely proportional to dune height [6] . These theoretical relationships provided the framework for interpreting the field measurements in this research.
Materials and Methods
Materials and Methods
Materials
Eighteen monitoring stations were established across a 120 km transect in the central Taklamakan (approximately 39.1° N, 83.5° E). Stations were distributed among barchan fields (n = 6), linear dune corridors (n = 7), and star dune complexes (n = 5). Each station was equipped with a set of four Big Springs Number Eight (BSNE) sand traps mounted at heights of 0.1, 0.25, 0.5, and 1.0 m above the surface. Traps were emptied at monthly intervals when access permitted and at two-month intervals during winter. Graduated steel stakes (2 m height) were driven into dune crests and flanks to measure vertical profile changes. Satellite imagery (Pléiades tri-stereo, 0.5 m) was acquired at six-month intervals from 2019 to 2022. Meteorological data (wind speed, direction, temperature) came from two automatic weather stations positioned on flat interdune surfaces. All data were processed at the St. Petersburg College of Environmental Studies, Leningrad Oblast, Russia.
Methods
Sand transport rates (kg/m/day) were calculated from trap mass, collection interval, and orifice width following standard BSNE protocols [12] . Monthly rates were summed to produce annual fluxes. Dune migration was measured by digitising crest lines on successive Pléiades images coregistered to sub-pixel accuracy using ground control points. The displacement vector of each crest segment was decomposed into northward and eastward components. Grain-size distributions were obtained by laser diffraction (Malvern Mastersizer 3000) on 108 sediment samples collected from crest, stoss slope, lee slope, and interdune positions. Wind roses and sand drift potential (DP) were computed from 10-minute average wind records using the Fryberger method [13] . 1). Migration rate correlated inversely with dune height (r = -0.83, p<0.001), consistent with mass-balance theory. Crest grain sizes were finest on barchans (D50 = 0.18 mm) and coarsest on star dunes (0.23 mm). events per month (Figure 1). A secondary, smaller peak occurred in September-October. Winter months (December-February) recorded the lowest transport across all types. Barchan migration accelerated visibly during spring quarters and slowed during winter, producing a stepped cumulative curve (Figure 2). Linear and star dune curves were smoother, reflecting the damping effect of larger dune volumes on short-term wind variability.
Results
Results
Discussion
The transport rates measured here sit within the range reported for other hyper-arid deserts but on the high side.
Bagnold recorded values near 300 kg/m/yr for barchans in the Libyan Desert [4] , while more recent work in the Namib produced estimates of 200-450 kg/m/yr depending on wind regime [14] . The Taklamakan's spring dust-storm season, driven by cold-front passages sweeping across the Tarim Basin, generates brief but intense transport episodes that push annual totals upward [15] . The fact that nearly 40% of the yearly flux occurred in just two months (April and May) underlines the episodic character of aeolian transport in this setting.
The inverse relationship between dune height and migration rate (r = -0.83) matches the theoretical prediction that a taller dune body requires a larger sand volume to be moved before the crest can advance one-unit distance [6] . Star dunes, with heights averaging 28.7 m, moved only 4.3 m/yr, while the much smaller barchans (4.8 m) covered 17.6 m/yr. This pattern has been observed via satellite in the Sahara and the Arabian Rub' al Khali [16,17] , but our field measurements add direct ground-truth to those remotesensing estimates. Grain-size sorting between crests and interdune areas confirms selective transport during saltation. Finer grains are preferentially lofted onto dune crests, while coarser particles lag behind in deflation corridors-a welldocumented process but one that still influences how engineers design sand-control barriers [18] . For the Tarim Desert Highway, the barchan migration rate of 17.6 m/yr means that unprotected road segments could be buried under a fresh dune in as little as three to five years. These numbers support the continued maintenance of straw checkerboard grids and irrigated vegetation belts on both sides of the highway [8,19] .
Limitations
Several constraints should be noted when interpreting these results. First, the monitoring period (3.5 years) may not capture the full range of interannual wind variability; the Taklamakan experienced an above-average dust-storm season in 2021 that likely inflated that year's transport totals [20] . Second, BSNE trap efficiency declines at wind speeds above 15 m/s, so extreme-event transport may be underestimated [12] . Third, satellite-based migration measurements assume that crest-line displacement equals whole-dune movement, which can be misleading where dunes deform or merge. Finally, logistical access limited winter trap collection to two-month intervals, introducing coarser temporal resolution during low-flux months. Future campaigns should deploy continuous weighing sand traps and extend the monitoring window to at least five years.
Conclusion
This research quantified aeolian sediment transport and dune migration in the central Taklamakan Desert over a 3.5year monitoring period. Barchan dunes showed the highest sand flux (396.7 kg/m/yr) and fastest migration (17.6 m/yr), followed by linear and star dunes. The strong seasonal concentration of transport in April-May and the inverse height-migration relationship confirmed established aeolian theory with field-calibrated values from one of the world's least accessible sand seas. Grain-size sorting between crests and interdune corridors pointed to selective saltation as a persistent sorting mechanism. The practical take-away is that barchan dune advance along the Tarim Desert Highway corridor remains a real threat to infrastructure, and ongoing maintenance of protective barriers is warranted. Future work should extend the monitoring period, incorporate continuous weighing traps, and couple field data with numerical dune-evolution models to improve long-range encroachment forecasts.
Acknowledgement
Acknowledgements
Figures and tables from the paper
| Dune type | n | Transport (kg/m/yr) | Migration (m/yr) | Height (m) | D50 crest (mm) |
|---|---|---|---|---|---|
| Barchan | 6 | 396.7±84.3 | 17.6±3.9 | 4.8±1.2 | 0.18 |
| Linear | 7 | 279.4±61.7 | 11.0±2.4 | 12.3±3.7 | 0.21 |
| Star | 5 | 131.8±38.2 | 4.3±1.1 | 28.7±6.4 | 0.23 |
Table text extracted from the original PDF; superscript letters are shown inline. The original table image is below.
View original table image
References
21 in the original paper- Hedin S. Through Asia. Harper and Brothers. 1899. 1252 pp.
- Zhu Z, Wu Z, Liu S, et al. An outline of Chinese deserts. Science Press Beijing. 1980. p. 224.
- Wang X, Dong Z, Zhang J, et al. Modern dust storms in China: an overview. Journal of Arid Environments. 2004;58(4):559-574.
- Bagnold RA. The physics of blown sand and desert dunes. Methuen London. 1941. p. 265.
- Shao Y. Physics and modelling of wind erosion. Springer. 2008. p. 452.
- Lancaster N. Geomorphology of desert dunes. Routledge. 1995. p. 29.
- Dong Z, Wang X, Chen G. Monitoring sand dune advance in the Taklimakan Desert. Geomorphology. 2000;35(3-4):219-231.
- Qu J, Huang N, Dong G, et al. The role of the Tarim Desert Highway shelterbelt in aeolian control. Environmental Earth Sciences. 2013;68(6):1681-1692.
- Wang X, Dong Z, Zhang C, et al. Characterization of the composition of dust deposited on sand dune surfaces. Environmental Geology. 2006;49(7):10091016.
- Zhang K, Qu J, Liao K, et al. Sand control measures along the Tarim Desert Highway. Journal of Arid Environments. 2010;74(1):127-134.
- Lettau K, Lettau HH. Experimental and micrometeorological field studies of dune migration. IES Report. 1978;101:110-147.
- Fryrear DW. A field dust sampler. Journal of Soil and Water Conservation. 1986;41(2):117-120.
- Fryberger SG, Dean G. Dune forms and wind regime. US Geological Survey Professional Paper. 1979;1052:137-169.
- Livingstone I, Wiggs GFS, Weaver CM. Geomorphology of desert sand dunes: a review of recent progress. Earth-Science Reviews. 2007;80(34):239-257.
- Sun J, Zhang M, Liu T. Spatial and temporal characteristics of dust storms in China and its surrounding regions, 1960-1999. Journal of Geophysical Research. 2001;106(D10):10325-10333.
- Vermeesch P, Drake N. Remotely sensed dune celerity and sand flux measurements of the world's fastest barchans. Geophysical Research Letters. 2008;35(24):L24404.
- Elbelrhiti H, Claudin P, Andreotti B. Field evidence for surface-wave-induced instability of sand dunes. Nature. 2005;437(7059):720-723.
- Nickling WG, McKenna Neuman C. Aeolian sediment transport. Geomorphology of desert environments. Springer. 2009;517-555.
- Li S, Lei J, Xu X, et al. The effects of vegetation height and density on airflow over a vegetation-covered sand fence. Aeolian Research. 2013;11:1-8.
- Chen S, Huang J, Kang L, et al. Emission, transport, and radiative effects of mineral dust from the Taklimakan and Gobi deserts. Atmospheric Chemistry and Physics. 2017;17(18):11219-11235.
- Dong Z, Qian G, Luo W, et al. Grainsize characteristics of dune networks in China's Badain Jaran Desert. Sedimentology. 2009;56(6):1891-1905.