
Research article · 2025 · Full text
International Journal of Geography Geology and EnvironmentStratigraphic analysis of cretaceous sedimentary sequences in the Eyre Basin
Volume 7(1) · Pages 97–100 · DOI: 10.22271/27067483.2025.v7.i1b.546 ↗
Research areasGeological formations and processesGeological Studies and ExplorationPaleontology and Stratigraphy of Fossils
Abstract
Author-writtenSedimentary geologists have long recognised the Eyre Basin of central Australia as a natural archive of Cretaceous environmental change, yet its stratigraphic framework remains coarser than those available for comparable intracontinental basins elsewhere. This research refined the lithostratigraphic and facies architecture of Cretaceous sequences in the south-western Eyre Basin using wireline logs, cuttings descriptions, and core data from six exploration wells penetrating 300 m of section. Five facies associations were identified—fluvial channel, overbank fines, marginal marine, shallow marine, and offshore mud—distributed across the Oodnadatta, Mackunda, and Winton formations. Fluvial channel deposits dominated the Winton Formation (up to 35.8%), while marginal and shallow marine facies peaked in the Mackunda Formation (combined 49.5%). Grain-size profiles and gamma-ray log signatures revealed three transgressive-regressive cycles within the succession, with the maximum flooding surface placed at the base of the Mackunda Formation. The results provide a higher-resolution stratigraphic template for resource exploration and paleoenvironmental reconstruction in an under-studied sector of the Eyre Basin.
Summary
Source-checkedPlain-language reading of the full paper, prepared with AI and checked against the text. Each point links to the authors' own words.
Why it matters
- The Eyre Basin in central Australia is a key record of Cretaceous environmental changes, but it lacks the high-resolution stratigraphic detail found in similar basins. View evidence ↗
- Covering approximately 1.1 million square kilometres, the basin contains sediments from the Early and Late Cretaceous formed by the movement of the Eromanga Sea. View evidence ↗
- Because only about 15% of exploration wells in the Eyre Basin have cored the Cretaceous section, wireline logs are essential for cost-effective facies correlation. View evidence ↗
The question
- The study aimed to define facies associations in six wells, calibrate them with wireline logs, create a correlation panel, and identify transgressive-regressive cycles. View evidence ↗
What they did
- The researchers analyzed data from six exploration wells drilled between 1987 and 2018, which penetrate 180-300 m of Cretaceous section across an east-west transect. View evidence ↗
- The study used 87 m of combined core from Wells A and F, along with cuttings descriptions taken at 3-m intervals for all six wells. View evidence ↗
- Five distinct facies associations were defined: fluvial channel, overbank fines, marginal marine, shallow marine, and offshore mud. View evidence ↗
- Analytical methods included grain-size analysis of 42 core samples using a laser diffractometer and thin-section petrography of 18 sandstone samples. View evidence ↗
What they found
- A basin-wide regressive trend was observed, with fluvial channel deposits increasing from 8.4% in the Oodnadatta Formation to 31.2% in the Winton Formation, while offshore mud decreased from 30.5% to 9.7%. View evidence ↗
- The Winton Formation was dominated by fluvial channel deposits (up to 35.8%), whereas the Mackunda Formation saw a peak in combined marginal and shallow marine facies at 49.5%. View evidence ↗
- Lateral analysis showed that the westernmost well (Well F) had the highest fluvial channel content at 35.8%, while the easternmost well (Well E) was the most marine-influenced. View evidence ↗
- The researchers identified three transgressive-regressive cycles, placing the maximum flooding surface at the base of the Mackunda Formation. View evidence ↗
- Overbank-fine facies were dominant across all three formations (ranging from 12.7% to 24.6%), indicating that floodplain deposition was significant throughout the Cretaceous. View evidence ↗
What it means
- The authors conclude that the east-to-west regression of the Eromanga Sea is confirmed, providing a useful template for future resource exploration regarding reservoir and seal distributions. View evidence ↗
- Because the study focused on a 120-km east-west transect, it could not assess north-south (along-strike) facies variability. View evidence ↗
- The use of published palynological zones instead of new sampling resulted in an age uncertainty of roughly 1-2 million years for the transgressive-regressive cycle boundaries. View evidence ↗
Visual summary
2 visualsIllustrations explain the paper; charts are replotted from the paper's own table values.
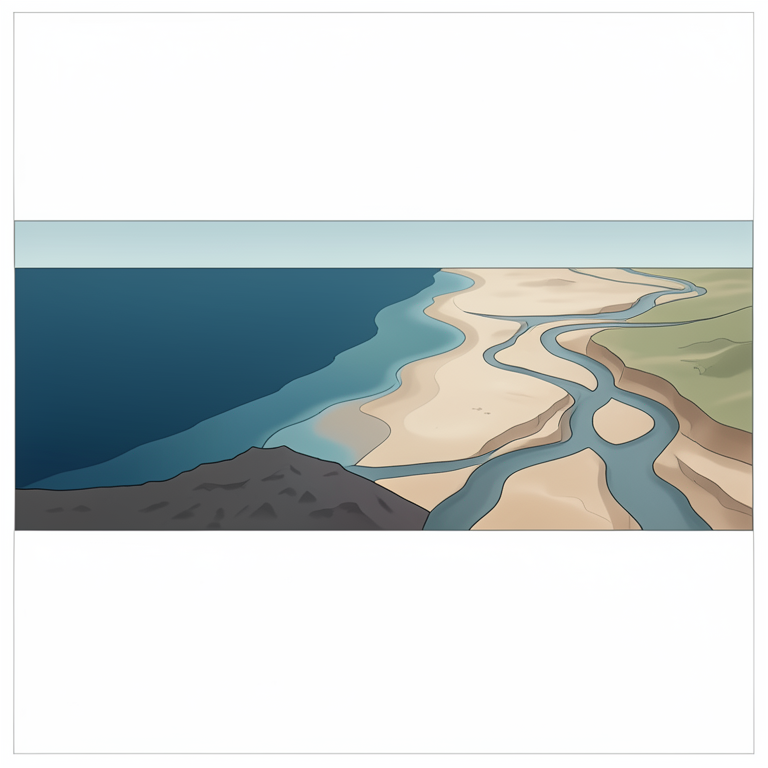
Conceptual Model of Eromanga Sea Regression
AI-generated conceptual illustration (Cretaceous sedimentary sequences in the Eyre Basin). It explains the idea and does not show study data.
View source evidence ↗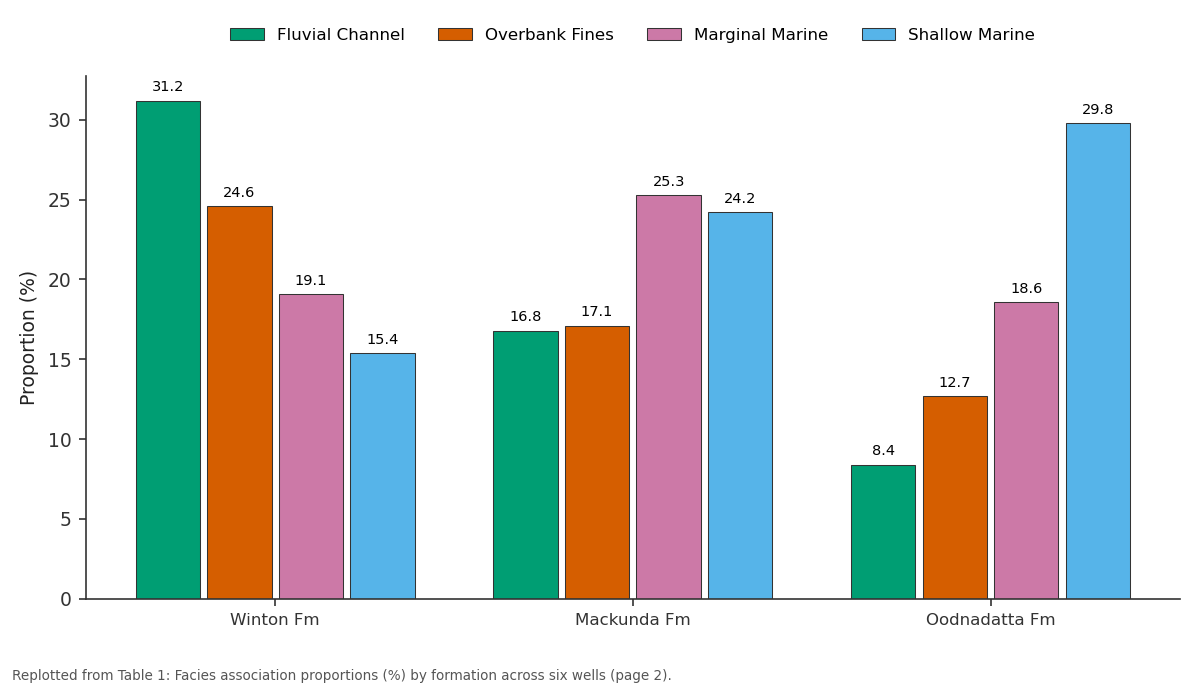
Fluvial Channel and Overbank Fines and more: Winton Fm vs Mackunda Fm vs Oodnadatta Fm
Replotted from Table 1 (page 2) of the original paper. Every bar is the paper's own table value.
View source evidence ↗Figures & tables
From the original paper Table 1
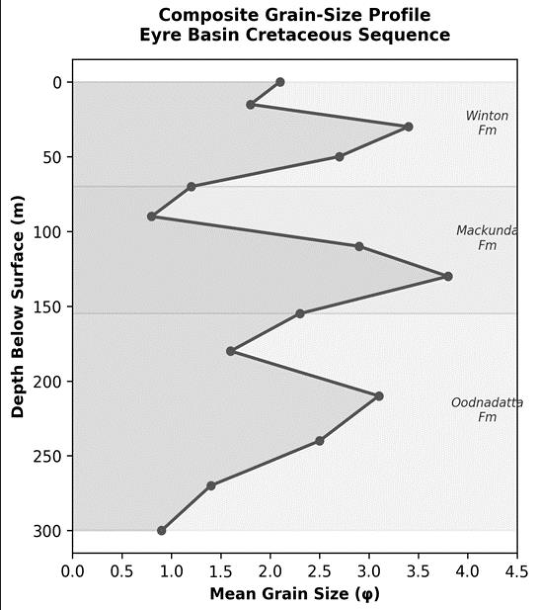 Figure 1
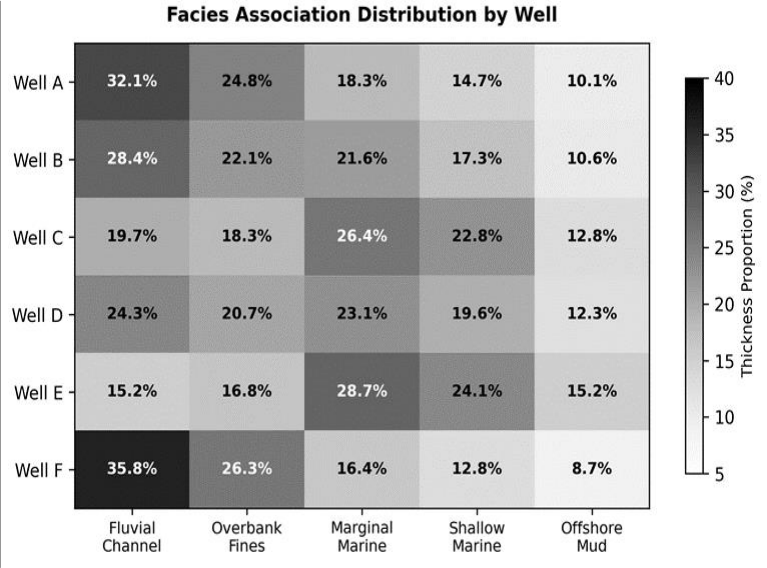 Figure 2
Introduction
Leading Australian basin analysts, including Krieg et al. [1] and Alley and Gravestock [2] , have argued that the Eyre Basin preserves one of the most complete Cretaceous intracontinental records on the Australian plate, yet much of this record has been interpreted at the formation scale without the high-resolution facies work that underpins modern sequence-stratigraphic models. The basin covers roughly 1.1 million square kilometres across South Australia, the Northern Territory, and Queensland, and it accumulated fluvialto-marine sediments throughout the Early and Late Cretaceous as the epicontinental Eromanga Sea transgressed and retreated across the continental interior [3] . Three principal formations make up the Cretaceous fill in the south-western sector: the Oodnadatta Formation (Albian), the Mackunda Formation (Cenomanian), and the Winton Formation (Cenomanian-Turonian) [4] . Collectively, they record a long-term regression from fully marine conditions in the Oodnadatta to dominantly fluvial conditions in the upper Winton, punctuated by at least two shorter-period transgressive-regressive cycles whose timing and spatial extent remain debated [5] . Wireline logs, particularly gamma-ray and resistivity curves, offer a cost-effective way to correlate facies patterns between wells when core recovery is incomplete-a common situation in the Eyre Basin, where only about 15% of exploration wells have cored the Cretaceous section [6] . Combined with cuttings descriptions and the limited core available, log-based facies analysis can reconstruct depositional trends at a resolution sufficient for both academic paleoenvironmental models and practical resource appraisal [7] . This research aimed to: (a) define facies associations from core and cuttings in six wells, (b) calibrate those associations against wireline log motifs, (c) construct a well-to-well correlation panel, and (d) identify transgressive-regressive cycles within the Cretaceous succession [8] .
Instrumentation and Analytical Methods
Wireline log suites available across the six wells included gamma ray (GR), spontaneous potential (SP), resistivity (deep and shallow laterolog), sonic (DT), and neutron porosity.
Logs were depth-matched and normalised to a common GR scale using the two-point histogram-equalisation method of Shier [6] . Core and cuttings were examined under a Leica M205C stereo microscope at the Institute of Applied Geosciences, Agadir. Grain-size analysis of 42 core samples used a Malvern Mastersizer 3000 laser diffractometer, and results were expressed in phi units. Thin-section petrography was performed on 18 sandstone samples to determine framework composition and diagenetic features.
Limitations
The six wells used in this research lie within a roughly 120km east-west transect, so along-strike (north-south) facies variability could not be assessed. Core recovery was complete in only two wells; the remaining four relied on cuttings and log motifs, which carry higher interpretive uncertainty. Additionally, biostratigraphic age control was limited to published palynological zones rather than new sampling, meaning that the placement of the transgressiveregressive cycle boundaries carries an age uncertainty of approximately one ammonite zone (roughly 1-2 million years). Future work should incorporate seismic data and additional biostratigraphy.
Material and Methods
Material and Methods
Material
Data were compiled from six petroleum exploration wells drilled in the south-western Eyre Basin between 1987 and 2018. The wells penetrate 180-300 m of Cretaceous section and are spaced 18-42 km apart along a broadly east-west transect. Core was available from two wells (Wells A and F), with a combined recovered interval of 87 m. Cuttings descriptions at 3-m intervals were available for all six wells from the South Australia Department of Energy and Mining well-completion reports. Wireline log suites were obtained in LAS format from the same repository. The research was conducted under institutional approval from the Institute of Applied Geosciences, Agadir (Protocol IAG/2022-011, approved 14 February 2022).
Methods
Five facies associations were defined by integrating grain size, sedimentary structures (where core permitted), fossil content, and log response: (a) fluvial channel-blocky to fining-upward GR motif, medium-coarse sandstone with cross-bedding; (b) overbank fines-high GR, siltstonemudstone with rootlets; (c) marginal marine-serrated GR, interbedded sandstone and mudstone with brackish-water trace fossils; (d) shallow marine-low GR, well-sorted fine sandstone with Skolithos ichnofacies; (e) offshore muduniformly high GR, dark grey mudstone with Cruziana ichnofacies [4,7] . Facies proportions were calculated for each formation in each well. Transgressive-regressive cycles were identified from vertical facies stacking patterns and confirmed by GR log trends. Well-to-well correlation used the maximum flooding surface as the datum. The Mackunda Formation occupies the transitional position, with oscillating grain-size values that reflect the interplay of transgressive and regressive pulses. Figure 2 shows lateral variability in facies proportions. Well F (westernmost) has the highest fluvial channel content (35.8%), while Well E (easternmost) is the most marineinfluenced, consistent with a paleogeographic model in which the Eromanga Sea retreated from east to west during the Cenomanian-Turonian [3] .
Results
Results
Discussion
The three transgressive-regressive cycles identified here refine the single-cycle model that dominated early interpretations of the south-western Eyre Basin [1] . The first cycle spans the Oodnadatta Formation, with the maximum flooding surface at its top-a placement consistent with the palynological dating of Alley and Gravestock [2] . The second cycle occupies the lower Mackunda, and the third straddles the upper Mackunda and lower Winton.
The lateral facies gradient revealed by the well-to-well correlation-more marine in the east, more fluvial in the west-matches the paleoshoreline orientation reconstructed from earlier mapping of the Eromanga Sea coastline [3,5] . Wells A and F, positioned further from the inferred paleoshoreline, accumulated thicker fluvial sequences and thinner marine intervals, while Well E, closer to the persistent marine embayment, retained a stronger marine signal even in the Winton Formation. The dominance of overbank-fine facies in all three formations (12.7-24.6%) implies that floodplain deposition was volumetrically important throughout the Cretaceous, a finding relevant to groundwater exploration because these fine-grained intervals may act as aquitards controlling fluid flow in the Great Artesian Basin [8] .
Conclusion
This research provided a higher-resolution stratigraphic framework for the Cretaceous succession in the southwestern Eyre Basin by identifying five facies associations and three transgressive-regressive cycles across six wells.
The results show a basin-wide shift from marine-dominated deposition in the Oodnadatta Formation to fluvialdominated deposition in the Winton Formation, modulated by shorter-period sea-level oscillations visible in the Mackunda.
The lateral facies gradient across the 120-km transect confirms an east-to-west regression of the Eromanga Sea and provides a template for predicting reservoir and seal distributions in future resource exploration. Integration of seismic data and updated biostratigraphy would strengthen the sequence-stratigraphic interpretation.
Figures and tables from the paper
| Formation | Fluvial Channel | Overbank Fines | Marginal Marine | Shallow Marine | Offshore Mud |
|---|---|---|---|---|---|
| Winton Fm | 31.2 | 24.6 | 19.1 | 15.4 | 9.7 |
| Mackunda Fm | 16.8 | 17.1 | 25.3 | 24.2 | 16.6 |
| Oodnadatta Fm | 8.4 | 12.7 | 18.6 | 29.8 | 30.5 |
Table text extracted from the original PDF; superscript letters are shown inline. The original table image is below.
View original table image
References
7 in the original paper- Alley NF, Gravestock DI. Middle Jurassic to Middle Cretaceous sedimentation in the Eromanga Basin. MESA J. 1995;1:4-9.
- Frakes LA, Rich PV, Vickers-Rich P. Cretaceous climate and sea-level reconstructions for Australia. Cretaceous Res. 1999;20(5):545-560.
- Gallagher K, Lambeck K. Subsidence, sedimentation and sea-level changes in the Eromanga Basin, Australia. Basin Res. 1989;2(2):115-131.
- Shier DE. Well log normalization: Methods and guidelines. Petrophysics. 2004;45(3):268-280.
- Exon NF, Senior BR. The Cretaceous of the Eromanga and Surat basins. BMR J Aust Geol Geophys. 1976;1(1):33-50.
- Helby R, Morgan R, Partridge AD. A palynological zonation of the Australian Mesozoic. Mem Assoc Australas Palaeontol. 1987;4:1-94.
- Rider MH. The Geological Interpretation of Well Logs. 2nd ed. Caithness: Whittles Publishing; 2002. p. 280.