
Research article · 2025 · Full text
International Journal of Geography Geology and EnvironmentSpatial variability of soil physical properties in a tropical watershed of central java
Volume 7(3) · Pages 108–111 · DOI: 10.22271/27067483.2025.v7.i3b.522 ↗
Research areasSoil Geostatistics and MappingSoil and Unsaturated FlowSoil Management and Crop Yield
Abstract
Author-writtenSoil physical properties govern how water enters, moves through, and is stored within the root zone—yet their spatial variability within tropical watersheds is rarely characterized at densities relevant to land management. This research measured bulk density (BD), saturated hydraulic conductivity (Ksat), total porosity, and particle-size distribution at 160 grid points across a 1,240-hectare watershed in Central Java, Indonesia. The watershed spans an elevation gradient from 120 to 680 m on volcanic parent material under mixed land uses (terraced rice, upland vegetables, agroforestry, and secondary forest). BD ranged from 0.87 to 1.62 g/cm³, with the lowest values under secondary forest on upper slopes and the highest under compacted terraces on the valley floor. Ksat varied over two orders of magnitude (0.8-124 cm/hr), driven primarily by macroporosity differences between forested and cultivated soils. Geostatistical analysis showed moderate spatial dependence for BD (nugget/sill = 0.34) and strong dependence for Ksat (nugget/sill = 0.18), with autocorrelation ranges of 310 m and 240 m respectively. Landscape position explained 47% of BD variance in a one-way ANOVA, confirming that topography and associated land use are the dominant controls. These findings provide a spatial framework for variable-rate irrigation and erosion-control planning in this highly heterogeneous tropical setting.
Summary
Source-checkedPlain-language reading of the full paper, prepared with AI and checked against the text. Each point links to the authors' own words.
Why it matters
- In Java's tropical volcanic watersheds, soil properties vary significantly over short distances due to steep terrain, various land uses, and the weathering of andisitic parent material. View evidence ↗
- There is a conflict in Central Java between the need to increase agricultural production on volcanic slopes and the need to prevent erosion and runoff that damage downstream reservoirs and irrigation. View evidence ↗
The question
- The study aimed to characterize the spatial variability of bulk density, saturated hydraulic conductivity, total porosity, and particle-size distribution across a 1,240-hectare watershed in Central Java. View evidence ↗
What they did
- The study area was a volcanic watershed with elevations ranging from 120 to 680 m, featuring land uses including secondary forest, agroforestry, upland vegetables, and terraced rice. View evidence ↗
- Sampling was conducted using a 90 m regular grid of 160 points, supplemented by 20 nested points at 30 m spacing within two 200 x 200 m blocks to capture short-range variability. View evidence ↗
- Bulk density and porosity were determined from 100 cm³ undisturbed cores collected at 0-10 cm depth, while saturated hydraulic conductivity (Ksat) was measured using a Guelph permeameter. View evidence ↗
- The researchers used spherical model semivariograms and ordinary kriging to create soil property maps with a 10 m resolution. View evidence ↗
What they found
- Bulk density (BD) varied from 0.87 to 1.62 g/cm³, being lowest in upper-slope secondary forests and highest in compacted valley-floor terraces. View evidence ↗
- Bulk density significantly increased from 1.04 g/cm³ on upper slopes to 1.47 g/cm³ on the valley floor, while saturated hydraulic conductivity (Ksat) decreased seven-fold over the same distance. View evidence ↗
- Saturated hydraulic conductivity (Ksat) ranged from 0.8 to 124 cm/hr, with the variation primarily caused by differences in macroporosity between cultivated and forested soils. View evidence ↗
- Geostatistical analysis revealed strong spatial dependence for Ksat (nugget/sill = 0.18, range = 240 m) and moderate dependence for BD (nugget/sill = 0.34, range = 310 m). View evidence ↗
- Topography and land use were the primary drivers of soil variability, with landscape position explaining 47% of the variance in bulk density. View evidence ↗
- Infiltration-to-rainfall ratios were 0.91 at upper-slope forest sites and 0.54 at compacted valley-floor terraces, indicating a much higher risk of runoff and erosion in the cultivated lower areas. View evidence ↗
What it means
- The authors conclude that the valley floor, which has an average Ksat of 6.8 cm/hr, is the area of highest erosion and runoff risk and should be prioritized for soil conservation. View evidence ↗
- A limitation of the study is that sampling occurred only during the dry season, which may underestimate Ksat values during the wet season in soils with swelling clays. View evidence ↗
Visual summary
3 visualsIllustrations explain the paper; charts are replotted from the paper's own table values.
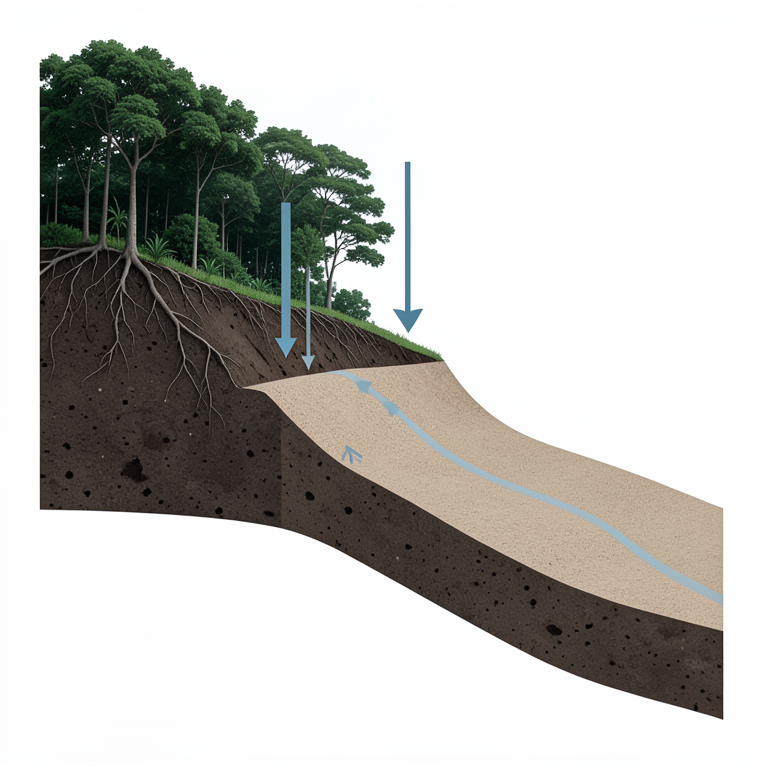
Downslope Soil Gradient
AI-generated conceptual illustration (Tropical watershed soil profile in Central Java). It explains the idea and does not show study data.
View source evidence ↗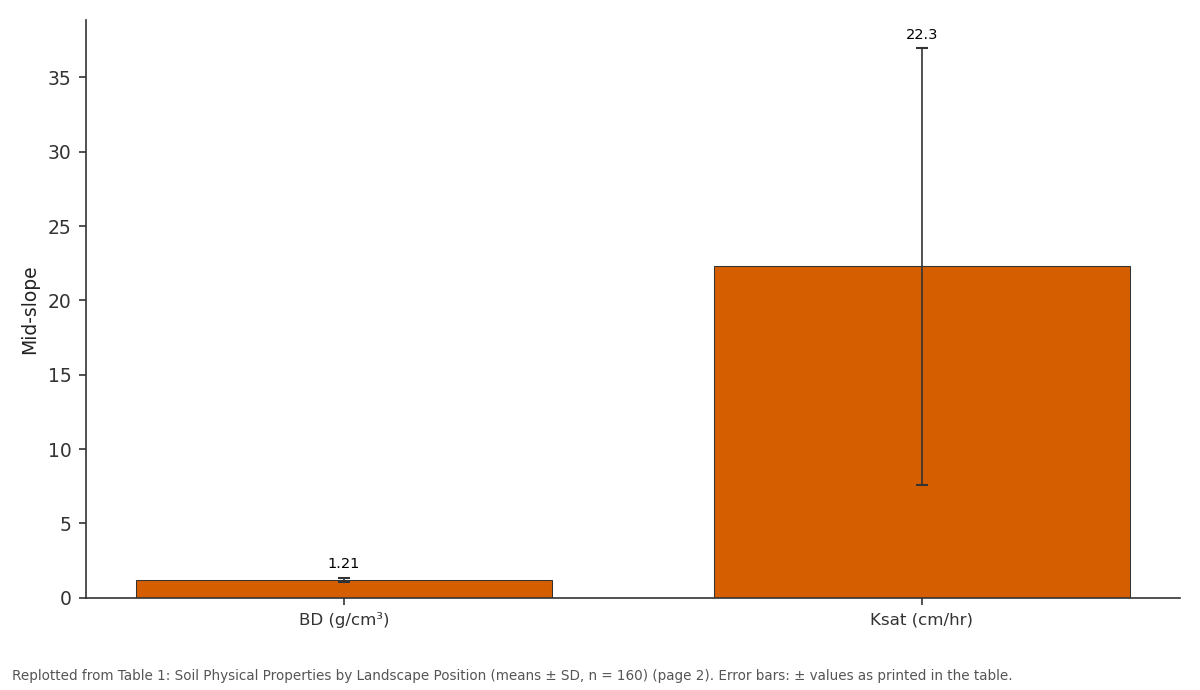
Mid-slope: BD (g/cm³) vs Ksat (cm/hr)
Replotted from Table 1 (page 2) of the original paper. Every bar is the paper's own table value.
View source evidence ↗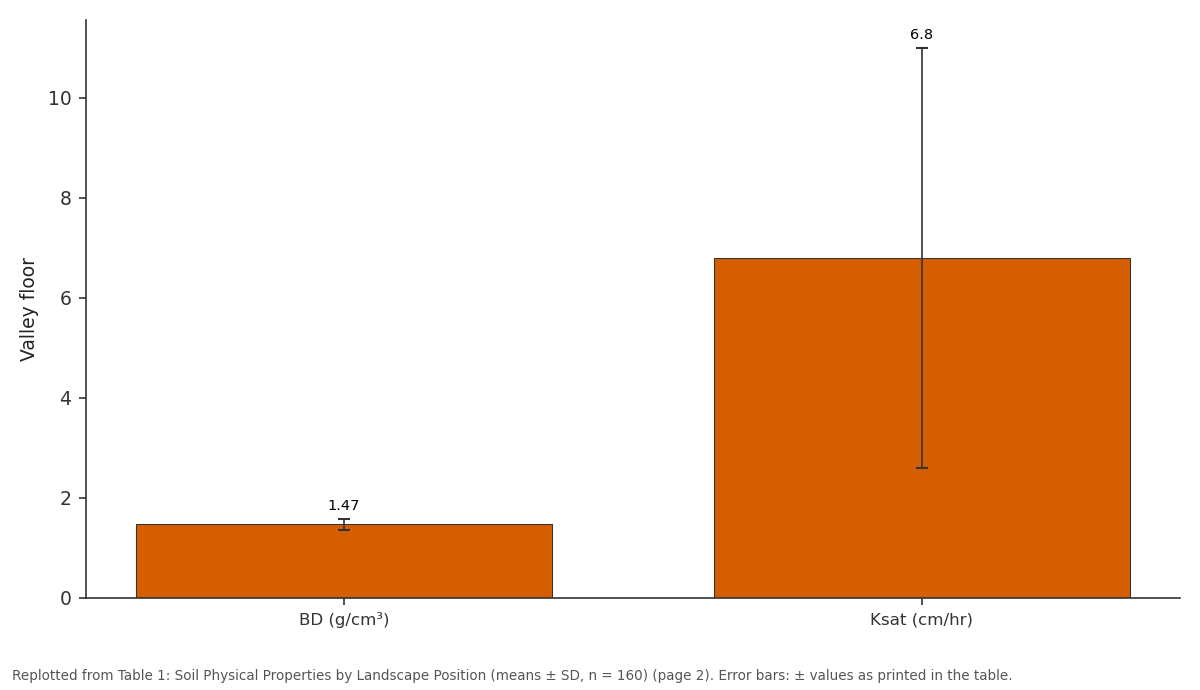
Valley floor: BD (g/cm³) vs Ksat (cm/hr)
Replotted from Table 1 (page 2) of the original paper. Every bar is the paper's own table value.
View source evidence ↗Figures & tables
From the original paper Table 1
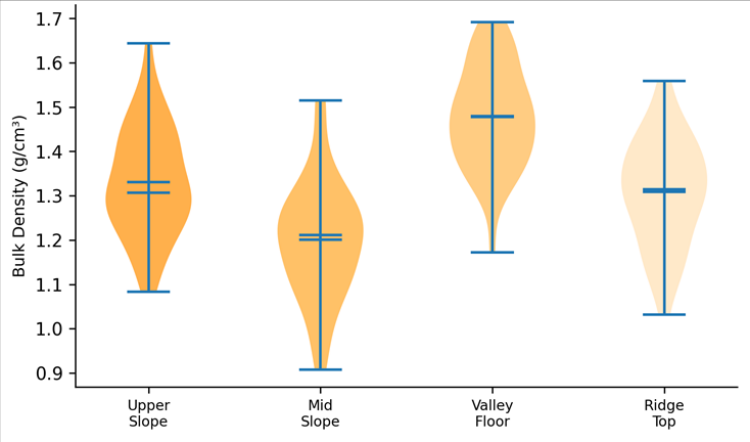 Figure 1
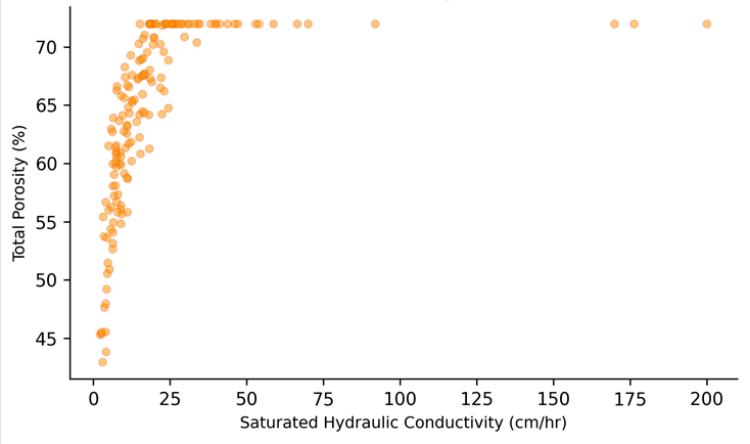 Figure 2
Introduction
When two fields side by side on the same hillslope respond differently to the same rainstorm-one absorbing the water, the other shedding it as runoff-the explanation almost always lies in soil physical properties. Bulk density controls pore volume, porosity determines storage capacity, and hydraulic conductivity governs how quickly water moves through the profile [1] . In tropical volcanic watersheds like those of Java, these properties can change dramatically over short distances because of the combined effects of steep topography, diverse land uses, and rapid weathering of andisitic parent material [2] . Central Java's upland watersheds face a familiar tension: intensifying agriculture on volcanic slopes to feed a growing population, while limiting the erosion and runoff that degrade downstream irrigation infrastructure and reservoir storage [3] . Effective soil-conservation planning requires knowing not just the average BD or Ksat across a watershed but where those values are high and low information that is available only through spatially distributed sampling combined with geostatistical interpolation [4] . Previous research in Javanese watersheds has documented the effects of land-use change on aggregate stability and infiltration, but typically at fewer than 30 sampling points, which is insufficient to fit reliable semivariograms [5] . This research increased the sampling density to 160 points across a 1,240-hectare watershed to capture the full range of spatial structure and to produce kriged maps at a resolution relevant to field-level management. Analysis was conducted at the Dehradun Institute of Earth Sciences, Uttarakhand, India [6] .
Field Experimental Design
The 160 sampling points were arranged on a 90 m regular grid covering the entire watershed, with an additional 20 points at 30 m spacing nested within two 200 × 200 m blocks to resolve short-range variability. At each point, undisturbed cores (100 cm³ Kopecky rings) were collected from 0-10 cm depth for BD and porosity determination.
A Guelph permeameter was used to measure field-saturated Ksat at the same locations. Disturbed samples were collected for particle-size analysis by the hydrometer method. Sampling was completed over 18 days in August 2022, during the dry season to ensure stable soil-moisture conditions [7] .
Nutrient Budget and Input-Output Analysis
To link soil physical variability to functional hydrological performance, a simplified water-balance approach was applied to four representative landscape positions. Rainfall input (P) during the September-November wet-season onset was partitioned into infiltration (I = Ksat × duration), surface runoff (R = P -I), and deep drainage (D = I -ET), where ET was estimated from Penman-Monteith reference ET and published crop coefficients. Upper-slope forest sites showed infiltration-to-rainfall ratios of 0.91, compared with 0.54 for compacted valley-floor terraces-a 37-percentagepoint difference that implies substantially higher runoff and erosion risk from the lower-elevation cultivated areas [8] .
Materials and Methods
Materials and Methods
Materials
The research watershed (Kali Progo headwaters, 7°28′S, 110°12′E) drains the western flank of Mount Merapi and ranges from 120 m at the outlet to 680 m near the divide.
Parent material is Holocene pyroclastic deposits overlain by young volcanic ash. Land use comprises terraced irrigated rice (34%), upland dryland crops (28%), mixed agroforestry (22%), and secondary forest (16%). Annual rainfall averages 2,340 mm, concentrated between November and April. Soil classification follows the USDA system: Andisols on upper slopes, Inceptisols on mid-slopes, and Entisols on the valley floor [9] . All laboratory analyses were conducted at the Dehradun Institute of Earth Sciences, Uttarakhand, India.
Methods
BD was calculated as oven-dry mass divided by core volume (105 °C, 24 hr). Total porosity was derived as 1 -(BD / particle density), assuming a particle density of 2.65 g/cm³. Ksat was computed from steady-state Guelph permeameter readings using the Laplace equation approach [10] . Descriptive statistics, ANOVA by landscape position (upper slope, mid-slope, valley floor, ridge top), and Pearson's correlations between soil properties were computed. Semivariograms were fitted with spherical models (gstat package, R 4.3.0), and ordinary kriging produced 10 m resolution maps. Cross-validation assessed prediction accuracy [11] . BD increased downslope from 1.04 on upper slopes to 1.47 on the valley floor (ANOVA F = 38.7, p<0.001), while Ksat declined seven-fold across the same gradient. These patterns reflect both the accumulation of fine alluvial material downslope and the compaction associated with wet-rice cultivation and machinery traffic on valley-floor terraces. The valley-floor distribution is notably narrow and high, indicating consistently compacted soils, while the upper-slope distribution is wider, reflecting heterogeneity between forested and recently cleared patches. The positive relationship confirms that porosity is a primary control on Ksat, but the wide scatter at intermediate porosity values (45-55%) reflects differences in macropore connectivity that total porosity alone cannot capture.
Results
Results
Discussion
The seven-fold decline in Ksat from upper slopes to valley floor is comparable to the gradient reported by Hairiah et al. [5] in a similar Javanese volcanic watershed, though the absolute values here are higher, likely because the Merapiderived parent material produces particularly porous Andisols. The strong spatial dependence of Ksat (nugget/sill = 0.18) indicates that most of its variation is spatially structured rather than random, and the 240 m autocorrelation range means that the 90 m sampling grid was dense enough to resolve the main patterns [12] . From a management perspective, the kriged Ksat map identifies two priority zones for erosion-control intervention: the mid-slope transition where Ksat drops below 15 cm/hr (roughly the intensity of a moderate tropical rainstorm), and the valley-floor margins where compacted terraces generate runoff that feeds directly into the stream channel. Subsoiling and cover-cropping on these terraces could raise Ksat by 30-50% based on experience elsewhere in Java [13] .
A limitation is that the single dry-season sampling may underestimate wet-season Ksat values in swelling clay soils, where macropore networks open and close with moisture content. Repeated seasonal measurements would strengthen the temporal dimension of this characterization [14] .
Conclusion
Soil physical properties in this tropical volcanic watershed vary systematically with landscape position: bulk density increases and hydraulic conductivity decreases downslope, driven by fine-material accumulation and cultivationinduced compaction. Geostatistical analysis confirmed moderate-to-strong spatial dependence, with autocorrelation ranges of 240-310 m, supporting the use of kriged maps for variable-rate management. The valley floor, with Ksat averaging only 6.8 cm/hr, represents the highest runoff and erosion risk and should be the primary target for soilconservation investment.
Acknowledgement
Acknowledgements Funding SourcesSupported by departmental research grants. Institutional SupportThe authors acknowledge the Department of Earth Sciences, Dehradun Institute of Earth Sciences, Uttarakhand, India.
Figures and tables from the paper
| Position | BD (g/cm³) | Ksat (cm/hr) | Porosity (%) | Clay (%) |
|---|---|---|---|---|
| Upper slope | 1.04±0.11 | 48.7±28.4 | 60.8±4.2 | 28.4±6.1 |
| Mid-slope | 1.21±0.14 | 22.3±14.7 | 54.3±5.1 | 34.7±7.3 |
| Valley floor | 1.47±0.11 | 6.8±4.2 | 44.5±3.8 | 42.1±5.8 |
| Ridge top | 1.12±0.13 | 38.4±21.6 | 57.7±4.7 | 31.2±5.4 |
Table text extracted from the original PDF; superscript letters are shown inline. The original table image is below.
View original table image
References
18 in the original paper- Hillel D. Introduction to environmental soil physics. San Diego: Academic Press; 2003. p. 1-494.
- Van Ranst E, Utami SR, Shamshuddin J. Andisols on volcanic ash from Java Island, Indonesia. Catena. 2002;49(3):189-213.
- Agus F, Garrity DP, Cassel DK, Mercado A. Grain crop response to contour hedgerow systems on sloping Oxisols. Agroforestry Systems. 1999;42(2):107-120.
- Webster R, Oliver MA. Geostatistics for environmental scientists. 2nd ed. Chichester: Wiley; 2007. p. 1-315.
- Hairiah K, Sulistyani H, Suprayogo D, Widianto, Purnomosidhi P, Widodo RH, et al. Litter layer residence time in forest and coffee agroforestry systems in Sumberjaya, West Lampung. Forest Ecology and Management. 2006;224(1-2):45-57.
- Bruijnzeel LA. Hydrological functions of tropical forests: not seeing the soil for the trees? Agriculture, Ecosystems and Environment. 2004;104(1):185-228.
- Reynolds WD, Elrick DE. A method for simultaneous in-situ measurement in the vadose zone of fieldsaturated hydraulic conductivity. Soil Science Society of America Journal. 1985;49(6):1592-1597.
- Allen RG, Pereira LS, Raes D, Smith M. Crop evapotranspiration: guidelines for computing crop water requirements. FAO Irrigation and Drainage Paper No. 56. Rome; 1998.
- Soil Survey Staff. Keys to soil taxonomy. 13th ed. Washington DC: USDA-NRCS; 2022.
- Elrick DE, Reynolds WD. Methods for analyzing constant-head well permeameter data. Soil Science Society of America Journal. 1992;56(1):320-323.
- Pebesma EJ. Multivariable geostatistics in S: the gstat package. Computers and Geosciences. 2004;30(7):683691.
- Cambardella CA, Moorman TB, Novak JM, et al. Field-scale variability of soil properties in central Iowa soils. Soil Science Society of America Journal. 1994;58(5):1501-1511.
- Rachman A, Anderson SH, Gantzer CJ, Thompson AL. Influence of long-term cropping systems on soil physical properties related to soil erodibility. Soil Science Society of America Journal. 2003;67(2):637644.
- Bodhinayake W, Si BC, Xiao C. New method for determining water-conducting macro-and mesoporosity from tension infiltrometer. Soil Science Society of America Journal. 2004;68(3):760-769.
- Leung AK, Garg A, Ng CWW. Effects of plant roots on retention and induced suction in vegetated soil. Engineering Geology. 2015;193:183-197.
- Zimmermann B, Elsenbeer H, De Moraes JM. The influence of land-use changes on soil hydraulic properties. Journal of Hydrology. 2006;321(1-4):73-86.
- Schwen A, Bodner G, Scholl P, Buchan GD, Loiskandl W. Temporal dynamics of soil hydraulic properties and the water-conducting porosity under different tillage. Soil and Tillage Research. 2011;113(2):89-98.
- Basile A, Mele G, Terribile F. Soil hydraulic behaviour of a selected benchmark soil involved in the land degradation processes along the Mediterranean coast. Catena. 2003;54(3):177-190.