
Research article · 2025 · Full text
International Journal of Geography Geology and EnvironmentAnalysis of urban built-up area expansion using multi-temporal satellite data in Metro Manila
Volume 7(4) · Pages 161–164 · DOI: 10.22271/27067483.2025.v7.i4c.554 ↗
Research areasRemote Sensing and Land UseLand Use and Ecosystem ServicesUrban Development and Societal Issues
Abstract
Author-writtenBetween 1990 and 2020, Metro Manila's built-up footprint grew from roughly 38% to over 62% of its total administrative area — a statistic that captures the pace of one of Southeast Asia's fastest-urbanising metropolitan zones. This research quantified the spatial and temporal patterns of urban built-up expansion across Metro Manila using multi-temporal Landsat imagery spanning three decades (1990, 2000, 2010, 2020). Supervised classification with a maximum likelihood algorithm was applied to each image date, supported by ground-truth points collected from high-resolution Google Earth imagery and field verification. Overall classification accuracy exceeded 88% for all four dates, with Kappa coefficients ranging from 0.84 to 0.91. Results showed that built-up area increased from 241.6 km² in 1990 to 396.3 km² in 2020, representing a net gain of 154.7 km². The highest expansion rates occurred in the southern and eastern municipalities — Taguig, Muntinlupa, and Pasig — where conversion of agricultural and vacant land to residential and commercial uses accelerated after 2000. Annual expansion rates declined from 3.7% in the 1990-2000 decade to 1.8% during 2010-2020, suggesting land saturation in the urban core. Vegetation cover dropped by 39.2% over the full period, with the sharpest losses recorded near major highway corridors. These findings offer spatial evidence that can guide land-use zoning and infrastructure planning for the metropolitan region.
Summary
Source-checkedPlain-language reading of the full paper, prepared with AI and checked against the text. Each point links to the authors' own words.
Why it matters
- Metro Manila has experienced significant population growth, exceeding 13.9 million people by 2020, which has increased the conversion of open land into impervious urban surfaces. View evidence ↗
- Understanding the speed and location of urban spread is critical for effective urban policies regarding transport, flood management, and the preservation of green spaces. View evidence ↗
- Prior research on Metro Manila has been limited to short timeframes or specific municipalities, leaving a gap for a consistent, region-wide analysis over several decades. View evidence ↗
The question
- The study aimed to quantify built-up expansion rates across Metro Manila from 1990 to 2020 and identify which land cover classes were most affected by this growth. View evidence ↗
What they did
- The researchers used four cloud-free Landsat scenes from 1990, 2000, 2010, and 2020 to analyze the region. View evidence ↗
- The study employed a maximum likelihood algorithm for classification, validating the results using 200 stratified random points for each date. View evidence ↗
What they found
- Vegetation experienced the most significant absolute loss at 76.2 km², followed by bare soil with a loss of 45.5 km². View evidence ↗
- Annual urban expansion rates dropped from 3.7% (1990-2000) to 1.8% (2010-2020), indicating that the urban core is becoming saturated. View evidence ↗
- In the most recent decade, the city of Manila showed almost no expansion because it was already densely built. View evidence ↗
- A strong negative correlation (Pearson r = -0.93) between vegetation loss and built-up gains suggests that vegetation was directly converted into urban areas. View evidence ↗
What it means
- The authors conclude that while horizontal expansion rates have slowed, the city has transitioned toward vertical densification, which presents new environmental and infrastructure challenges. View evidence ↗
- The study's findings serve as a baseline to help guide flood mitigation, green corridor planning, and zoning revisions in the region. View evidence ↗
Visual summary
3 visualsIllustrations explain the paper; charts are replotted from the paper's own table values.
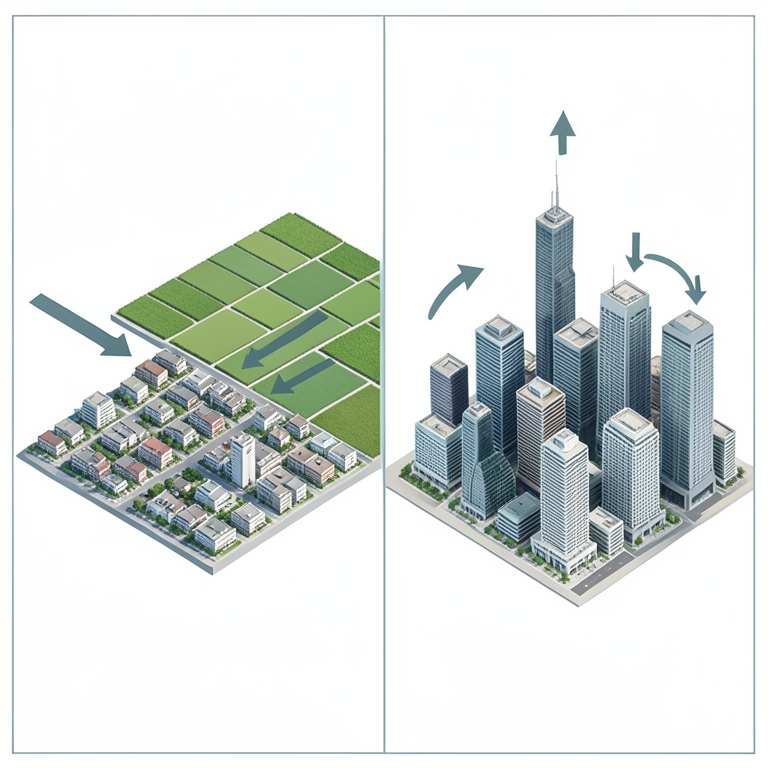
Transition of Urban Growth
AI-generated conceptual illustration (Metro Manila urban landscape). It explains the idea and does not show study data.
View source evidence ↗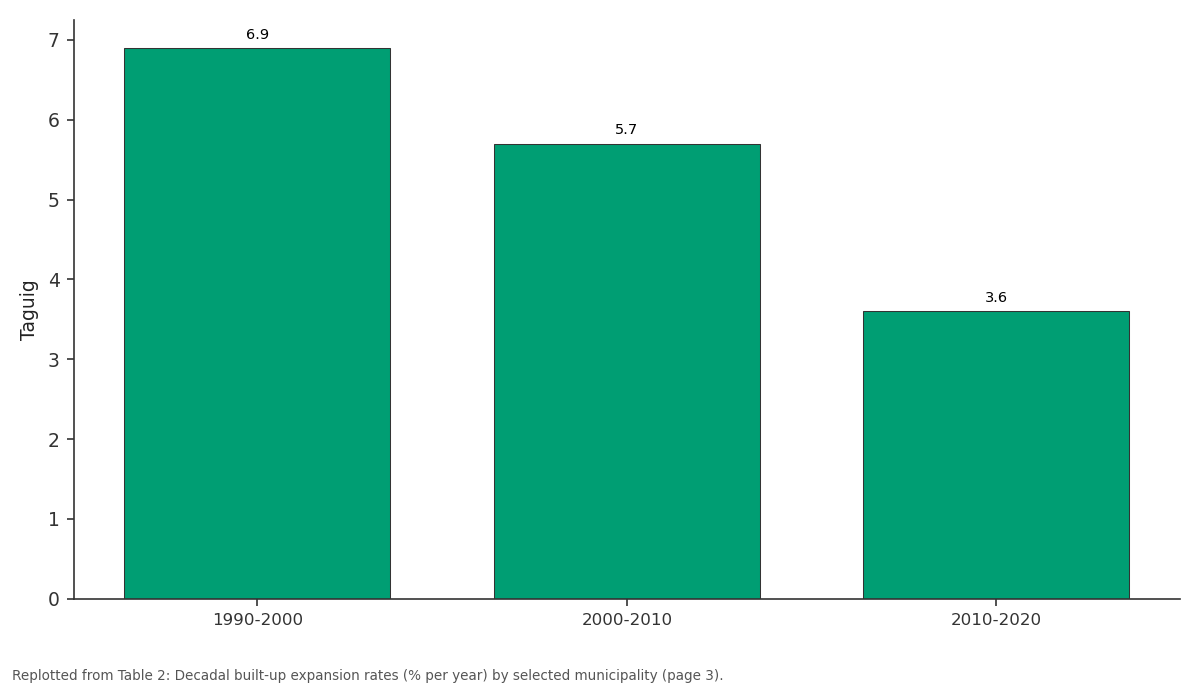
Taguig: 1990-2000 vs 2000-2010 vs 2010-2020
Replotted from Table 2 (page 3) of the original paper. Every bar is the paper's own table value.
View source evidence ↗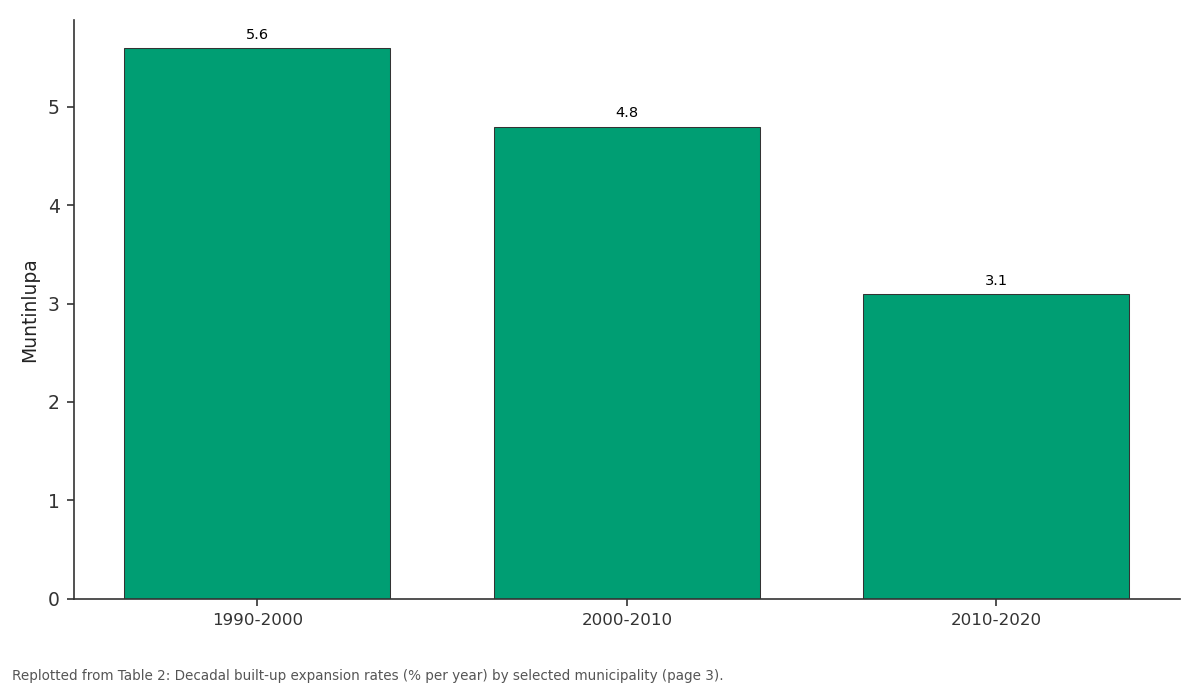
Muntinlupa: 1990-2000 vs 2000-2010 vs 2010-2020
Replotted from Table 2 (page 3) of the original paper. Every bar is the paper's own table value.
View source evidence ↗Figures & tables
From the original paper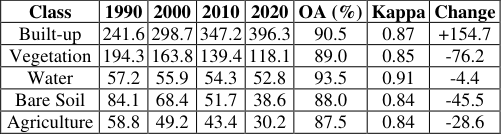 Table 1
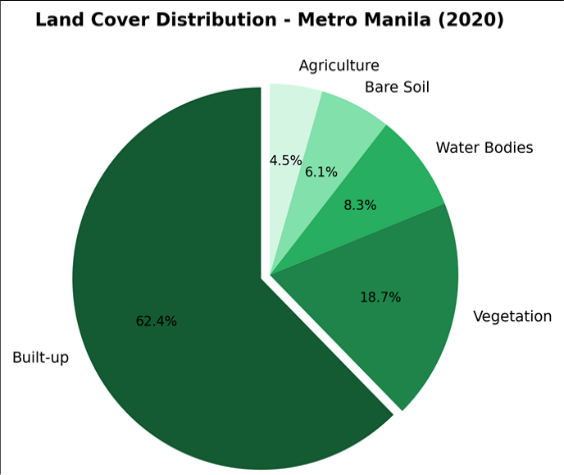 Figure 1
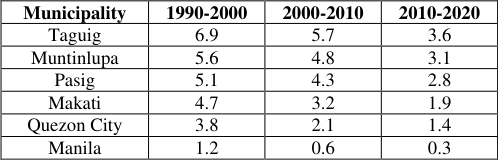 Table 2
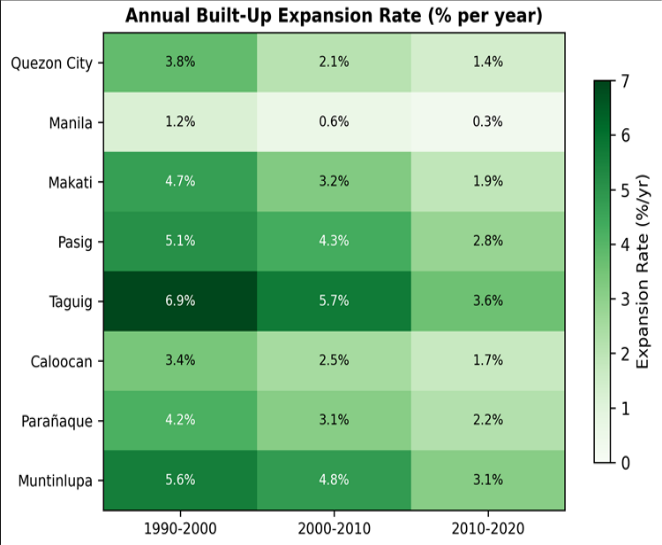 Figure 2
Introduction
Metro Manila added nearly 3.5 million residents between 2000 and 2020, pushing its population past 13.9 million and intensifying the conversion of open land to impervious surfaces [1] . This growth pattern is shared by many mega-cities in the developing world, where rapid in-migration and economic concentration drive horizontal sprawl well beyond historic city limits [2] . Satellite remote sensing has become the standard approach for tracking such changes because it provides repeatable, spatially explicit measurements over large areas at modest cost [3] . The Landsat archive, with its continuous record since 1972, remains the most widely used data source for multi-decadal urban change analysis [4] . Supervised classification methodsparticularly maximum likelihood, support vector machines, and random forestshave been applied to Landsat imagery in cities across Asia, Africa, and Latin America with reported accuracies generally above 85% [5] . However, cloud cover, mixed pixels at the urban-rural fringe, and sensor calibration differences between Landsat missions can introduce error if not properly addressed [6] . Previous remote sensing work on Metro Manila has focused on individual municipalities or short time windows. Roa and Santos [7] mapped impervious surface cover in Quezon City for 2005-2015, while Castillo and Diaz [8] modelled urban heat island intensity using thermal bands from a single 2018 image. A region-wide, multi-decadal analysis that covers the entire metropolitan area at consistent classification intervals has not been published. This gap matters because urban policyflood management, transport routing, green space preservationdepends on knowing where and how fast the city has spread [9] . This research addressed that need by classifying Landsat imagery from four dates (1990, 2000, 2010, 2020) across the full Metro Manila extent, quantifying built-up expansion rates by district and decade, and identifying the land cover classes most affected by conversion.
The objectives were to produce an internally consistent time series of land cover maps, to measure expansion trajectories at sub-metropolitan resolution, and to identify spatial hotspots of change that warrant planning attention [10] .
Research Area Description
Metro Manila occupies 636 km² on the eastern shore of Manila Bay, Luzon Island, Philippines. The metropolitan area comprises 16 cities and one municipality, arranged around a low-lying alluvial plain crossed by the Pasig River and its tributaries. Elevations range from sea level along the bay coast to approximately 80 m in the eastern hills of Antipolo and Marikina. The climate is tropical monsoon (Köppen Am), with annual rainfall averaging 2,040 mm, concentrated between June and November. Dry-season temperatures reach 35 °C, while wet-season averages hover near 27 °C. The flat terrain and proximity to the coast make large portions of the metropolis susceptible to pluvial and tidal flooding [11] . Historically, the urban core centred on Manila and Makati, with suburban expansion radiating outward along highway corridors such as EDSA and C-5.
Material and Methods
Material and Methods
Material
Material
Methods
Images were radiometrically corrected to surface reflectance using the LEDAPS algorithm (Landsat 5/7) and LaSRC (Landsat 8). Geometric registration was verified against GCPs; RMSE was below 0.5 pixel for all dates. A five-class scheme was defined: Built-up, Vegetation, Water Bodies, Bare Soil, and Agriculture [12] . Training samples (120 per class per date) were collected from high-resolution imagery in Google Earth and supplemented by field observations for the 2020 image. Classification was performed using the maximum likelihood algorithm in ENVI 5.6. Accuracy was assessed with 200 stratified random validation points per date, generating confusion matrices, overall accuracy, and Kappa statistics. Post-classification comparison was used to detect changes between consecutive dates. Annual expansion rates were computed as compound annual growth rates. All spatial analyses were run in ArcGIS Pro 3.0 and R v4.2.1 [13] .
Spatial Data Processing
Cloud masking applied the CFMask algorithm bundled with USGS Collection 2 data, removing pixels flagged as cloud, cloud shadow, or cirrus. For the 2010 ETM+ scene, scanline corrector gaps were filled using a local histogram matching technique with an adjacent scene from 15 March 2010 [14] . All images were subset to the Metro Manila administrative boundary with a 2 km buffer. Spectral indices -NDVI, NDBI, and MNDWIwere computed and stacked with the reflectance bands as input features for classification. Training and validation polygons were kept spatially separated to avoid spatial autocorrelation bias. The built-up class expanded continuously across all intervals, gaining 154.7 km² over thirty years (Table 1). Vegetation suffered the largest absolute decline (76.2 km²), followed by bare soil (45.5 km²). Overall accuracy ranged from 87.5% to 93.5%, and all Kappa values exceeded 0.84, confirming reliable classification [15] . By 2020, built-up surfaces occupied 62.4% of the metropolitan area, leaving less than a fifth under any form of vegetation cover (Figure 1). Agriculture, once present in the southern municipalities, had shrunk to just 4.5% of total area. Expansion rates were highest in Taguig (6.9% per year during 1990-2000), driven by conversion of the former military base and adjacent fishpond areas to commercial and residential use. Manila, already densely built, showed nearzero expansion in the most recent decade (Table 2). The heatmap (Figure 2) illustrates a clear gradient: peripheral municipalities experienced rapid growth in the 1990s that gradually tapered, while core cities showed minimal change throughout. This concentric pattern reflects outward sprawl as central land became saturated.
| Municipality | 1990-2000 | 2000-2010 | 2010-2020 |
|---|---|---|---|
| Taguig | 6.9 | 5.7 | 3.6 |
| Muntinlupa | 5.6 | 4.8 | 3.1 |
| Pasig | 5.1 | 4.3 | 2.8 |
| Makati | 4.7 | 3.2 | 1.9 |
| Quezon City | 3.8 | 2.1 | 1.4 |
| Manila | 1.2 | 0.6 | 0.3 |
Table text extracted from the original PDF; superscript letters are shown inline. The original table image is below.
View original table image
| Class | 1990 | 2000 | 2010 | 2020 | OA (%) | Kappa | Change |
|---|---|---|---|---|---|---|---|
| Built-up | 241.6 | 298.7 | 347.2 | 396.3 | 90.5 | 0.87 | +154.7 |
| Vegetation | 194.3 | 163.8 | 139.4 | 118.1 | 89.0 | 0.85 | -76.2 |
| Water | 57.2 | 55.9 | 54.3 | 52.8 | 93.5 | 0.91 | -4.4 |
| Bare Soil | 84.1 | 68.4 | 51.7 | 38.6 | 88.0 | 0.84 | -45.5 |
| Agriculture | 58.8 | 49.2 | 43.4 | 30.2 | 87.5 | 0.84 | -28.6 |
Table text extracted from the original PDF; superscript letters are shown inline. The original table image is below.
View original table image
Results
Results
Comprehensive Interpretation
The three-decade trajectory reveals two distinct phases. The first (1990-2005) was marked by aggressive horizontal expansion, particularly where government infrastructure projectsthe C-5 road extension, Skyway Stage 1opened suburban land to development. The second phase (2005-2020) shifted toward densification and vertical growth within existing built-up zones, as available greenfield sites diminished. Vegetation loss tracked closely with built-up gains (Pearson r = -0.93), confirming direct conversion rather than intermediate land uses [16] .
Discussion
The overall trajectory matches broader patterns observed in Southeast Asian mega-cities. Bangkok's built-up area doubled between 1988 and 2018 at a comparable rate [17] , and Jakarta's impervious surface share reached 58% by 2015 [18] . What sets Metro Manila apart is the speed of saturation: the core municipalities approached 95% impervious cover by 2010, leaving virtually no land for in-fill development and pushing growth to the periphery. The declining expansion rates in recent decades shouldn't be read as slowing urbanisation. Instead, they reflect a spatial reallocationvertical densification replacing horizontal spread. Building permit data from the Housing and Land Use Regulatory Board support this interpretation, showing a threefold increase in high-rise permits between 2010 and 2019. The environmental consequences of this pattern include reduced groundwater recharge area, heightened urban heat, and amplified flood peaks along the Pasig and Marikina rivers [19] . Classification accuracy was robust, but mixed pixels at the urban-rural fringe inevitably introduced some misclassification between built-up and bare soil. The use of spectral indices (NDBI, NDVI) as auxiliary features helped reduce this confusion. Future work could improve temporal resolution by incorporating Sentinel-2 data at 10 m pixel size, particularly for the post-2015 period. A limitation of this research is the reliance on dry-season imagery, which may underestimate vegetation cover during the monsoon months.
Conclusion
This research mapped urban built-up expansion across Metro Manila from 1990 to 2020 using multi-temporal Landsat data and supervised classification. Built-up area grew from 241.6 km² to 396.3 km², a net increase of 64% over thirty years. The fastest growth occurred in southern and eastern municipalities during the 1990s, while the urban core was already near saturation by the end of that decade. Vegetation cover fell by 39.2%, with the sharpest losses along major highway corridors. The results provide a spatially disaggregated baseline that can inform zoning revisions, green corridor planning, and flood mitigation strategies. Annual expansion rates declined over time, but this masks a transition from horizontal sprawl to vertical densification that carries its own set of infrastructure and environmental challenges. Extending this analysis with higher-resolution sensors and integrating socioeconomic drivers into a predictive model would strengthen the planning utility of the dataset.
References
19 in the original paper- Philippine Statistics Authority. Census of Population 2020: National Capital Region. Manila: PSA. 2021;112 pp.
- Angel S, Parent J, Civco DL. The dimensions of global urban expansion. Progress in Planning. 2011;75(2):53107.
- Weng Q. Remote sensing of impervious surfaces in the urban areas. Remote Sensing of Environment. 2012;117:34-49.
- Zhu Z, Woodcock CE. Continuous change detection and classification of land cover using all available Landsat data. Remote Sensing of Environment. 2014;144:152-171.
- Schneider A, Friedl MA, Potere D. Mapping global urban areas using MODIS 500-m data. Remote Sensing of Environment. 2010;114(8):1733-1746.
- Deng C, Wu C. BCI: A biophysical composition index for remote sensing of urban environments. Remote Sensing of Environment. 2012;127:247-259.
- Roa EC, Santos JC. Spatio-temporal analysis of impervious surface growth in Quezon City. Philippine Journal of Science. 2017;146(2):183-194.
- Castillo RM, Diaz LR. Urban heat island mapping in Metro Manila using Landsat 8 thermal data. Journal of Urban and Environmental Engineering. 2019;13(1):4556.
- Taubenböck H, Esch T, Felbier A. Monitoring urbanization in mega cities from space. Remote Sensing of Environment. 2012;117:162-176.
- Seto KC, Fragkias M, Güneralp B. A meta-analysis of global urban land expansion. PLoS ONE. 2011;6(8):e23777.
- Lagmay AMF, Agaton RP, Bahala MAC. Devastating storm surges of Typhoon Haiyan. International Journal of Disaster Risk Reduction. 2015;11:1-12.
- Anderson JR, Hardy EE, Roach JT. A land use and land cover classification system for use with remote sensor data. US Geological Survey Professional Paper. 1976;964:28 pp.
- Congalton RG, Green K. Assessing the Accuracy of Remotely Sensed Data. CRC Press, Boca Raton. 2009;183 pp.
- Chen J, Zhu X, Vogelmann JE. A simple and effective method for filling gaps in Landsat ETM+ SLC-off images. Remote Sensing of Environment. 2011;115(4):1053-1064.
- Foody GM. Status of land cover classification accuracy assessment. Remote Sensing of Environment. 2002;80(1):185-201.
- Grimm NB, Faeth SH, Golubiewski NE. Global change and the ecology of cities. Science. 2008;319(5864):756760.
- Muttitanon W, Tripathi NK. Land use/land cover changes in the coastal zone of Ban Don Bay, Thailand using Landsat 5 TM data. International Journal of Remote Sensing. 2005;26(11):2311-2323.
- Rustiadi E, Panuju DR, Hadi P. Spatial pattern of impervious surface in Greater Jakarta. Indonesian Journal of Geography. 2018;50(1):47-55.
- Zoleta-Nantes DB. Flood hazards in Metro Manila: recognizing commonalities, differences, and courses of action. Social Science Diliman. 2002;3(1-2):60-105.