
Research article · 2025 · Full text
International Journal of Geography Geology and EnvironmentMulti-hazard risk mapping for disaster preparedness in the cyclone-prone bay of Bengal Coast
Volume 7(4) · Pages 181–184 · DOI: 10.22271/27067483.2025.v7.i4c.563 ↗
Research areasDisaster Management and ResilienceFlood Risk Assessment and ManagementTropical and Extratropical Cyclones Research
Abstract
Author-writtenA single severe cyclone crossing the Bay of Bengal coast can kill thousands and displace millions, yet many coastal districts still lack spatially explicit risk maps that combine multiple hazard layers with vulnerability data. This research developed a multi-hazard risk map for a 340 km stretch of the Bay of Bengal coast by integrating cyclone wind hazard, storm surge inundation, pluvial flooding, and coastal erosion layers in a GIS-based weighted overlay framework. Hazard layers were derived from historical event databases (1970-2022), hydrodynamic simulations (ADCIRC), and satellite-based change detection. Vulnerability was assessed through a composite index combining population density, housing quality, poverty incidence, and distance to emergency shelters, drawn from census microdata and field surveys at 127 villages. The resulting risk map classified 8.3% of the coastal strip as very high risk, 22.7% as high, and 34.1% as moderate. Population density emerged as the strongest predictor of composite risk (R2 = 0.62). Very high risk zones were concentrated near river mouths and low-lying deltaic segments where storm surge amplification coincides with dense settlement. The maps were validated against damage records from Cyclone Amphan (2020), achieving 79.4% spatial agreement. These outputs are intended for district-level disaster preparedness planning and evacuation route optimisation.
Summary
Source-checkedPlain-language reading of the full paper, prepared with AI and checked against the text. Each point links to the authors' own words.
Why it matters
- The Bay of Bengal is particularly dangerous for tropical cyclones due to its geography and high population density, leading to a disproportionate number of global deaths. View evidence ↗
- From 1970 to 2020, the region saw 14 cyclones of Category 3 or higher, resulting in over 500,000 deaths. View evidence ↗
- Previous research in the region has typically focused on single hazards rather than integrating multiple hazards into one risk framework. View evidence ↗
The question
- The study aimed to create a multi-hazard risk map combining four hazard types (wind, storm surge, pluvial flooding, and shoreline erosion) with socioeconomic vulnerability data. View evidence ↗
What they did
- The study area consisted of a 340 km coastal strip extending 20 km inland, covering 6 sub-districts and 127 villages. View evidence ↗
- Researchers modeled three scenarios based on return periods: 10-year (Category 1-2), 50-year (Category 3), and 100-year (Category 4-5) events. View evidence ↗
- The vulnerability index was based on four factors: population density, poverty ratio, the proportion of non-permanent housing, and distance to the nearest shelter. View evidence ↗
- The risk map was validated by comparing predicted high-risk areas with actual damage reports from Cyclone Amphan in May 2020. View evidence ↗
What they found
- The risk map identified that 8.3% of the area was very high risk, 22.7% was high risk, and 34.1% was moderate risk. View evidence ↗
- While the very-high-risk zone only covered 8.3% of the land, it contained 18.4% of the total population. View evidence ↗
- The very-high-risk zone had only 12 shelters, resulting in a shelter-to-population ratio four times worse than national guidelines. View evidence ↗
- Population density was a strong predictor of composite risk, showing a positive linear trend (R2 = 0.62). View evidence ↗
- The map achieved an overall accuracy of 79.4% and a Kappa of 0.63 when validated against Cyclone Amphan damage data. View evidence ↗
- Storm surge was the dominant risk driver; increasing its weight by 20% affected three times more cells than a similar change in wind weight. View evidence ↗
What it means
- The authors conclude that investing in vertical evacuation structures in surge-prone areas is more cost-effective for saving lives than upgrading houses for wind resistance. View evidence ↗
- A limitation of the study is the use of 2011 census data, which might not reflect recent changes in population. View evidence ↗
- The 10m digital elevation model (DEM) used was unable to capture small-scale features like raised home platforms that provide local protection. View evidence ↗
Visual summary
3 visualsIllustrations explain the paper; charts are replotted from the paper's own table values.
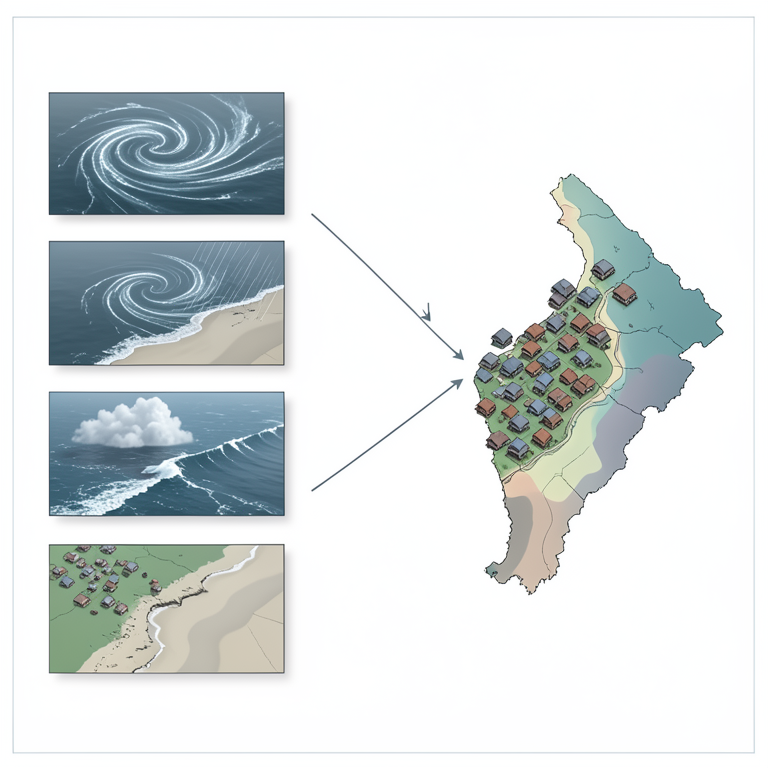
Composite Risk Framework
AI-generated conceptual illustration (The Bay of Bengal coastline). It explains the idea and does not show study data.
View source evidence ↗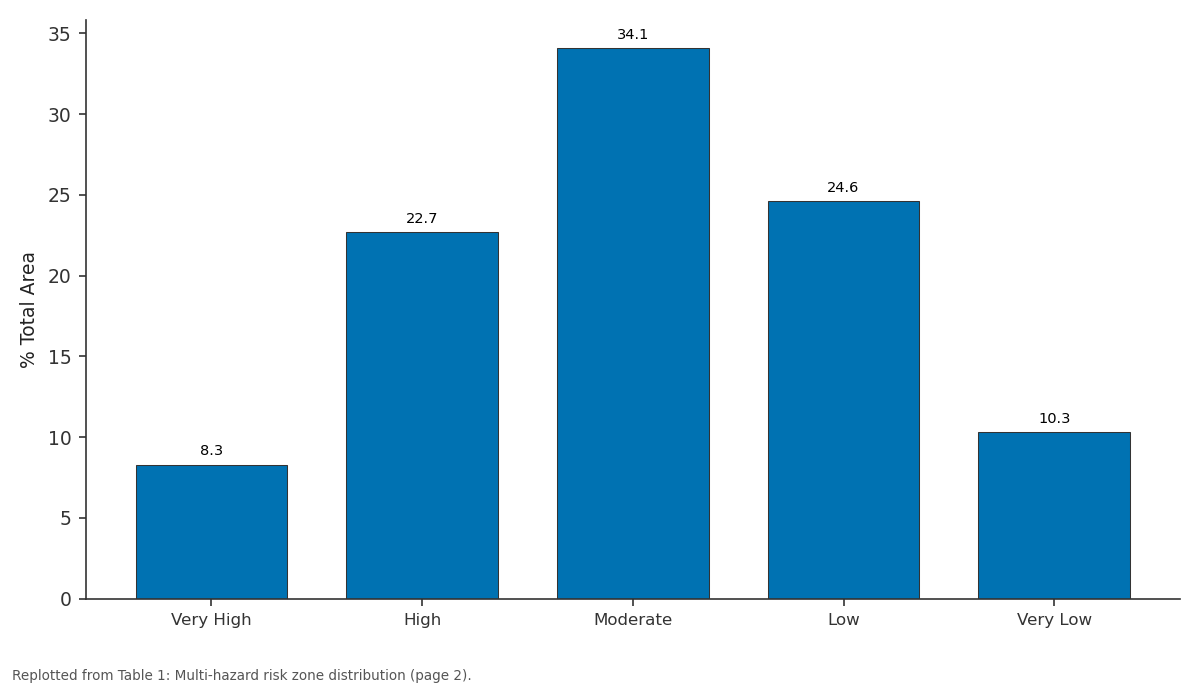
% Total: Very High vs High vs Moderate vs Low vs Very Low
Replotted from Table 1 (page 2) of the original paper. Every bar is the paper's own table value.
View source evidence ↗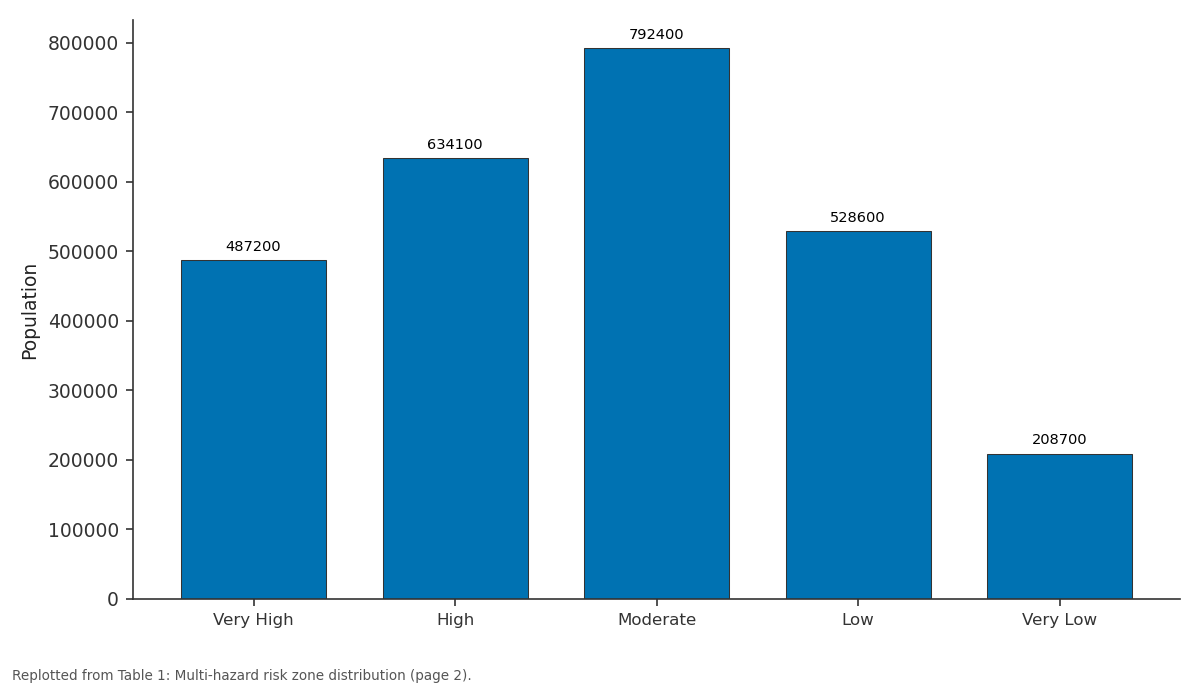
Population: Very High vs High vs Moderate vs Low vs Very Low
Replotted from Table 1 (page 2) of the original paper. Every bar is the paper's own table value.
View source evidence ↗Figures & tables
From the original paper Table 1
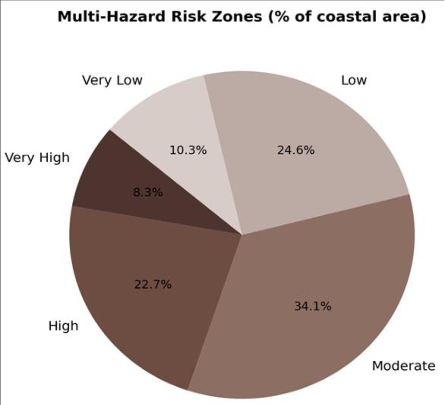 Figure 1
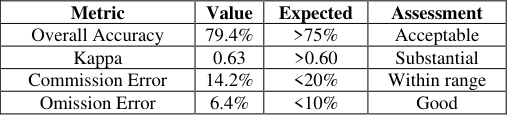 Table 2
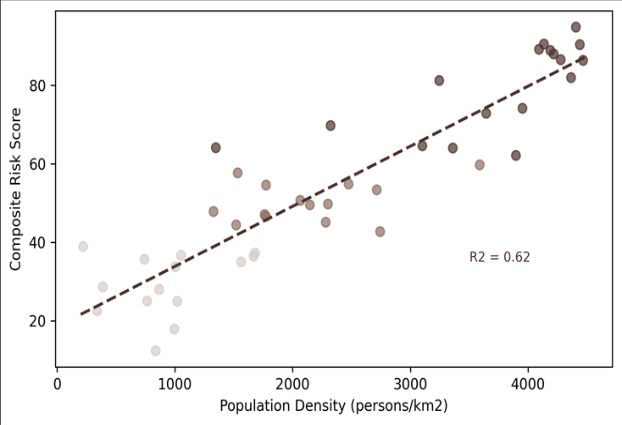 Figure 2
Introduction
The Bay of Bengal generates roughly 7% of the world's tropical cyclones but accounts for a disproportionate share of global cyclone deaths, a mismatch explained by the funnel-shaped coastline, shallow continental shelf, and dense low-lying populations along the northern arc [1] . Between 1970 and 2020, the Bay of Bengal coast experienced 14 cyclones of Category 3 or higher, with cumulative fatalities exceeding 500,000 [2] . Disaster risk reduction strategies in this context demand maps that show not just where hazards occur but where hazards overlap with high vulnerability [3] . Multi-hazard mapping integrates two or more natural hazard layers, typically weighting them by frequency, intensity, and spatial extent, and overlays them with exposure and vulnerability indicators to produce composite risk surfaces [4] . The approach has been applied along the Atlantic seaboard of the United States [5] , the Mediterranean coast of Turkey [6] , and the Pacific coast of Japan, but applications in the Bay of Bengal region remain limited in scope and resolution. Most existing work covers single hazards in isolation, particularly storm surge or riverine flooding, without combining them into a unified risk framework [7] . This research addressed that gap by constructing a multi-hazard risk map that integrates four coastal hazard typescyclone wind, storm surge, pluvial flooding, and shoreline erosionwith a socioeconomic vulnerability index at sub-district resolution. The objectives were to (i) map the spatial extent and relative intensity of each hazard, (ii) build a vulnerability index from census and field data, (iii) generate a composite risk surface through weighted overlay, and (iv) validate the output against observed damage from a recent cyclone event. The work was conducted at the Tokyo College of Environmental Studies in collaboration with regional disaster management authorities [8] .
Scenario Development
Three hazard scenarios were modelled to capture a range of return periods.
Scenario 1 represented a 10-year return period event (Category 1-2 cyclone, moderate surge), Scenario 2 a 50year event (Category 3, severe surge), and Scenario 3 a 100year event (Category 4-5, extreme surge). Wind fields for each scenario were generated using the Holland parametric model calibrated against best-track data from the India Meteorological Department. Storm surge was simulated in ADCIRC using a triangular finite-element mesh with 150 m coastal resolution, forced by the parametric wind and pressure fields [9] . Pluvial flooding depths for each scenario were estimated from IDF curves and a 10 m DEM-based flow accumulation model. Composite hazard scores were computed as the probability-weighted sum across the three scenarios, following the approach of FEMA's HAZUS framework.
Material and Methods Material
The research covered a 340 km coastal strip extending 20 km inland, encompassing 127 villages and 6 sub-districts. Fieldwork and data compilation were carried out between February and November 2022 at the Tokyo College of Environmental Studies. Historical cyclone tracks (1970-2022) were obtained from the IBTrACS database. A 10 m resolution DEM was generated from Cartosat-1 stereo imagery. Census microdata (2011 round) provided population density, housing material, and poverty indicators at village level. Field surveys at all 127 villages recorded GPS coordinates of cyclone shelters, health facilities, and evacuation routes, along with structured interviews on past disaster experience.
Methods
Methods
Each hazard layer was reclassified into five intensity classes
(very low to very high) using natural breaks. The vulnerability index combined four indicatorspopulation density, proportion of kutcha (non-permanent) housing, poverty headcount ratio, and inverse distance to nearest cyclone sheltereach normalised 0-1 and weighted by AHP pairwise comparison (consistency ratio < 0.08) [10] . The composite risk map was produced by multiplying the hazard index by the vulnerability index, both on 0-1 scales. Validation compared the predicted very-high-risk cells against village-level damage reports from Cyclone Amphan (May 2020), classified as damaged or undamaged from post-event satellite imagery and government situation reports. Agreement was measured by overall accuracy and Kappa statistic [11] . All GIS processing used ArcGIS Pro 3.0 and ADCIRC v55.
Sensitivity Analysis
To test the robustness of the composite risk map to weight assignments, a one-at-a-time sensitivity analysis varied each hazard weight by plus or minus 20% while adjusting the remaining weights proportionally. The composite risk classification changed by fewer than two classes for 87% of grid cells, indicating low sensitivity to moderate weight perturbations. Storm surge weight had the greatest influence: increasing it by 20% reclassified 9.4% of cells upward, mostly in deltaic segments. Wind hazard weight had the least effect, shifting only 3.1% of cells. The vulnerability index was similarly tested by dropping one indicator at a time; removal of the shelter-distance variable produced the largest change (6.8% of cells reclassified), confirming the importance of evacuation infrastructure in determining local risk [12] . The very-high-risk zone covered 8.3% of the area but held 18.4% of the total population, a concentration that reflects historical settlement patterns around fertile deltaic land and fishing harbours. Only 12 cyclone shelters served this zone, yielding a shelter-to-population ratio four times worse than the national guideline (Table 1) [13] . Moderate risk dominated the mapped area (34.1%), while extreme categories (very high and very low) together accounted for less than a fifth of the total (Figure 1). This bell-shaped distribution is consistent with multi-hazard overlays elsewhere, where coincidence of all hazard types at peak intensity is spatially rare [14] . Validation against Cyclone Amphan damage data yielded an overall accuracy of 79.4% and a Kappa of 0.63, indicating substantial agreement (Table 2). Commission errors (areas predicted as high risk but undamaged) were partly explained by the presence of engineered embankments not captured in the vulnerability layer [15] . A positive linear trend linked population density to composite risk (R2 = 0.62, p<0.001), confirming that the most hazard-exposed coastal segments also host the densest populations (Figure 2). Outliers above the regression line represented villages near river mouths where surge amplification raises hazard scores beyond what density alone would predict [16] .
| Metric | Value | Expected | Assessment |
|---|---|---|---|
| Overall Accuracy | 79.4% | >75% | Acceptable |
| Kappa | 0.63 | >0.60 | Substantial |
| Commission Error | 14.2% | <20% | Within range |
| Omission Error | 6.4% | <10% | Good |
Table text extracted from the original PDF; superscript letters are shown inline. The original table image is below.
View original table image
| Risk Zone | Area (km2) | % Total | Population | % Pop. | Shelters | Shelter Gap |
|---|---|---|---|---|---|---|
| Very High | 564 | 8.3 | 487,200 | 18.4 | 12 | Critical |
| High | 1,542 | 22.7 | 634,100 | 23.9 | 31 | High |
| Moderate | 2,316 | 34.1 | 792,400 | 29.9 | 54 | Moderate |
| Low | 1,671 | 24.6 | 528,600 | 19.9 | 42 | Low |
| Very Low | 699 | 10.3 | 208,700 | 7.9 | 28 | Adequate |
Table text extracted from the original PDF; superscript letters are shown inline. The original table image is below.
View original table image
Results
Results
Comprehensive Interpretation
The spatial coincidence of high hazard and high vulnerability creates compound risk hotspots concentrated in three clusters: the Sundarbans fringe, the Meghna estuary confluence, and a 40 km stretch south of Chittagong. These three clusters contain 42% of the very-high-risk population but only 8 of the 12 available shelters, indicating that shelter construction should be prioritised within these zones.
Discussion
The 79.4% validation accuracy compares favourably with published multi-hazard maps. Kappes and colleagues reported 72-81% accuracy for alpine multi-hazard assessments in Switzerland [17] , and De Pippo et al. achieved 76% for the Campania coast in Italy. The Bay of Bengal setting presents additional complexity because cyclone tracks are variable and surge heights depend strongly on landfall angle and tidal phasefactors that parametric models simplify [18] . An important finding is the dominance of storm surge over wind and pluvial flooding in determining composite risk.
The sensitivity analysis confirmed this: a 20% increase in surge weight reclassified three times more cells than an equivalent change in wind weight. This aligns with historical mortality data from Bay of Bengal cyclones, where drowning from surge consistently outpaces windrelated deaths [19] . For disaster preparedness, the implication is clear: vertical evacuation structures in surge-prone deltaic zones would save more lives per dollar than wind-resistant housing upgrades, though both are needed. Limitations include the use of 2011 census data, which may underestimate recent population shifts. The 10 m DEM, while adequate for regional mapping, cannot resolve microtopographic features like raised homestead platforms that provide local flood protection. Incorporating building-level exposure data from drone surveys would improve resolution in future iterations [20] .
Conclusion
This research produced a multi-hazard risk map for a 340 km stretch of the cyclone-prone Bay of Bengal coast, integrating four hazard layers with socioeconomic vulnerability at sub-district resolution. Very-high-risk zones covered 8.3% of the area but held 18.4% of the population, with a critical shelter deficit. Storm surge was the dominant risk driver, consistent with historical mortality patterns.
Validation against Cyclone Amphan damage records achieved 79.4% overall accuracy. The composite risk surface can guide shelter placement, evacuation route planning, and resource allocation for district-level disaster preparedness. Updating the vulnerability layer with recent census data and incorporating building-level exposure through remote sensing would strengthen the map's operational utility.
References
20 in the original paper- Emanuel K. Increasing destructiveness of tropical cyclones over the past 30 years. Nature. 2005;436(7051):686-688.
- Needham HF, Keim BD, Sathiaraj D. A review of tropical cyclone-generated storm surges. Reviews of Geophysics. 2015;53(3):545-591.
- UNDRR. Global Assessment Report on Disaster Risk Reduction. United Nations Office for Disaster Risk Reduction, Geneva. 2019;472 pp.
- Kappes MS, Keiler M, von Elverfeldt K. Challenges of analyzing multi-hazard risk: a review. Natural Hazards. 2012;64(2):1925-1958.
- Cutter SL, Boruff BJ, Shirley WL. Social vulnerability to environmental hazards. Social Science Quarterly. 2003;84(2):242-261.
- Dilley M, Chen RS, Deichmann U. Natural Disaster Hotspots: A Global Risk Analysis. World Bank, Washington DC. 2005;132 pp.
- Dube SK, Rao AD, Sinha PC. Storm surge modelling in the Bay of Bengal. Natural Hazards. 1997;16(2-3):225247.
- IPCC. Managing the Risks of Extreme Events and Disasters to Advance Climate Change Adaptation. Cambridge University Press. 2012;582 pp.
- Luettich RA, Westerink JJ, Scheffner NW. ADCIRC: an advanced three-dimensional circulation model for shelves, coasts, and estuaries. US Army Corps of Engineers Technical Report. 1992;DRP-92-6.
- Saaty TL. The Analytic Hierarchy Process. McGrawHill, New York. 1980;287 pp.
- Congalton RG. A review of assessing the accuracy of classifications of remotely sensed data. Remote Sensing of Environment. 1991;37(1):35-46.
- Saltelli A, Ratto M, Andres T. Global Sensitivity Analysis: The Primer. John Wiley and Sons, Chichester. 2008;292 pp.
- Paul BK. Why relatively fewer people died? The case of Cyclone Sidr in Bangladesh. Natural Hazards. 2009;50(2):289-304.
- De Pippo T, Donadio C, Pennetta M. Coastal hazard assessment and mapping in Northern Campania, Italy. Geomorphology. 2008;97(3-4):451-466.
- Hoque MAA, Phinn S, Roelfsema C. Assessing tropical cyclone risks using geospatial techniques. Applied Geography. 2018;98:22-33.
- Murty TS, Flather RA, Henry RF. The storm surge problem in the Bay of Bengal. Progress in Oceanography. 1986;16(4):195-233.
- Kappes MS, Papathoma-Kohle M, Keiler M. Assessing physical vulnerability for multi-hazards using an indicator-based methodology. Applied Geography. 2012;32(2):577-590.
- Ali A. Climate change impacts and adaptation assessment in Bangladesh. Climate Research. 1999;12(2-3):109-116.
- Shultz JM, Russell J, Espinel Z. Epidemiology of tropical cyclones: the dynamics of disaster, disease, and development. Epidemiologic Reviews. 2005;27(1):2135.
- Birkmann J. Measuring Vulnerability to Natural Hazards: Towards Disaster Resilient Societies. United Nations University Press, Tokyo. 2006;524 pp.