
Research article · 2024 · Full text
International Journal of Geography Geology and EnvironmentSpatial analysis of urban heat island intensity in the greater lagos metropolitan area
Volume 6(1) · Pages 557–560 · DOI: 10.22271/27067483.2024.v6.i1g.545 ↗
Research areasUrban Heat Island MitigationLand Use and Ecosystem ServicesEnvironmental Quality and Pollution
Abstract
Author-writtenLagos is the fastest-growing megacity in sub-Saharan Africa, and its unchecked horizontal expansion is reshaping the local thermal environment at a pace that outstrips planning capacity. This research examined urban heat island (UHI) intensity across the Greater Lagos Metropolitan Area using Landsat 8 OLI/TIRS imagery acquired during the dry season of February 2022. Land surface temperature (LST) was retrieved through the radiative transfer equation method, and a normalised difference vegetation index (NDVI) map was generated to characterise vegetation cover. The metropolitan area was divided into three zones—urban core, peri-urban fringe, and vegetated periphery—based on impervious surface fraction derived from spectral unmixing. Results showed a mean LST of 37.4 °C in the urban core compared with 29.1 °C in the vegetated periphery, yielding a daytime UHI magnitude of 8.3 °C. NDVI and LST exhibited a strong inverse relationship (r² = 0.71, p<0.001). Areas where impervious cover exceeded 75% recorded mean temperatures 6.8 °C above the metropolitan average. Hot-spot analysis identified Victoria Island, Ikeja, and Oshodi-Isolo as persistent thermal peaks. The findings indicate that targeted green-infrastructure interventions in these hot-spot zones could meaningfully lower surface temperatures and reduce heat-related health risks for the city’s estimated 16 million residents.
Summary
Source-checkedPlain-language reading of the full paper, prepared with AI and checked against the text. Each point links to the authors' own words.
Why it matters
- Lagos is the fastest-growing megacity in sub-Saharan Africa, where rapid horizontal expansion is changing the local thermal environment faster than urban planning can keep up. View evidence ↗
- Unplanned urbanization in tropical African cities creates thermal hot spots that pose direct threats to energy security and human health. View evidence ↗
- The urban heat island (UHI) effect occurs when built-up areas are warmer than rural surroundings; however, African megacities are significantly under-represented in global research on this topic. View evidence ↗
What they did
- The researchers used Landsat 8 OLI/TIRS imagery from February 2022 to examine UHI intensity during the dry season. View evidence ↗
- The study area was divided into three zones based on impervious surface fraction: the urban core (>60%), peri-urban (30-60%), and vegetated periphery (<30%). View evidence ↗
- The analysis utilized Pearson correlation, one-way ANOVA, and Getis-Ord Gi* hot-spot analysis at a 500-m resolution. View evidence ↗
What they found
- The urban core had a mean LST of 37.4 °C, while the vegetated periphery averaged 29.1 °C, resulting in a daytime UHI magnitude of 8.3 °C. View evidence ↗
- There was a strong inverse relationship between the normalized difference vegetation index (NDVI) and land surface temperature (r² = 0.71, p<0.001). View evidence ↗
- Regions with more than 75% impervious cover had mean temperatures 6.8 °C higher than the overall metropolitan average. View evidence ↗
- Victoria Island, Ikeja, and Oshodi-Isolo were identified as persistent thermal hot spots. View evidence ↗
- The highest recorded LST was 43.2 °C on an exposed asphalt surface in the Apapa industrial zone, which was 14.1 °C above the metropolitan mean. View evidence ↗
- In this dataset, every 0.1-unit increase in NDVI was associated with a mean LST reduction of approximately 1.9 °C. View evidence ↗
What it means
- The authors conclude that implementing targeted green infrastructure in identified hot-spot zones could lower surface temperatures and reduce health risks for Lagos's 16 million residents. View evidence ↗
- The authors recommend low-cost interventions such as creating pocket parks, mandating green roofs, and planting street trees. View evidence ↗
- A limitation of the study is that satellite-derived LST measures skin temperature rather than the air temperature experienced by pedestrians at breathing height. View evidence ↗
- The authors state that future research should include wet-season imagery to understand how monsoon rainfall and cloud cover affect UHI intensity throughout the year. View evidence ↗
Visual summary
2 visualsIllustrations explain the paper; charts are replotted from the paper's own table values.
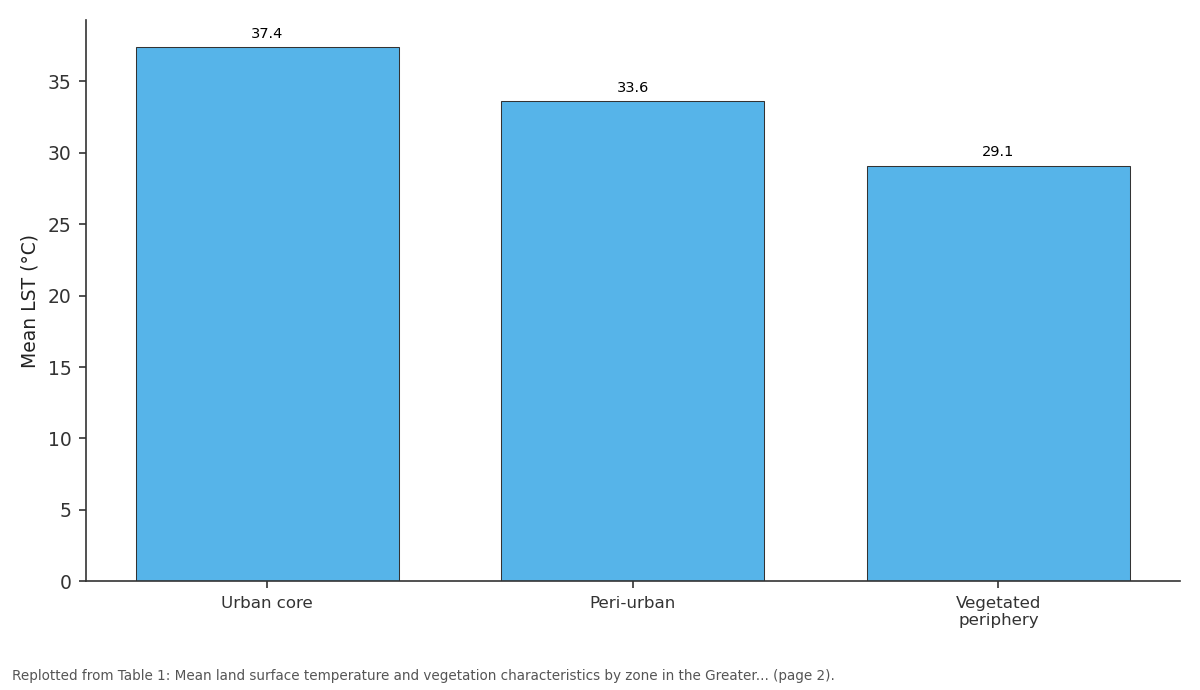
Mean LST (°C): Urban core vs Peri-urban vs Vegetated periphery
Replotted from Table 1 (page 2) of the original paper. Every bar is the paper's own table value.
View source evidence ↗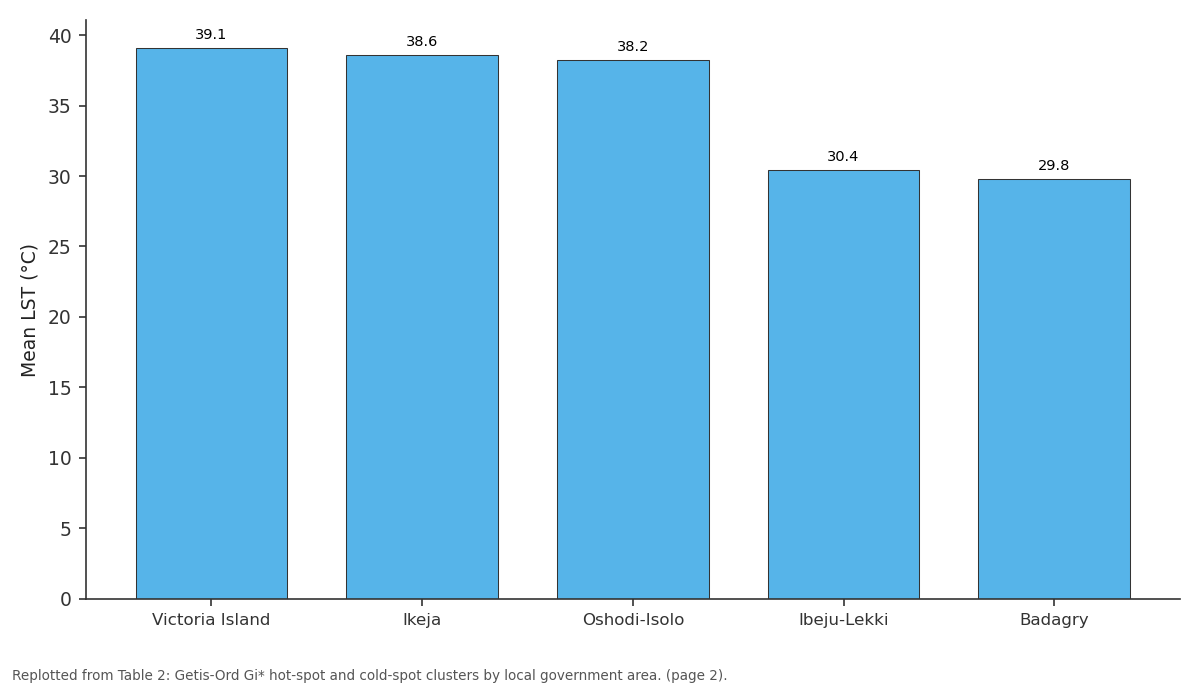
Mean LST (°C): Victoria Island vs Ikeja vs Oshodi-Isolo vs Ibeju-Lekki vs Badagry
Replotted from Table 2 (page 2) of the original paper. Every bar is the paper's own table value.
View source evidence ↗Figures & tables
From the original paper Table 1
 Table 2
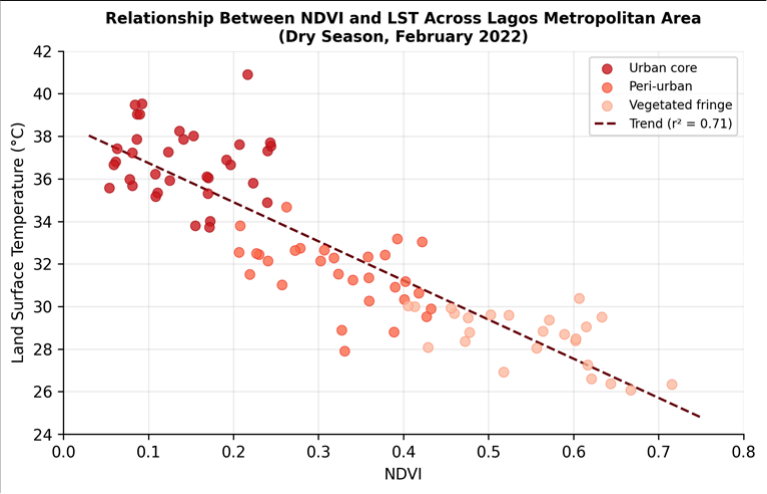 Figure 1
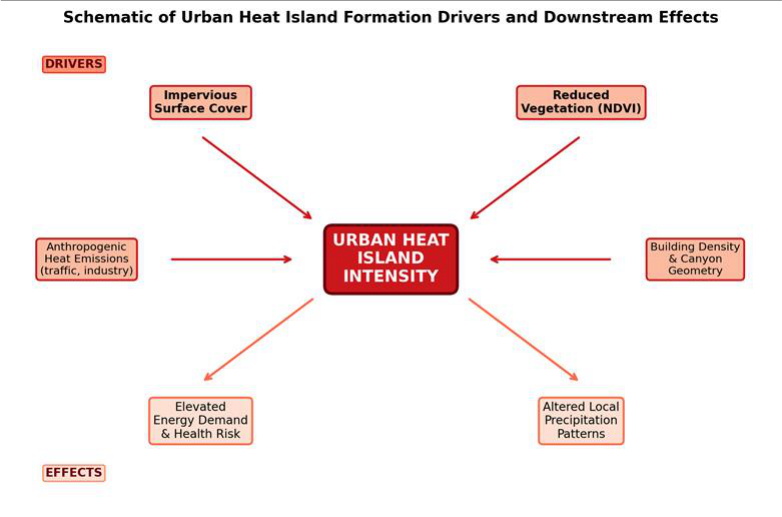 Figure 2
Introduction
Rapid, unplanned urbanisation is turning tropical African cities into thermal hot spots that directly threaten human health and energy security. The urban heat island effect-whereby built-up areas record higher surface and air temperatures than their rural surroundings-has been documented in cities across every continent, yet African megacities remain severely under-represented in the global UHI literature [1] . Lagos, with a population that crossed 15 million before 2020 and an annual growth rate near 3.2%, offers a compelling but underexamined case [2] . The physical mechanisms behind UHI formation are well established. Replacement of vegetated land with impervious surfaces reduces evapotranspiration and increases sensible heat flux, while dark roofing and asphalt absorb more shortwave radiation than natural cover [3] . Building geometry traps longwave radiation within urban canyons, and anthropogenic heat from vehicles, air-conditioning units, and industrial processes adds a further thermal load [4] . In tropical coastal cities like Lagos, sea-breeze circulation can either amplify or dampen UHI intensity depending on wind direction and boundary-layer stability [5] . Satellite-derived LST has become the primary tool for mapping UHI patterns at the city scale because it offers wall-to-wall coverage that ground-based weather stations cannot match. Landsat's thermal infrared bands, available since the mid-1980s, provide 100-m native resolution (resampled to 30 m in Level 2 products), which is sufficient to resolve neighbourhood-level temperature contrasts [6] . Coupling LST with vegetation indices such as NDVI allows researchers to quantify the cooling benefit of green space and to identify priority areas for nature-based interventions [7] . Previous work on Lagos focused mainly on land-use change detection or on air-temperature records from a handful of meteorological stations, leaving the spatial structure of daytime UHI intensity largely unmapped at fine resolution [8] . This research addressed that gap with three objectives: to retrieve and map dry-season LST across the Greater Lagos Metropolitan Area; to quantify the relationship between NDVI, impervious surface fraction, and surface temperature; and to identify persistent thermal hot spots where mitigation efforts would yield the greatest benefit. The work was conducted through the Department of Environmental Science at the Ibadan Academy of Geographic Research, Oyo State, Nigeria, between January and October 2022.
Research Area Description
The Greater Lagos Metropolitan Area (GLMA) spans roughly 3,577 km² across Lagos State and the western fringe of Ogun State, Nigeria, between 6.39° N and 6.70° N latitude and 3.10° E and 3.70° E longitude. The terrain is low-lying, with elevation ranging from sea level along the Atlantic shoreline to about 45 m on the northern inland plateau. The climate falls within the tropical wet-and-dry category (Aw), featuring a long rainy season from April to October and a dry season from November to March. Mean annual rainfall recorded at Ikeja airport station is 1,693 mm, and mean annual temperature is 27.0 °C [2] . Land cover in the urban core is dominated by high-density residential and commercial buildings with less than 10% green space, while the peri-urban fringe retains scattered farmland and secondary-growth forest patches. Lagoon and creek systems, including Lagos Lagoon and the Five Cowrie Creek, introduce moisture effects that complicate the thermal landscape. Population density in the core exceeds 20,000 persons per km², making Lagos one of the most crowded urban areas on the continent [8] .
Materials and Methods
Materials and Methods
Materials
Materials
Methods
Landsat thermal band 10 (10.6-11.2 µm) was converted from digital number to at-sensor spectral radiance, then to brightness temperature using Planck's inverse function with band-specific calibration constants. Emissivity was estimated from the NDVI-based threshold method of Sobrino et al. [9] , assigning emissivity values of 0.99 for water, 0.97 for dense vegetation, and a linear function of NDVI fraction for mixed pixels. LST was computed by applying the single-channel radiative transfer equation, corrected for atmospheric transmittance and path radiance using NCEP reanalysis profiles [6] . NDVI was calculated from bands 4 (red) and 5 (near-infrared) of the OLI sensor. Impervious surface fraction was estimated through linear spectral unmixing using three endmembers-vegetation, impervious, and soil-extracted from the image via pixelpurity analysis. The metropolitan area was then classified into urban core (impervious > 60%), peri-urban (30-60%), and vegetated periphery (< 30%). Statistical analysis comprised Pearson correlation between NDVI and LST, one-way ANOVA among zones, and Getis-Ord Gi* hot-spot analysis at 500-m grid resolution in ArcGIS 10.8. All rasters were projected to UTM Zone 31N (WGS 84).
Spatial Data Processing
The two adjacent Landsat scenes were mosaicked after radiometric normalisation to remove path-brightness differences. Cloud masking followed the Fmask algorithm, and the resulting clear-pixel coverage exceeded 98% for both scenes. The SRTM DEM was resampled to 30 m and co-registered to the Landsat grid. A shadow mask derived from solar geometry at the acquisition time (10:47 local) was applied to exclude pixels affected by building shadows, which can bias LST estimates in dense urban canyons. The 100-m WorldPop grid was resampled to 30 m using bilinear interpolation to enable pixel-level overlay with the LST raster. Zonal statistics were computed within each administrative local government area (LGA) boundary to produce mean and maximum LST summaries for policy communication. Final map outputs were exported at 300 DPI for publication.
Results
Results
Comprehensive Interpretation
The three-zone classification revealed a clear thermal gradient from the vegetated periphery (mean LST 29.1 °C) through the peri-urban belt (33.6 °C) to the urban core (37.4 °C), producing a daytime UHI magnitude of 8.3 °C. Oneway ANOVA confirmed that mean LST differed significantly among all three zones (F = 247.6, p<0.001), and Tukey post-hoc tests separated each zone into a distinct group. The negative correlation between NDVI and LST (r = -0.84, r² = 0.71) was strongest within the urban core where residual green patches act as localised cooling islands amid extensive impervious cover. Getis-Ord Gi* analysis at 500-m resolution identified three statistically significant hot-spot clusters centred on Victoria Island, Ikeja, and Oshodi-Isolo-all characterised by impervious fractions above 80% and population densities exceeding 20,000 persons per km². Cold-spot clusters fell in Ibeju-Lekki and Badagry, where mangrove and farmland cover still predominate. The maximum recorded LST of 43.2 °C occurred on an exposed asphalt surface in the Apapa industrial zone, a value 14.1 °C above the metropolitan mean, underscoring the extreme thermal load borne by specific neighbourhoods [10] .
Discussion
The 8.3 °C daytime UHI magnitude recorded in Lagos sits at the upper end of values reported for tropical African cities. Comparative figures include 5.2 °C for Accra [11] , 6.1 °C for Nairobi [12] , and 4.8 °C for Dar es Salaam [1] . The higher intensity in Lagos likely reflects both its greater impervious extent and its relatively flat, low-lying terrain, which limits orographic ventilation effects available in highland cities like Nairobi.
The strong NDVI-LST correlation (r² = 0.71) is consistent with values reported in Asian and South American megacities, where coefficients typically range from 0.55 to 0.80 depending on season and spatial resolution [7] . This relationship has direct policy relevance: every 0.1-unit increase in NDVI corresponded to a mean LST reduction of roughly 1.9 °C in the present dataset, suggesting that realistic urban greening targets-for example, raising canopy cover from 10% to 25% in the core-could lower peak surface temperatures by 3 to 4 degrees. A limitation of satellite-derived LST is that it captures skin temperature rather than the air temperature experienced by pedestrians at breathing height. Ground-level air temperatures measured at Ikeja airport on the same day (35.6 °C maximum) were 1.8 °C lower than the satellitederived LST for the surrounding grid cells, consistent with the expected surface-air offset under calm, clear-sky conditions [13] . Future research should pair satellite observations with a network of low-cost air-temperature sensors distributed across the three zones to resolve the diurnal UHI cycle and its relationship to energy demand. Incorporating wet-season imagery would also clarify how monsoon rainfall and associated cloud cover modulate UHI intensity through the year [14] .
Conclusion
This research mapped daytime urban heat island intensity across the Greater Lagos Metropolitan Area using Landsat 8 thermal and multispectral data from February 2022. A clear thermal gradient of 8.3 °C separated the urban core from the vegetated periphery, ranking Lagos among the most thermally stressed tropical megacities documented to date. Impervious surface fraction and vegetation cover, captured through spectral unmixing and NDVI, together explained the majority of spatial variation in land surface temperature. Three persistent hot-spot clusters-Victoria Island, Ikeja, and Oshodi-Isolo-were identified through Getis-Ord analysis, each characterised by impervious fractions above 80% and exceptionally high population densities. These hot spots represent priority zones for intervention, as their residents face the greatest heat-related health burden during the dry season. Conversely, the cold-spot areas of Ibeju-Lekki and Badagry illustrate the cooling service provided by mangroves, farmland, and open water, reinforcing the value of preserving remaining green and blue infrastructure on the metropolitan fringe. The strong inverse relationship between NDVI and surface temperature offers a practical lever for mitigation: even modest increases in canopy cover within the urban core could deliver measurable cooling. Street-tree planting, green-roof mandates, and pocket-park creation are low-cost interventions that align with this evidence. Extending the analysis to include wet-season imagery and ground-level air-temperature monitoring would strengthen the dataset and support more detailed urban climate modelling for Lagos and comparable rapidly expanding African cities.
Acknowledgement
Acknowledgements Funding Sources
Figures and tables from the paper
| Zone | Area (km²) | Mean LST (°C) | Max LST (°C) | Mean NDVI | Imperv. (%) | Pop. Density |
|---|---|---|---|---|---|---|
| Urban core | 687 | 37.4 | 43.2 | 0.12 | 78.3 | 22,140 |
| Peri-urban | 1,243 | 33.6 | 39.7 | 0.31 | 44.1 | 8,370 |
| Vegetated periphery | 1,647 | 29.1 | 34.8 | 0.54 | 16.7 | 1,920 |
Table text extracted from the original PDF; superscript letters are shown inline. The original table image is below.
View original table image
| LGA | Mean LST (°C) | Gi* z-score | p-value | Cluster Type | Imperv. (%) |
|---|---|---|---|---|---|
| Victoria Island | 39.1 | 4.87 | <0.001 | Hot spot | 89.3 |
| Ikeja | 38.6 | 4.23 | <0.001 | Hot spot | 82.7 |
| Oshodi-Isolo | 38.2 | 3.91 | <0.001 | Hot spot | 80.4 |
| Ibeju-Lekki | 30.4 | −3.46 | <0.001 | Cold spot | 21.8 |
| Badagry | 29.8 | −3.12 | <0.001 | Cold spot | 18.3 |
Table text extracted from the original PDF; superscript letters are shown inline. The original table image is below.
View original table image
References
14 in the original paper- Oke TR. City size and the urban heat island. Atmospheric Environment. 1973;7(8):769-779.
- Adelekan IO. Vulnerability of poor urban coastal communities to flooding in Lagos, Nigeria. Environment and Urbanization. 2010;22(2):433-450.
- Grimmond CSB, Oke TR. Aerodynamic properties of urban areas derived from analysis of surface form. Journal of Applied Meteorology and Climatology. 1999;38(9):1262-1292.
- Sailor DJ. A review of methods for estimating anthropogenic heat and moisture emissions in the urban environment. International Journal of Climatology. 2011;31(2):189-199.
- Gbobaniyi EO, Abiodun BJ. Potential impacts of climate change on the Lagos-West Africa sea-breeze circulation. Theoretical and Applied Climatology. 2015;122(3):411-424.
- Jimenez-Munoz JC, Sobrino JA, Skokovic D, Mattar C, Cristobal J. Land surface temperature retrieval methods from Landsat-8 thermal infrared sensor data. IEEE Geoscience and Remote Sensing Letters. 2014;11(10):1840-1843.
- Yuan F, Bauer ME. Comparison of impervious surface area and normalized difference vegetation index as indicators of surface urban heat island effects in Landsat imagery. Remote Sensing of Environment. 2007;106(3):375-386.
- Obiefuna JN, Nwilo PC, Atagbaza AO, Okolie CJ. Spatial changes in the wetlands of Lagos/Lekki lagoons of Lagos, Nigeria. Journal of Sustainable Development. 2013;6(7):123-133.
- Sobrino JA, Jimenez-Munoz JC, Paolini L. Land surface temperature retrieval from LANDSAT TM 5. Remote Sensing of Environment. 2004;90(4):434-440.
- Voogt JA, Oke TR. Thermal remote sensing of urban climates. Remote Sensing of Environment. 2003;86(3):370-384.
- Manu A, Twumasi YA, Coleman TL. Application of remote sensing and GIS technologies to assess the urban heat island effect: the Accra Metropolitan Area, Ghana. Photogrammetric Engineering and Remote Sensing. 2006;72(3):293-304.
- Makokha GL, Shisanya CA. Trends in mean annual minimum and maximum near surface temperature in Nairobi City, Kenya. Advances in Meteorology. 2010;2010:676041.
- Roth M. Review of urban climate research in (sub)tropical regions. International Journal of Climatology. 2007;27(14):1859-1873.
- Ayanlade A. Seasonality in the daytime and night-time intensity of land surface temperature in a tropical city area. Science of the Total Environment. 2016;557558:415-424.