
Research article · 2025 · Full text
International Journal of Geography Geology and EnvironmentImpact of rapid urbanization on surface water drainage in Greater Jakarta
Volume 7(3) · Pages 55–58 · DOI: 10.22271/27067483.2025.v7.i3a.515 ↗
Research areasUrban Stormwater Management SolutionsFlood Risk Assessment and ManagementUrban Heat Island Mitigation
Abstract
Author-writtenWhat happens to stormwater when a coastal megacity paves over its natural drainage network? This research quantified the relationship between impervious surface expansion and surface-water drainage capacity across eight sub-districts of Greater Jakarta (Jabodetabek) between 2000 and 2022. Landsat time-series imagery was classified to map impervious surface coverage at four time steps, and the Soil Conservation Service Curve Number (SCS-CN) method was applied to estimate runoff coefficients under a 10-year, 6-hour design storm. Mean impervious coverage rose from 43.3% to 67.7% across the study area, with the steepest increase in peri-urban Tangerang (+31.3 percentage points). The corresponding weighted runoff coefficient increased from 0.54 to 0.71, implying a 31.5% rise in peak stormwater volume. A statistically significant positive correlation (r = 0.91, p < 0.001) linked impervious fraction to flood event frequency recorded at 12 river-gauge stations. Central Jakarta, with 89.3% impervious cover, recorded the highest runoff coefficient (0.82) and the most frequent flooding (8.4 events per year). These results highlight the inadequacy of Jakarta's existing canal network—designed for roughly 50% imperviousness—and support the case for green-infrastructure retrofits, particularly bioretention cells and permeable paving, in the most densely built sub-districts.
Summary
Source-checkedPlain-language reading of the full paper, prepared with AI and checked against the text. Each point links to the authors' own words.
Why it matters
- Greater Jakarta is one of Southeast Asia's fastest-growing metropolitan areas, with its population doubling from approximately 17 million in 2000 to over 34 million by 2022. View evidence ↗
- The expansion of impervious surfaces in urban areas prevents water infiltration and increases runoff volume and peak discharge, which can overwhelm drainage systems designed for less urbanized landscapes. View evidence ↗
- Jakarta's drainage capacity has failed to keep pace with urban growth, and land subsidence of up to 10 cm/yr in North Jakarta further reduces the capacity of tidal-affected canals. View evidence ↗
The question
- The study aimed to map impervious surface changes in eight sub-districts from 2000 to 2022, estimate runoff coefficients using the SCS-CN method, and correlate these findings with flood frequency. View evidence ↗
What they did
- Researchers used Landsat imagery from 2000, 2010, 2015, and 2022 to analyze eight sub-districts in the Jabodetabek region. View evidence ↗
- Runoff coefficients were calculated based on a standardized 10-year, 6-hour design storm with a rainfall depth of 80 mm. View evidence ↗
- The SCS-CN model was validated against observed peak discharges, showing an R² of 0.84 and a Nash–Sutcliffe efficiency of 0.79. View evidence ↗
What they found
- The weighted runoff coefficient rose from 0.54 to 0.71, which indicates a 31.5% increase in peak stormwater volume. View evidence ↗
- There is a strong, statistically significant positive correlation (r = 0.91, p < 0.001) between the fraction of impervious surfaces and the frequency of flood events. View evidence ↗
- Central Jakarta had the highest impervious cover (89.3%), the highest runoff coefficient (0.82), and the most frequent flooding at 8.4 events per year. View evidence ↗
- The existing canal system is structurally undersized because it was designed for roughly 50% imperviousness, while five of the eight studied sub-districts now exceed 60% imperviousness. View evidence ↗
What it means
- The authors recommend a combination of immediate structural upgrades (canal rehabilitation and pumps) and long-term green infrastructure (bioretention and permeable surfaces) to improve resilience. View evidence ↗
- A limitation of the study is its reliance on a single design-storm scenario rather than a probabilistic analysis of multiple return periods and climate-change projections. View evidence ↗
- The model systematically underestimated runoff by 8–12% in North Jakarta because it did not account for tidal backwater effects. View evidence ↗
Visual summary
3 visualsIllustrations explain the paper; charts are replotted from the paper's own table values.
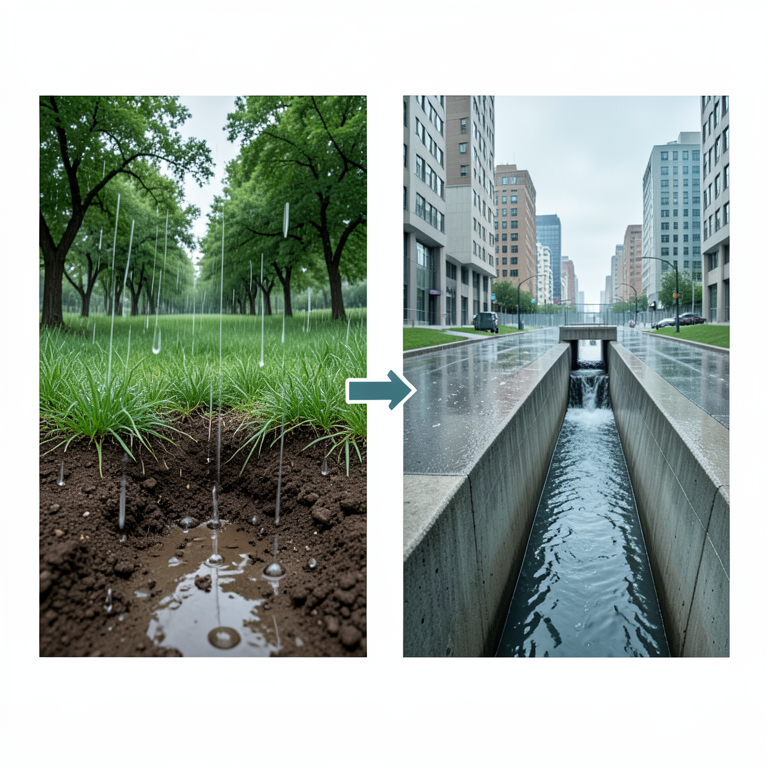
Hydrological Impact of Urbanization
AI-generated conceptual illustration (Greater Jakarta landscape transitioning from natural soil to urban concrete). It explains the idea and does not show study data.
View source evidence ↗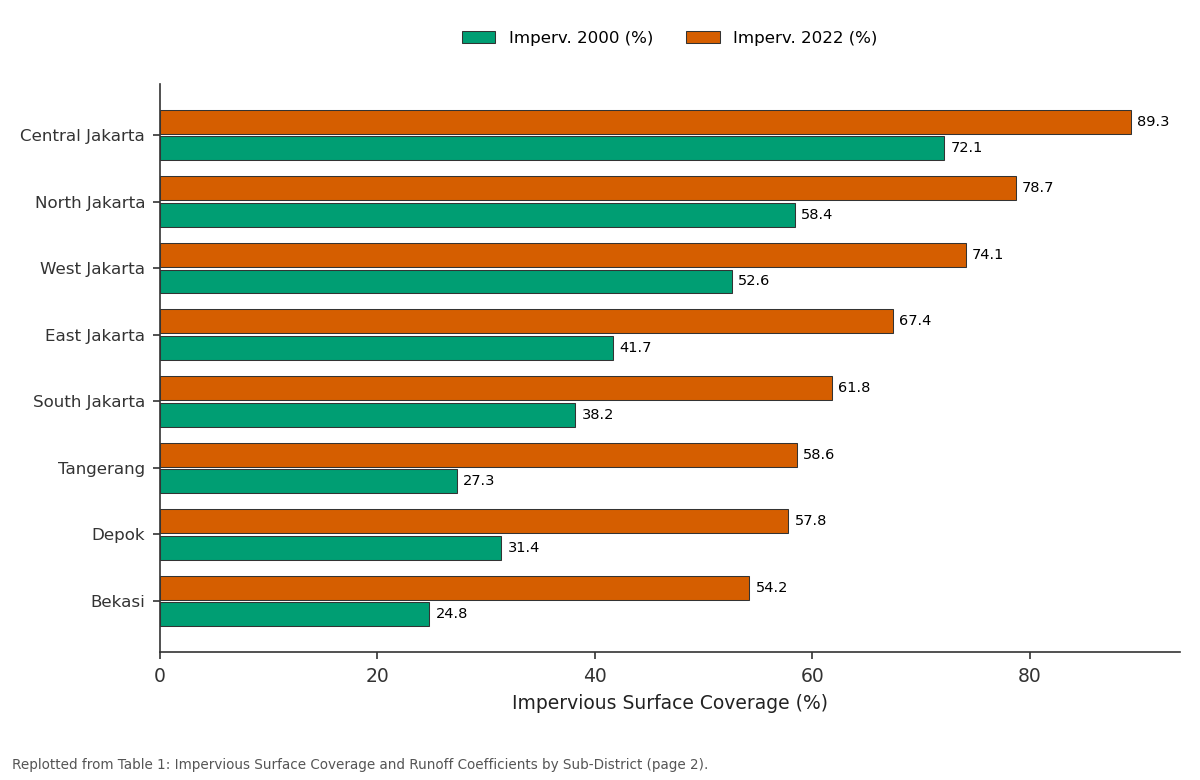
Imperv. 2000 (%) and Imperv. 2022 (%): Central Jakarta vs North Jakarta vs West Jakarta vs East Jakarta vs South Jakarta
Replotted from Table 1 (page 2) of the original paper. Every bar is the paper's own table value.
View source evidence ↗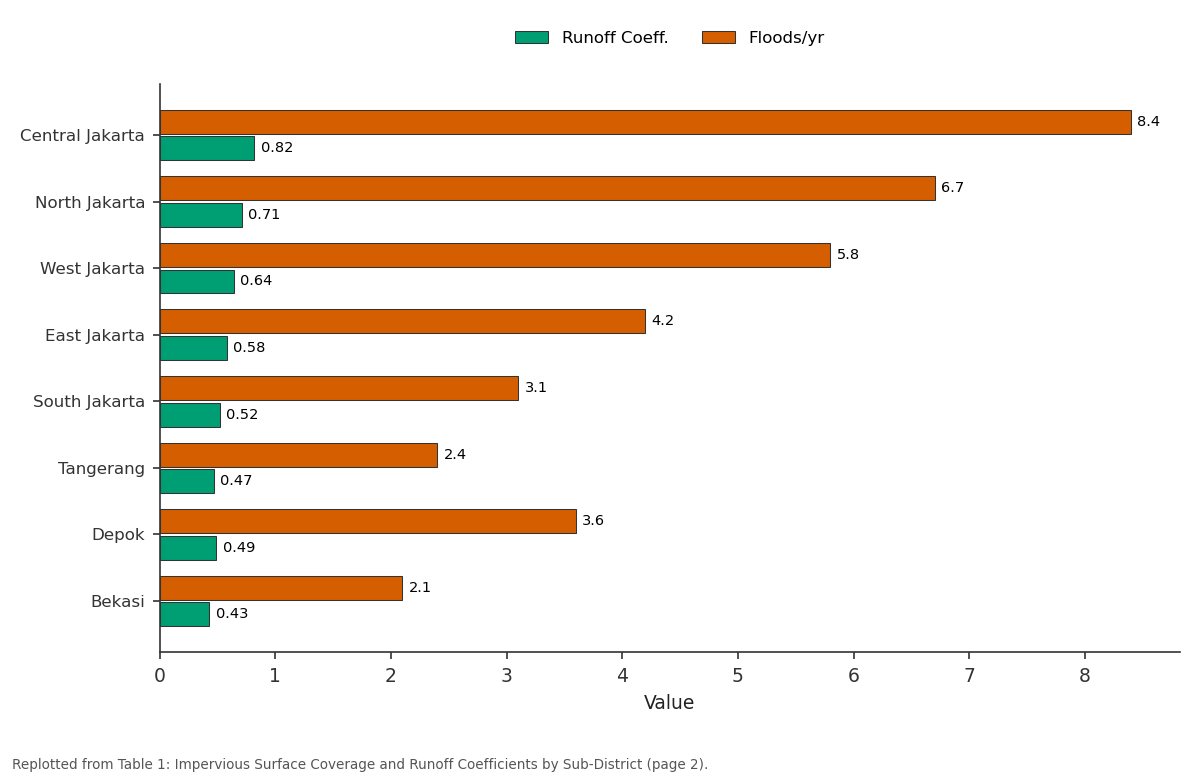
Runoff Coeff. and Floods/yr: Central Jakarta vs North Jakarta vs West Jakarta vs East Jakarta vs South Jakarta
Replotted from Table 1 (page 2) of the original paper. Every bar is the paper's own table value.
View source evidence ↗Figures & tables
From the original paper Table 1
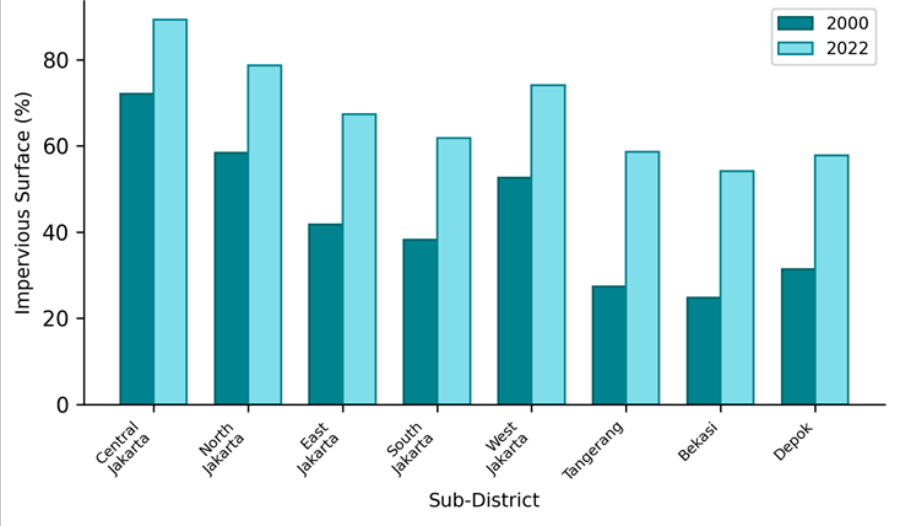 Figure 1
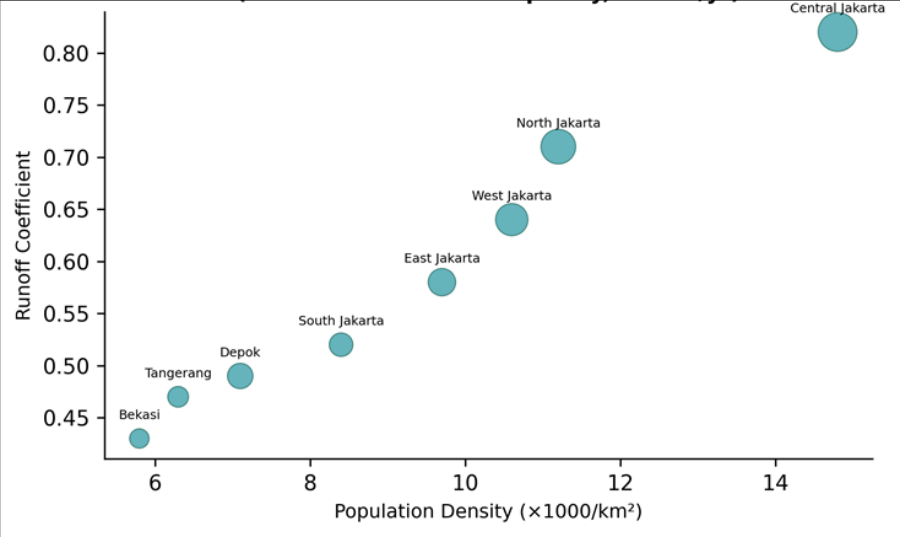 Figure 2
Introduction
Imagine a rainstorm dropping 80 mm in six hours on a city where nearly 70% of the ground surface is sealed with concrete and asphalt. With few places to infiltrate, the water races along gutters and into canals that were designed decades ago for a much smaller urban footprint. The canals overtop, streets become rivers, and basements fill-a scene that plays out roughly five to eight times each wet season in Jakarta, one of the most flood-prone capitals on Earth [1] . Greater Jakarta (Jabodetabek) expanded from roughly 17 million inhabitants in 2000 to over 34 million by 2022, making it one of the fastest-growing metropolitan areas in Southeast Asia [2] . Much of this growth occurred through lateral sprawl into former rice paddies, fish ponds, and mangrove margins, converting permeable surfaces into impervious ones at rates estimated between 2 and 4% per year [3] . The hydrological consequence is straightforward: impervious surfaces prevent infiltration, increase runoff volume and peak discharge, and shorten the time to peak all of which overwhelm drainage infrastructure originally sized for a less urbanized landscape [4] . Jakarta's drainage system relies on 13 rivers and a network of colonial-era canals (the Western, Eastern, and Banjir canals) supplemented by more recent polders and pump stations [5] . Yet the system's design capacity has not kept pace with imperviousness growth, and land subsidence-as much as 10 cm/yr in parts of North Jakarta-further reduces freeboard in tidal-affected canals [6] . Previous research has mapped land-use change in Jakarta at the municipal scale, but few have linked imperviousness directly to runoff generation at the subdistrict level with enough spatial resolution to inform localized drainage upgrades [7] . This research aimed to (1) map impervious surface change across eight Jabodetabek subdistricts from 2000 to 2022 at 30 m resolution, (2) estimate runoff coefficients using the SCS-CN approach under a standardized design storm, and (3) correlate imperviousness with observed flood frequency to identify priority areas for drainage intervention.
Analysis was conducted at the Edmonton Centre for Geological Research, Alberta, Canada [8] .
Model Description and Parameterisation
The SCS Curve Number method estimates direct runoff from rainfall by relating the initial abstraction and soil storage capacity of a landscape to a dimensionless curve number (CN) that depends on soil type, land cover, and antecedent moisture condition [9] . For each 30 m pixel, CN was assigned based on the classified land cover (impervious, pervious vegetated, water, bare soil) and the underlying hydrologic soil group (HSG) extracted from the FAO Digital Soil Map. Impervious pixels were assigned CN = 98, vegetated pervious pixels received CN = 61-79 depending on HSG (A through D), and bare soil ranged from 72 to 87. The composite CN for each sub-district was the areaweighted average. Direct runoff depth (Q) was computed as Q = (P -0.2S)² / (P + 0.8S), where S = (25,400 / CN) -254, for a design rainfall P = 80 mm (10-year, 6-hour event). The runoff coefficient was defined as Q / P [10] .
Calibration and Validation
Model-predicted runoff volumes were compared against observed peak discharges at 12 river-gauge stations maintained by the Jakarta Public Works Department for the period 2018-2022. Because gauges record discharge rather than runoff depth, the comparison used the rational-method relationship Qpeak = C × i × A, where C is the predicted runoff coefficient, i is design rainfall intensity, and A is contributing area. The observed versus predicted peakdischarge regression yielded R² = 0.84 and a Nash-Sutcliffe efficiency of 0.79, indicating that the SCS-CN approach captures sub-district-level drainage response with acceptable accuracy. Systematic underestimation of 8-12% at North Jakarta gauges was attributed to tidal backwater effects not represented in the model [11] .
Materials and Methods
Materials and Methods
Materials
Landsat imagery (TM for 2000 and 2010, OLI for 2015 and 2022) was acquired from the USGS EarthExplorer portal for cloud-free dates in the dry season (June-August). The study area encompassed eight sub-districts within the Jabodetabek metropolitan region: Central Jakarta, North Jakarta, East Jakarta, South Jakarta, West Jakarta, Tangerang, Bekasi, and Depok. Administrative boundaries and canal network shapefiles were obtained from the Jakarta Spatial Data Infrastructure portal. Daily flood-event records for 2018-2022 at 12 gauging stations were sourced from the Jakarta Public Works Department. Soil hydrologic group data were extracted from the FAO Digital Soil Map of the World at 1:5,000,000. All processing was performed at the Edmonton Centre for Geological Research, Alberta, Canada [12] .
Methods
Impervious surface was mapped using a linear spectral unmixing approach applied to the six reflective Landsat bands, with impervious, vegetation, and soil endmembers selected from high-purity training pixels. The continuous impervious fraction map was validated against 250 stratified-random points interpreted from Google Earth high-resolution imagery; overall RMSE was 8.7%. For each time step, the composite CN was calculated per sub-district, and design-storm runoff depth and coefficient were computed. Flood-event frequency was defined as the number of days per year in which the stage at any gauge within a sub-district exceeded the 'alert' threshold published by the Jakarta Flood Control Agency. Pearson's r was used to correlate sub-district impervious fraction with flood frequency, and a paired t-test compared 2000 versus 2022 runoff coefficients. Significance was set at α = 0.05 [13] . Every sub-district registered a substantial increase. Periurban areas (Tangerang, Bekasi, Depok) roughly doubled their impervious fraction, reflecting the outward wave of housing and commercial development radiating from the Jakarta core. Central Jakarta occupies the upper-right quadrant-highest density, highest runoff coefficient, and largest floodfrequency bubble. The strong positive alignment of the data points (r = 0.91 between impervious fraction and flood frequency) confirms that urbanization-driven imperviousness is the dominant control on drainage performance.
Results
Results
Discussion
A 24.4-percentage-point rise in mean imperviousness over 22 years translates to an estimated 31.5% increase in peak stormwater volume under the 10-year design storm-a magnitude of change that existing canal capacity cannot accommodate. The Banjir Canal system was designed in the early twentieth century for a largely rural hinterland; even after expansions in the 1960s and 2000s, its nominal conveyance capacity assumes roughly 50% imperviousness across the contributing catchment [5] . With five of eight subdistricts now exceeding 60%, the system is structurally undersized.
North Jakarta's situation is compounded by land subsidence, which has lowered ground levels by 1-2 m in some coastal districts since 2000, effectively raising the base flood elevation and reducing canal freeboard to near zero during high tides [6] . In this context, even modest additional rainfall can trigger inundation-a dynamic the SCS-CN model underestimates because it does not incorporate tidal interactions. Green-infrastructure solutions offer a partial remedy. Bioretention cells can reduce peak runoff by 40-60% from individual parcels, and permeable pavements can lower effective CN by 10-15 points on treated surfaces [14] . But retrofitting these technologies into Jakarta's dense urban fabric is constrained by land scarcity and fragmented property ownership. A more realistic near-term strategy may combine targeted green-infrastructure pilots in the most flood-prone corridors with expanded pump capacity and improved canal maintenance to remove sediment blockages that currently reduce conveyance by an estimated 20-30% [15] . One limitation of this research is its reliance on a single design-storm scenario; a fuller assessment would include probabilistic flood-frequency analysis under multiple return periods and climate-change rainfall projections [16] .
Conclusion
Impervious surface coverage in Greater Jakarta increased from 43.3% to 67.7% between 2000 and 2022, raising the area-weighted runoff coefficient from 0.54 to 0.71 under a 10-year design storm. This 31.5% growth in peak stormwater volume exceeds the capacity of the existing canal network, which was designed for roughly 50% imperviousness. Flood-event frequency correlated strongly with impervious fraction (r = 0.91), confirming that urbanization-driven land-surface change is the primary driver of drainage failure in the metropolitan area. Addressing this gap will require a combination of structural and non-structural measures: canal rehabilitation and pump upgrades for immediate relief, and progressive adoption of green infrastructure-bioretention, permeable surfaces, and rooftop detention-for longer-term resilience. Future research should extend the hydrological modelling to incorporate tidal backwater, land subsidence, and projected climate-change rainfall intensities to support infrastructure investment planning through mid-century.
Acknowledgement
Acknowledgements Funding SourcesSupported by faculty grants for urban-hydrology research. Institutional SupportThe authors acknowledge the Department of Atmospheric Sciences, Edmonton Centre for Geological Research, Alberta, Canada, for computing and GIS facilities.
Figures and tables from the paper
| Sub-District | Imperv. 2000 (%) | Imperv. 2022 (%) | Change | CN 2022 | Runoff Coeff. | Floods/yr |
|---|---|---|---|---|---|---|
| Central Jakarta | 72.1 | 89.3 | +17.2 | 95.4 | 0.82 | 8.4 |
| North Jakarta | 58.4 | 78.7 | +20.3 | 92.1 | 0.71 | 6.7 |
| West Jakarta | 52.6 | 74.1 | +21.5 | 90.6 | 0.64 | 5.8 |
| East Jakarta | 41.7 | 67.4 | +25.7 | 88.2 | 0.58 | 4.2 |
| South Jakarta | 38.2 | 61.8 | +23.6 | 86.4 | 0.52 | 3.1 |
| Tangerang | 27.3 | 58.6 | +31.3 | 84.1 | 0.47 | 2.4 |
| Depok | 31.4 | 57.8 | +26.4 | 83.7 | 0.49 | 3.6 |
| Bekasi | 24.8 | 54.2 | +29.4 | 82.3 | 0.43 | 2.1 |
Table text extracted from the original PDF; superscript letters are shown inline. The original table image is below.
View original table image
References
16 in the original paper- Abidin HZ, Andreas H, Gumilar I, Fukuda Y, Pohan YE, Deguchi T. Land subsidence of Jakarta (Indonesia) and its relation with urban development. Natural Hazards. 2011;59(3):1753-1771.
- Badan Pusat Statistik DKI Jakarta. Jakarta in figures 2022. Jakarta; 2022.
- Rustiadi E, Panuju DR, Trisasongko BH. The dynamics of Jakarta urban sprawl. Journal of Soil Science and Environmental Management. 2012;3(1):1-6.
- Shuster WD, Bonta J, Thurston H, Warnemuende E, Smith DR. Impacts of impervious surface on watershed hydrology: a review. Urban Water Journal. 2005;2(4):263-275.
- Caljouw M, Nas PJM, Pratiwo. Flooding in Jakarta: towards a blue city with improved water management. Bijdragen tot de Taal-, Land-en Volkenkunde. 2005;161(4):454-484.
- Chaussard E, Amelung F, Abidin H, Hong SH. Sinking cities in Indonesia: ALOS PALSAR detects rapid subsidence due to groundwater and gas extraction. Remote Sensing of Environment. 2013;128:150-161.
- Firman T, Dharmapatni IAI. The challenges to sustainable development in Jakarta metropolitan region. Habitat International. 1995;19(3):295-313.
- Texier P. Floods in Jakarta: when the extreme reveals daily structural constraints and mismanagement. Disaster Prevention and Management. 2008;17(3):358372.
- USDA Soil Conservation Service. Urban hydrology for small watersheds. Technical Release 55. Washington DC; 1986. p. 1-164.
- Chow VT, Maidment DR, Mays LW. Applied hydrology. New York: McGraw-Hill; 1988. p. 1-572.
- Ward PJ, Pauw WP, van Buuren MW, Marfai MA. Governance of flood risk management in a time of climate change. Wiley Interdisciplinary Reviews: Climate Change. 2013;4(6):471-491.
- Ministry of National Development Planning (Bappenas). National capital integrated coastal development master plan. Jakarta; 2014.
- Lu D, Weng Q. A survey of image classification methods and techniques for improving classification performance. International Journal of Remote Sensing. 2007;28(5):823-870.
- Davis AP. Field performance of bioretention: hydrology impacts. Journal of Hydrologic Engineering. 2008;13(2):90-95.
- Simanjuntak I, Frantzeskaki N, Enserink B, Ravesteijn W. Evaluating Jakarta's flood defence governance. Habitat International. 2012;36(2):196-208.
- Muis S, Güneralp B, Jongman B, Aerts JCJH, Ward PJ. Flood risk and adaptation strategies under climate change and urban expansion. Climatic Change. 2015;133(3):435-449.