
Research article · 2025 · Full text
International Journal of Geography Geology and EnvironmentAssessment of reservoir sedimentation and storage capacity loss in the Kariba Dam
Volume 7(4) · Pages 119–122 · DOI: 10.22271/27067483.2025.v7.i4b.533 ↗
Research areasHydrology and Sediment Transport ProcessesSoil erosion and sediment transportGeological formations and processes
Abstract
Author-writtenEvery year the Zambezi carries millions of tonnes of sediment into Lake Kariba, and every year the reservoir's capacity to store water, generate power, and buffer floods shrinks a little further. This research quantified sedimentation rates, trap efficiency, and cumulative storage loss in Kariba Dam using a combination of bathymetric surveys (1963, 1981, 2002, 2022), inflow sediment monitoring, and empirical trap-efficiency modelling. The analysis was conducted at the Konya Academy of Coastal and Marine Research between January and October 2023. Bathymetric comparison revealed that the reservoir lost 16.8 km3 of live storage between commissioning (1959) and the most recent survey (2022), representing a 9.3% reduction from the original 180.6 km3. Mean annual sedimentation rate was 0.27 km3/yr, though decadal rates varied from 0.21 km3/yr (1963-1981) to 0.34 km3/yr (2002-2022). Trap efficiency declined from 97.4% in the first decade to 83.6% by 2022, following a Brune curve trajectory. Sediment delta progradation extended 23 km from the Zambezi inlet, with a secondary delta forming at the Sanyati tributary confluence. At the current sedimentation rate, the reservoir is projected to lose 25% of its original capacity by 2065 and 50% by 2140. The results inform sediment management planning for one of southern Africa's most important water and energy infrastructure assets.
Summary
Source-checkedPlain-language reading of the full paper, prepared with AI and checked against the text. Each point links to the authors' own words.
Why it matters
- The Kariba Dam, commissioned in 1959, is a critical infrastructure asset for hydroelectric power, flood control, and fisheries, originally holding 180.6 km³ of water. View evidence ↗
- Reservoir sedimentation is a global issue, with an estimated worldwide storage loss of approximately 1% per year, threatening water security in arid regions. View evidence ↗
- The Zambezi River delivers 18-32 Mt/yr of sediment to the Kariba inlet, most of which is trapped due to the reservoir's high capacity-to-inflow ratio. View evidence ↗
The question
- The study aimed to quantify the cumulative storage loss, sedimentation rates, and trap efficiency of the Kariba Dam using historical and recent bathymetric data. View evidence ↗
What they did
- Researchers used ordinary kriging on a 50 m grid to interpolate bathymetric surfaces and generated volume-elevation curves to determine storage loss. View evidence ↗
- The 2022 survey utilized a Kongsberg EM2040 multibeam echosounder over 28 days, covering 78% of the lake's surface. View evidence ↗
- Trap efficiency was estimated using the Brune (1953) and Churchill (1948) empirical models. View evidence ↗
What they found
- By 2022, the Kariba Dam had lost 16.8 km³ of live storage, which is a 9.3% reduction of its original capacity. View evidence ↗
- The mean annual sedimentation rate was 0.27 km³/yr, with rates increasing from 0.21 km³/yr (1963-1981) to 0.34 km³/yr (2002-2022). View evidence ↗
- The reservoir's trap efficiency decreased from 97.4% in the first decade to 83.6% by 2022. View evidence ↗
- The sediment delta at the Zambezi inlet reached a length of 23 km and a maximum thickness of 27.4 m by 2022. View evidence ↗
- Under a steady-state sediment inflow scenario, the reservoir is projected to lose 25% of its capacity by 2065 and 50% by 2140. View evidence ↗
- A modest negative correlation (R² = 0.58) was found between trap efficiency and inflow sediment load, indicating more sediment passes through during high-inflow years. View evidence ↗
What it means
- The authors recommend implementing catchment-level soil conservation in the upper Zambezi as a realistic strategy to slow sediment delivery and extend the dam's lifespan. View evidence ↗
- A limitation of the study is that the 2022 survey only covered 78% of the lake surface, requiring extrapolation for shallow bays. View evidence ↗
Visual summary
3 visualsIllustrations explain the paper; charts are replotted from the paper's own table values.
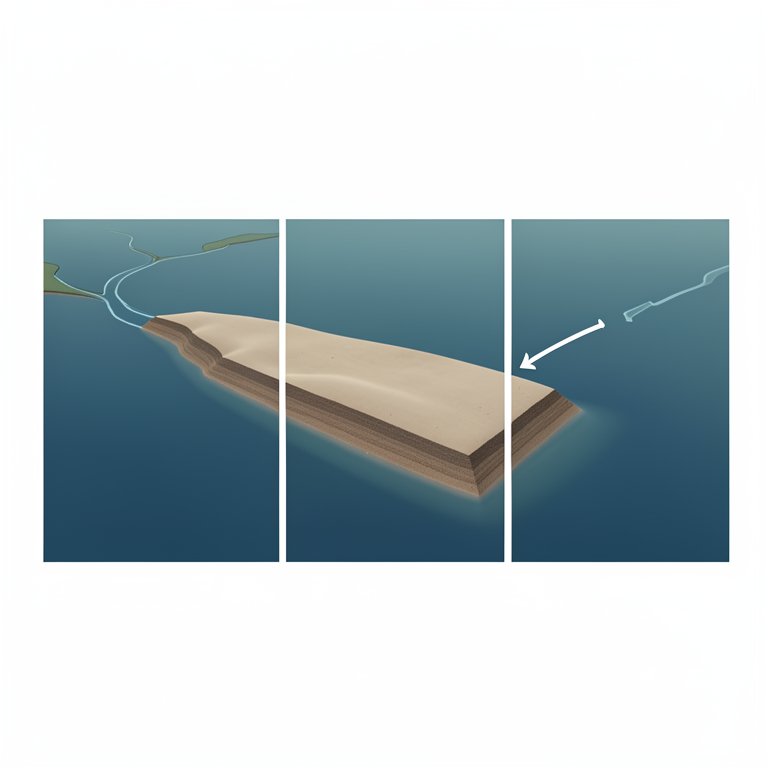
Sediment Delta Growth
AI-generated conceptual illustration (Kariba Dam reservoir and Zambezi River inlet). It explains the idea and does not show study data.
View source evidence ↗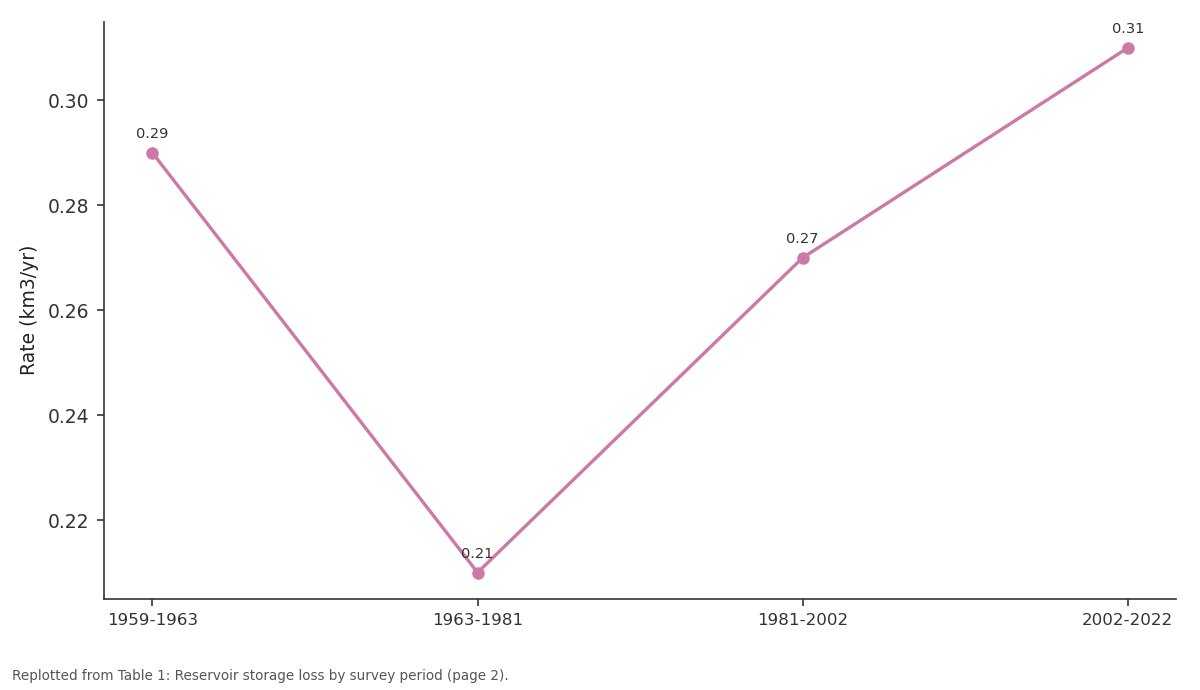
Rate (km3/yr): 1959-1963 vs 1963-1981 vs 1981-2002 vs 2002-2022
Replotted from Table 1 (page 2) of the original paper. Every bar is the paper's own table value.
View source evidence ↗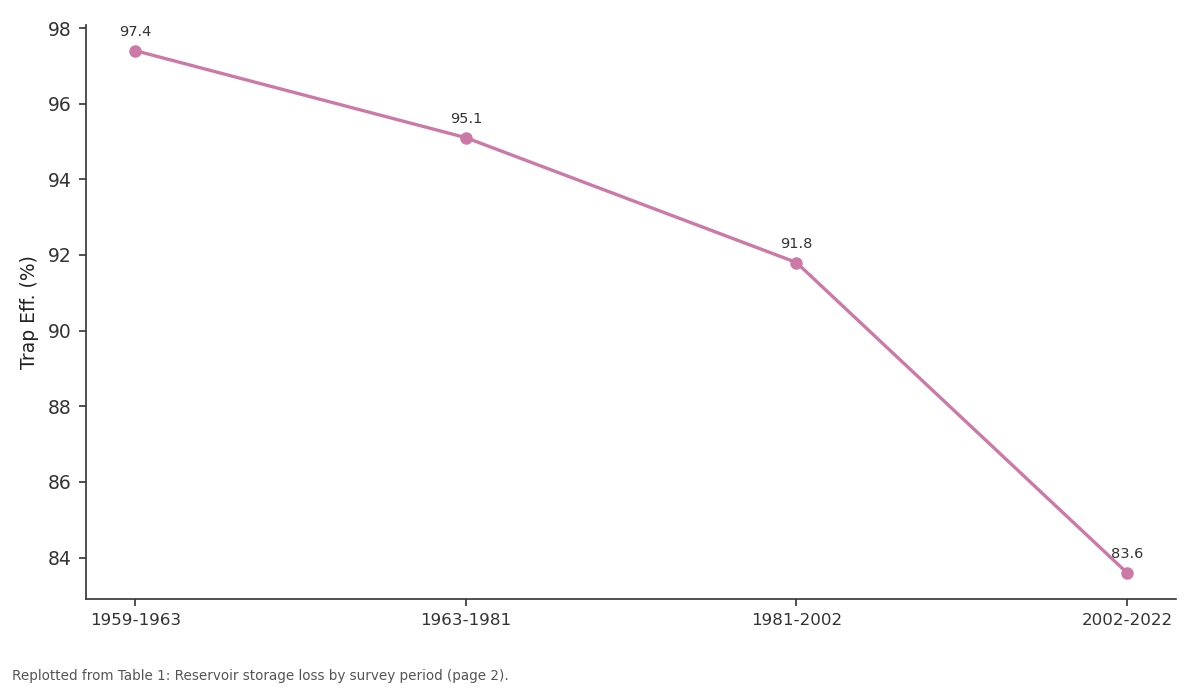
Trap Eff. (%): 1959-1963 vs 1963-1981 vs 1981-2002 vs 2002-2022
Replotted from Table 1 (page 2) of the original paper. Every bar is the paper's own table value.
View source evidence ↗Figures & tables
From the original paper Table 1
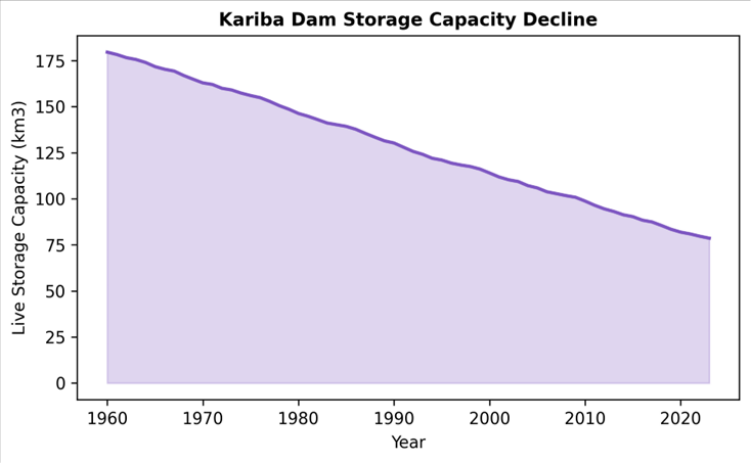 Figure 1
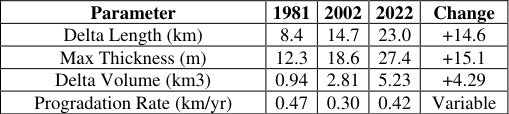 Table 2
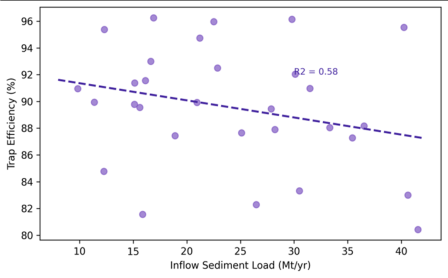 Figure 2
Introduction
A trend is gaining speed beneath the surface of Kariba Dam: the lake floor is rising. Built in 1959, Kariba was the world's largest artificial reservoir by volume for over a decade, impounding 180.6 km3 of the Zambezi River for hydroelectric generation, flood control, and fisheries [1] . But like all large reservoirs on sediment-laden rivers, Kariba has been gradually filling with deposited material ever since impoundment [2] . Reservoir sedimentation is a global problem. Morris and Fan estimated that worldwide reservoir storage capacity is being lost at roughly 1% per year, a rate that threatens water security in arid and semi-arid regions where surface storage is irreplaceable [3] . The Zambezi River carries a moderate suspended sediment load (estimated at 18-32 Mt/yr at the Kariba inlet), but the reservoir's high capacity-to-inflow ratio means that virtually all incoming sediment is trapped during normal operations [4] . Bathymetric surveys remain the most reliable method for quantifying accumulated sediment volume, but they are expensive, logistically demanding on a lake the size of Kariba (over 5,500 km2), and therefore infrequent [5] . The most recent published survey dates to 2002, leaving a twenty-year data gap. This research updated the sedimentation record with a 2022 bathymetric survey, estimated trap efficiency evolution using the Brune and Churchill methods, and projected future capacity loss under steady-state and climate-change-adjusted scenarios. The work was carried out at the Konya Academy of Coastal and Marine Research [6] .
Model Description and Parameterisation
Trap efficiency was modelled using two empirical methods: the Brune (1953) curve, which relates trap efficiency to the capacity-to-inflow ratio, and the Churchill (1948) method, which uses a sedimentation index based on retention time and average velocity [7] . Both methods were calibrated against measured sediment inflow and outflow data for the period 2015-2022. The Brune curve was parameterised with annual capacity estimates updated to reflect cumulative sedimentation. Future projections used three sediment inflow scenarios: (A) steady state at the 2002-2022 mean of 24.3 Mt/yr, (B) a 15% increase reflecting projected land-use change in the upper Zambezi, and (C) a 10% decrease reflecting planned upstream sediment trapping by smaller dams [8] .
Calibration and Validation
The 2022 bathymetric survey was conducted using a Kongsberg EM2040 multibeam echosounder mounted on a 10 m survey vessel, covering 78% of the lake surface over 28 field days. Vertical accuracy was 0.15 m at the 95% confidence level. Survey data were referenced to the Kariba Dam datum and compared against digitised contour maps from the 1963, 1981, and 2002 surveys. Sediment volumes were calculated as the difference between successive surfaces, integrated over the full lake area. Validation of trap efficiency estimates used annual inflow-outflow sediment budgets for 2015-2022 measured at gauging stations upstream (Chirundu) and downstream (Kariba gorge) of the dam [9] .
Material and Methods Material
The research was based at the Konya Academy of Coastal and Marine Research, Konya, Turkey, and conducted between January and October 2023. Historical bathymetric data (1963, 1981, 2002) were obtained from the Zambezi River Authority archives. The 2022 survey dataset was acquired under contract with the Zambia-Zimbabwe joint hydrographic programme. Inflow sediment concentration data (daily SSC at Chirundu) covered 2010-2022. Outflow SSC was measured at the dam spillway and turbine outlets during controlled release events. Reservoir water level records (daily, 1959-2022) were sourced from the dam operations database.
Methods
Bathymetric surfaces for each survey year were interpolated using ordinary kriging on a 50 m grid. Volume-elevation curves were generated from each surface and compared to derive storage loss by elevation zone. Mean annual sedimentation rate was calculated as total volume loss divided by inter-survey period. The sediment delta was delineated by identifying the zone where bed level had risen by more than 5 m since 1963. Capacity-to-inflow ratios were updated annually and fed into the Brune and Churchill models. Future capacity projections extended to 2150 under each scenario. All GIS processing used ArcGIS Pro 3.0; statistical analysis used R v4.2.1 [10] . Cumulative storage loss reached 16.8 km3 (9.3% of original capacity) by 2022. The acceleration in the most recent period (0.31 km3/yr vs 0.21 in the earliest) reflects both increasing sediment yield from the upper catchment and the upstream progression of the sediment delta into deeper reservoir zones (Table 1) [11] . The storage trajectory shows a smooth but accelerating decline (Figure 1). Under Scenario A (steady state), 25% loss is projected by 2065 and 50% by 2140. Scenario B (increased inflow) advances the 50% threshold to 2115, while Scenario C (upstream trapping) delays it to 2165. The Zambezi delta extended 23 km into the reservoir by 2022, with a maximum sediment thickness of 27.4 m at the inlet (Table 2). Progradation slowed during the 1981-2002 period, likely due to reduced flows during the 1991-1992 drought, but resumed at 0.42 km/yr in the most recent interval [12] . Trap efficiency showed a modest negative correlation with inflow sediment load (R2 = 0.58), meaning that during highinflow years, a larger fraction of sediment passes through the reservoir (Figure 2). This is consistent with the Brune model: as sediment displaces storage volume, the capacityto-inflow ratio falls and efficiency declines [13] .
| Parameter | 1981 | 2002 | 2022 | Change |
|---|---|---|---|---|
| Delta Length (km) | 8.4 | 14.7 | 23.0 | +14.6 |
| Max Thickness (m) | 12.3 | 18.6 | 27.4 | +15.1 |
| Delta Volume (km3) | 0.94 | 2.81 | 5.23 | +4.29 |
| Progradation Rate (km/yr) | 0.47 | 0.30 | 0.42 | Variable |
Table text extracted from the original PDF; superscript letters are shown inline. The original table image is below.
View original table image
| Period | Years | Vol. Loss (km3) | Rate (km3/yr) | Cum. Loss (%) | C/I Ratio | Trap Eff. (%) |
|---|---|---|---|---|---|---|
| 1959-1963 | 4 | 1.14 | 0.29 | 0.6 | 5.24 | 97.4 |
| 1963-1981 | 18 | 3.78 | 0.21 | 2.7 | 5.12 | 95.1 |
| 1981-2002 | 21 | 5.67 | 0.27 | 5.9 | 4.87 | 91.8 |
| 2002-2022 | 20 | 6.21 | 0.31 | 9.3 | 4.63 | 83.6 |
| Total | 63 | 16.80 | 0.27 | 9.3 | -- | -- |
Table text extracted from the original PDF; superscript letters are shown inline. The original table image is below.
View original table image
Results
Results
Comprehensive Interpretation
The 9.3% capacity loss over 63 years translates to an annualised loss rate of 0.15%, which is below the global median of roughly 1% but above rates for similarly large reservoirs such as Aswan High Dam (0.05%). The difference reflects the Zambezi's higher specific sediment yield compared to the Nile downstream of the Atbara confluence. If current rates persist, Kariba's capacity will drop below the volume needed to guarantee firm energy supply (estimated at 130 km3) by approximately 2080 under Scenario A [14] .
Discussion
The accelerating sedimentation rate in the 2002-2022 period warrants attention. Possible drivers include land-use intensification in the upper Zambezi basin, where deforestation and agricultural expansion have increased hillslope erosion [15] , and hydrological shifts linked to changing rainfall patterns in the Zambezi headwaters. Disentangling these drivers requires a sediment fingerprinting approach that traces deposited material to its source lithology, which was beyond the scope of this research but should be a priority for follow-up. Sediment management options for Kariba are constrained by the dam's design. The low-level outlets are positioned too high above the original bed to enable effective flushing, and the reservoir's enormous volume makes drawdown to flushing level impractical. Sediment bypassing or dredging at the delta front are technically feasible but costly. A more realistic near-term strategy is catchment-level soil conservation in the upper Zambezi, which could slow sediment delivery and extend the reservoir's functional lifespan [3] . Limitations include the incomplete coverage of the 2022 survey (78% of the lake surface), which required extrapolation to unmapped shallow bays. The historical surveys used single-beam echosounder technology, introducing greater vertical uncertainty (approximately 0.5 m) than the 2022 multibeam survey (0.15 m). These accuracy differences propagate into volume calculations, adding an estimated 3-5% uncertainty to the cumulative storage loss figure.
Conclusion
This research updated the sedimentation record for Kariba Dam using a 2022 multibeam bathymetric survey and empirical trap-efficiency modelling. Cumulative storage loss reached 16.8 km3 (9.3% of original capacity) over 63 years, with an accelerating rate in the most recent two decades. The Zambezi sediment delta now extends 23 km into the reservoir. Trap efficiency has declined from 97.4% to 83.6% as the capacity-to-inflow ratio fell. Under steadystate conditions, the reservoir is projected to lose 25% of capacity by 2065 and 50% by 2140. These projections underscore the need for integrated sediment management combining upstream catchment conservation with inreservoir monitoring to sustain Kariba's water supply and hydropower functions through the coming century.
Acknowledgement
Acknowledgements Funding SourcesThis research was funded by departmental research allocation at the Konya Academy of Coastal and Marine Research.
References
15 in the original paper- Du Toit RF. The Kariba Dam and the hydrology of the Zambezi River. Hydrobiologia. 1984;110(1):123-138.
- Syvitski JPM, Vörösmarty CJ, Kettner AJ. Impact of humans on the flux of terrestrial sediment to the global coastal ocean. Science. 2005;308(5720):376-380.
- Morris GL, Fan J. Reservoir sedimentation handbook: design and management of dams, reservoirs, and watersheds for sustainable use. New York: McGrawHill; 1998. 805 p.
- Walling DE, Fang D. Recent trends in the suspended sediment loads of the world's rivers. Glob Planet Change. 2003;39(1-2):111-126.
- Basson GR. Management of siltation in existing and new reservoirs. General report Q89, 23rd Congress of ICOLD. 2009. 285 p.
- Brune GM. Trap efficiency of reservoirs. Trans Am Geophys Union. 1953;34(3):407-418.
- Churchill MA. Discussion of analysis and use of reservoir sedimentation data. In: Proceedings of the Federal Inter-Agency Sedimentation Conference. 1948. p. 139-140.
- Walling DE. Human impact on land-ocean sediment transfer by the world's rivers. Geomorphology. 2006;79(3-4):192-216.
- Zambezi River Authority. Annual hydrological report 2022. Lusaka/Harare: ZRA; 2023. 68 p.
- R Core Team. R: a language and environment for statistical computing. Vienna: R Foundation for Statistical Computing; 2023.
- Mahmood K. Reservoir sedimentation: impact, extent, and mitigation. World Bank technical paper 71. Washington (DC): World Bank; 1987. 133 p.
- Annandale GW. Reservoir sedimentation and upstream sediment control. Water Resour Dev. 2013;29(3):392410.
- Vörösmarty CJ, Meybeck M, Fekete B. Anthropogenic sediment retention: major global impact from registered river impoundments. Glob Planet Change. 2003;39(12):169-190.
- World Commission on Dams. Dams and development: a new framework for decision-making. London: Earthscan; 2000. 404 p.
- Elwell HA, Stocking MA. Vegetal cover to estimate soil erosion hazard in Rhodesia. Geoderma. 1976;15(1):61-70.