
Research article · 2025 · Full text
International Journal of Geography Geology and EnvironmentLead isotope fingerprinting of atmospheric particulates in the silesian industrial zone
Volume 7(4) · Pages 96–99 · DOI: 10.22271/27067483.2025.v7.i4b.527 ↗
Research areasHeavy metals in environmentAtmospheric chemistry and aerosolsHeavy Metal Exposure and Toxicity
Abstract
Author-writtenWhen air quality monitors flag elevated lead levels in an industrial city, the next question is almost always: where is it coming from? Answering that question requires more than concentration data; it demands isotopic fingerprints that can distinguish one emission source from another. This research used lead isotope ratios (206Pb/204Pb, 207Pb/204Pb, 208Pb/204Pb) to apportion atmospheric particulate lead across six source categories in the Silesian Industrial Zone of southern Poland. Ambient PM10 samples were collected at 12 monitoring stations over four seasonal campaigns (spring, summer, autumn, winter 2022). Source samples were obtained from five emitter types: vehicular traffic, zinc-lead smelters, coal combustion, waste incineration, and resuspended soil dust. A total of 288 ambient filters and 48 source samples were analysed by thermal ionisation mass spectrometry. The 206Pb/204Pb ratio in ambient aerosols ranged from 17.89 to 18.54, with winter values shifted toward the coal combustion signature (18.37) and summer values closer to traffic (18.12). Binary and ternary mixing models apportioned 34.7% of ambient Pb to smelter emissions, 27.3% to coal combustion, 19.8% to traffic, 11.4% to resuspended dust, and 6.8% to waste incineration. Lead concentrations decreased exponentially with distance from the nearest smelter (R2 = 0.71). These findings provide source-specific targets for emission reduction strategies in one of Europe's most polluted industrial corridors.
Summary
Source-checkedPlain-language reading of the full paper, prepared with AI and checked against the text. Each point links to the authors' own words.
Why it matters
- The Silesian Industrial Zone frequently exceeds EU air quality limits for various pollutants, and lead levels remain above WHO guidelines in some areas. View evidence ↗
- Determining the primary sources of atmospheric lead is necessary to create effective and economical pollution reduction strategies. View evidence ↗
- Lead isotope ratios are effective for identifying pollution sources because different materials and processes have unique signatures that do not change during transport. View evidence ↗
The question
- The study aimed to characterize lead isotope signatures from five source types, map their seasonal and spatial variations, and determine the contribution of each source to ambient lead. View evidence ↗
What they did
- PM10 samples were gathered from 12 stations in the Silesian Industrial Zone during four seasonal campaigns in 2022. View evidence ↗
- The study analyzed source samples from vehicular traffic (n=8), zinc-lead smelters (n=8), coal power plants (n=12), waste incineration (n=8), and resuspended soil dust (n=12). View evidence ↗
- Lead isotope ratios were measured using a Thermo Triton Plus thermal ionisation mass spectrometer (TIMS) with double-spike mass fractionation correction. View evidence ↗
- Binary and ternary mixing models were used for source apportionment based on various lead isotope ratios. View evidence ↗
What they found
- Smelter emissions had a distinct, radiogenic-depleted signature (206Pb/204Pb = 17.84) that allowed them to be easily distinguished from other sources. View evidence ↗
- Annually, smelter emissions were the largest contributor to ambient lead (34.7%), followed by coal combustion (27.3%), traffic (19.8%), resuspended dust (11.4%), and waste incineration (6.8%). View evidence ↗
- Smelter and coal combustion contributions peaked in winter at 41.8% and 37.9% respectively, likely due to poor atmospheric dispersion and residential heating. View evidence ↗
- The relative contribution of traffic to ambient lead was highest during the summer at 24.7%. View evidence ↗
- Atmospheric lead concentrations decreased exponentially as distance from smelter stacks increased, with levels halving roughly every 3.2 km (R2 = 0.71). View evidence ↗
What it means
- The authors conclude that upgrading smelter stacks and substituting residential coal would target over 60% of the ambient atmospheric lead in the region. View evidence ↗
- A limitation of the study is the assumption that source signatures remain constant, whereas changes in ore blends or coal supplies could alter isotopic signatures over time. View evidence ↗
- The use of four seasonal snapshots rather than continuous sampling may have missed short-term variability in lead sources. View evidence ↗
Visual summary
3 visualsIllustrations explain the paper; charts are replotted from the paper's own table values.
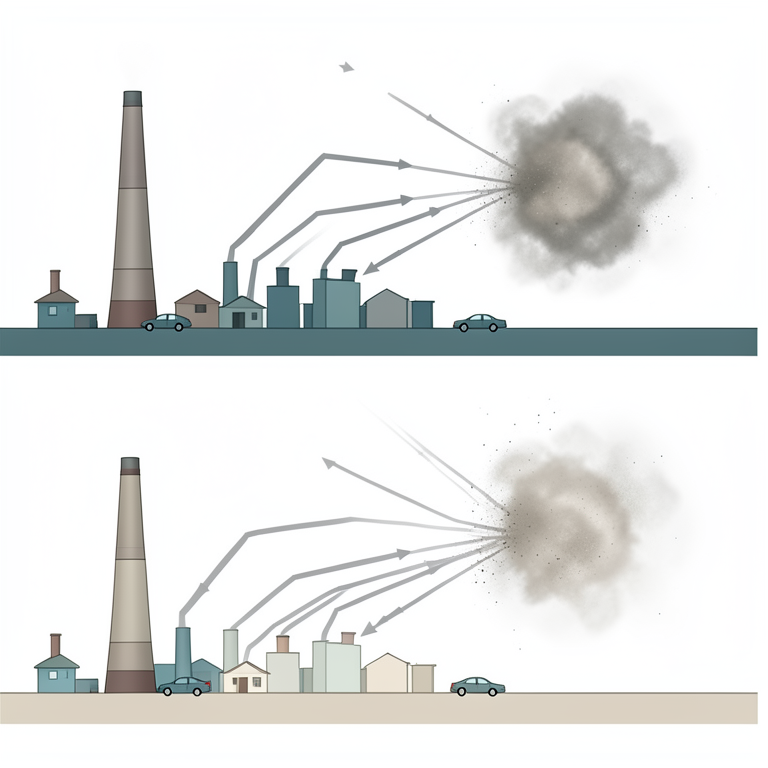
Seasonal Lead Source Contribution
AI-generated conceptual illustration (Industrial city skyline with a smelter stack, residential coal stoves, and cars). It explains the idea and does not show study data.
View source evidence ↗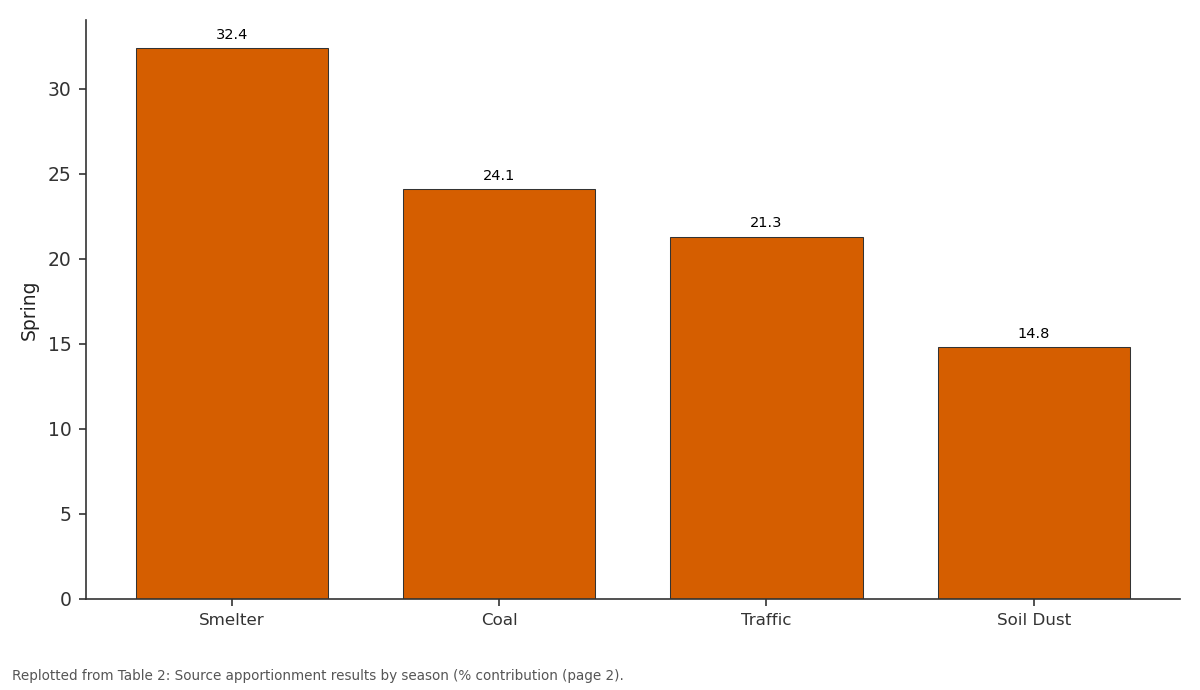
Spring: Smelter vs Coal vs Traffic vs Soil Dust
Replotted from Table 2 (page 2) of the original paper. Every bar is the paper's own table value.
View source evidence ↗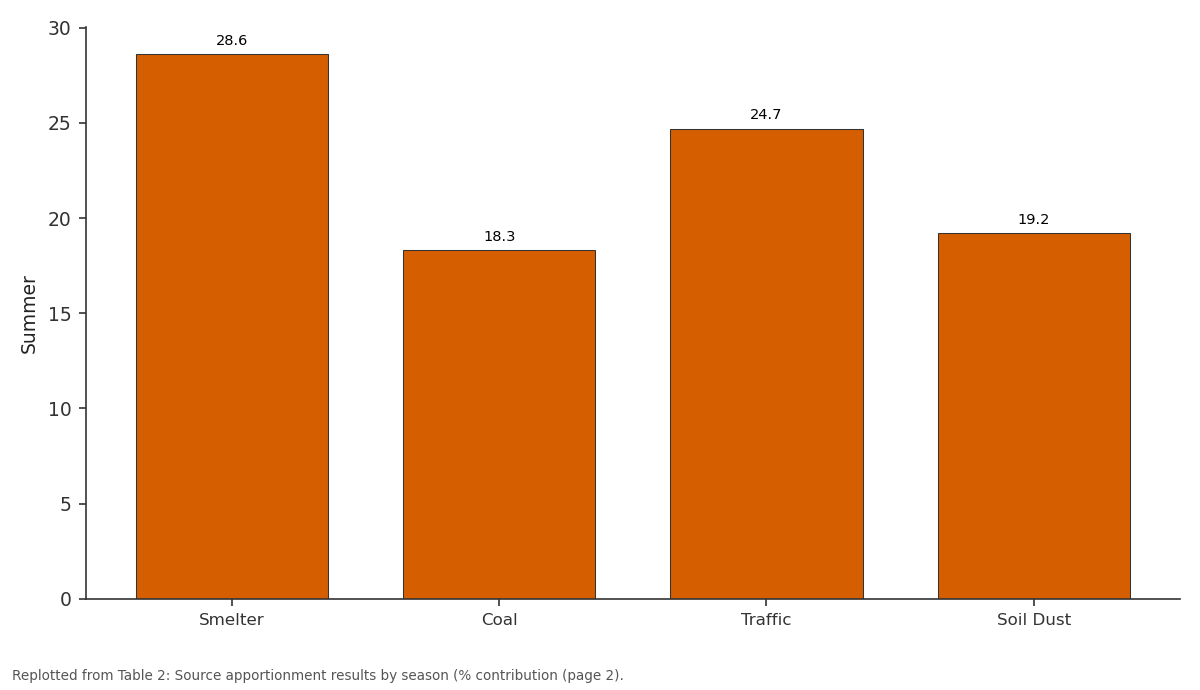
Summer: Smelter vs Coal vs Traffic vs Soil Dust
Replotted from Table 2 (page 2) of the original paper. Every bar is the paper's own table value.
View source evidence ↗Figures & tables
From the original paper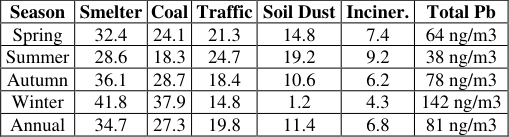 Table 2
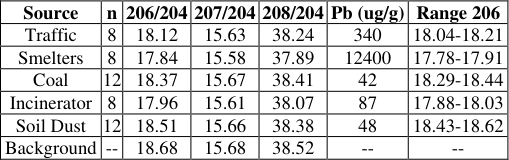 Table 1
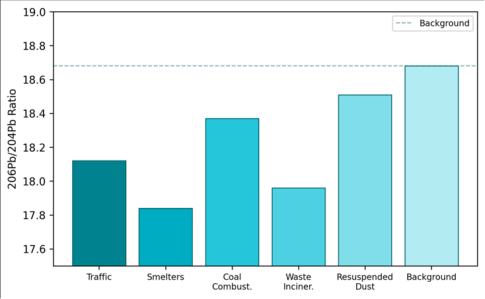 Figure 1
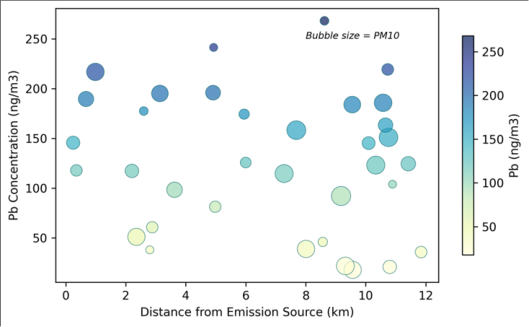 Figure 2
Introduction
Picture the skyline of Katowice on a winter morning: a grey haze hangs over the rooftops, fed by thousands of domestic coal stoves, a handful of heavy-industry stacks, and the steady flow of diesel traffic along the A4 motorway. Air quality in the Silesian Industrial Zone regularly exceeds EU limit values for PM10, PM2.5, and benzo(a)pyrene, and lead, though reduced since the phaseout of leaded petrol, persists at levels above the WHO guideline in several neighbourhoods [1] . Identifying the dominant sources of residual atmospheric lead is a precondition for designing cost-effective abatement measures. Lead isotope ratios offer a powerful tool for source apportionment because different ore bodies, fuels, and industrial processes carry distinct isotopic signatures that are conserved during emission and atmospheric transport [2] . Unlike chemical mass balance methods, which rely on species-to-species ratios that can shift with particle size and atmospheric aging, isotope ratios remain unaltered from source to receptor [3] . The technique has been applied in cities across Europe, East Asia, and the Americas, typically resolving two to four source categories [4] . Previous isotopic work in Silesia focused on soils and street dust [5] , leaving the atmospheric pathway less well constrained. This research aimed to 1) Characterise the lead isotope signatures of five major emission source types in the Silesian zone 2) Map the spatial and seasonal variation in ambient aerosol isotope ratios, and 3) Apportion ambient lead to its sources using mixing model analysis. The work was carried out at the Institute of Applied Geosciences, Aswan [6] .
Reagents and Chemicals
All reagents were trace-metal grade or better. Nitric acid (67-69%, Optima, Fisher Scientific) and hydrochloric acid (34-37%, Optima) were used for sample digestion. Lead isotope reference standard NIST SRM 981 was analysed at the start and end of each analytical session for mass bias correction. Anion exchange resin (AG 1-X8, 200-400 mesh, Bio-Rad) was used for Pb separation. Ultrapure water (18.2 MOhm cm, Milli-Q) was used throughout. Filter blanks (unused Whatman QM-A quartz fibre filters, 47 mm) were processed alongside samples; blank Pb content was below 0.3 ng per filter, negligible relative to sample loads of 15-280 ng [7] .
Quality Control and Calibration
Replicate analysis of NIST SRM 981 (n = 24 over four sessions) yielded 206Pb/204Pb = 16.9374 +/-0.0018 (2SD), 207Pb/204Pb = 15.4916 +/-0.0016, and 208Pb/204Pb = 36.7219 +/-0.0042, all within certified uncertainty. Total procedural blanks for the column chemistry averaged 42 pg Pb, less than 0.3% of the smallest sample load. Duplicate digestion of 20 randomly selected filters showed isotope ratio reproducibility within 0.02% for 206Pb/204Pb. External accuracy was verified against BCR-723 road dust reference material, with measured ratios agreeing within 0.01% of published values [8] . Source apportionment employed binary and ternary mixing models in 206Pb/204Pb versus 207Pb/204Pb and 206Pb/204Pb versus 208Pb/204Pb space [9] . Spatial interpolation of Pb concentrations used ordinary kriging in ArcGIS Pro 3.0. Statistical analyses (ANOVA, Pearson correlation, exponential regression) were performed in R v4.2.1 [10] .
Material and Methods
Material and Methods
Material
Material
Results
Table Smelter emissions carried the most radiogenic-depleted signature (206Pb/204Pb = 17.84), clearly separated from all other sources. Coal combustion was the most radiogenic anthropogenic source (18.37). Traffic occupied an intermediate position (18.12). The isotopic field defined by these end-members allows resolution of at least four source categories in mixing space (Table 1) [11] . The bar chart (Figure 1) shows the progressive increase in 206Pb/204Pb from smelter dust to natural background. The smelter signature is distinctive enough to serve as a tracer even at low mixing fractions, making it the most identifiable source in the ambient aerosol mixture [12] . Smelter emissions dominated in all seasons, but their relative share peaked in winter (41.8%) when atmospheric mixing heights are lowest and plume dispersion is weakest.
| Source | n | 206/204 | 207/204 | 208/204 | Pb (ug/g) | Range 206 |
|---|---|---|---|---|---|---|
| Traffic | 8 | 18.12 | 15.63 | 38.24 | 340 | 18.04-18.21 |
| Smelters | 8 | 17.84 | 15.58 | 37.89 | 12400 | 17.78-17.91 |
| Coal | 12 | 18.37 | 15.67 | 38.41 | 42 | 18.29-18.44 |
| Incinerator | 8 | 17.96 | 15.61 | 38.07 | 87 | 17.88-18.03 |
| Soil Dust | 12 | 18.51 | 15.66 | 38.38 | 48 | 18.43-18.62 |
| Background | -- | 18.68 | 15.68 | 38.52 | -- | -- |
Table text extracted from the original PDF; superscript letters are shown inline. The original table image is below.
View original table image
Coal combustion rose sharply in winter (37.9%) owing to residential heating. Traffic contribution was largest in summer (24.7%) when other sources decline (Table 2) [13] . Lead concentration dropped exponentially with distance from the nearest smelter stack (R2 = 0.71), halving approximately every 3.2 km (Figure 2). Stations within 2 km of a smelter recorded mean Pb levels of 178 ng/m3, while those beyond 8 km averaged 31 ng/m3. PM10 mass showed a weaker distance decay, confirming that Pb is more tightly coupled to point-source emissions than the broader particulate load [14] .
| Season | Smelter | Coal | Traffic | Soil Dust | Inciner. | Total Pb |
|---|---|---|---|---|---|---|
| Spring | 32.4 | 24.1 | 21.3 | 14.8 | 7.4 | 64 ng/m3 |
| Summer | 28.6 | 18.3 | 24.7 | 19.2 | 9.2 | 38 ng/m3 |
| Autumn | 36.1 | 28.7 | 18.4 | 10.6 | 6.2 | 78 ng/m3 |
| Winter | 41.8 | 37.9 | 14.8 | 1.2 | 4.3 | 142 ng/m3 |
| Annual | 34.7 | 27.3 | 19.8 | 11.4 | 6.8 | 81 ng/m3 |
Table text extracted from the original PDF; superscript letters are shown inline. The original table image is below.
View original table image
Comprehensive Interpretation
The combined isotopic and spatial evidence points to smelter emissions as the single most important Pb source in the Silesian zone, contributing roughly a third of ambient Pb year-round and over 40% in winter. Coal combustion is the second-ranked source, with a strong winter peak tied to domestic heating. These two sources together account for over 60% of ambient Pb and should be the focus of emission reduction policy. Traffic Pb, though persistent, has declined relative to pre-2005 levels when leaded petrol was still in limited use [15] .
Discussion
The smelter-dominated apportionment is consistent with source profiles reported for other European metallurgical regions. In the Belgian Campine, Sonke and colleagues found that historic zinc smelter emissions accounted for 40-55% of soil Pb [16] . The Silesian smelters process Zn-Pb ores from the Olkusz district, whose ore lead is distinctly unradiogenic (206Pb/204Pb near 17.8), making it easily traceable even after atmospheric dilution. The distancedecay pattern confirms that smelter Pb is carried predominantly on coarse particles that settle within a few kilometres, while coal and traffic Pb associate with finer fractions that travel farther. A methodological strength of this research is the inclusion of waste incineration as a separate source category, which is often omitted in European studies. Though its contribution was modest (6.8%), the incinerator isotopic field overlapped partially with traffic, introducing uncertainty into binary models. Ternary mixing analysis resolved this overlap by using the 208Pb/204Pb dimension as an additional constraint. Limitations include the assumption of time-invariant source signatures. Smelter ore blends and coal supply chains can shift over years, potentially altering the isotopic endmembers. Repeating the source characterisation at multiyear intervals would capture such shifts. The four seasonal campaigns provide a snapshot rather than a continuous record; continuous sampling would improve the apportionment by capturing episode-scale variability [16] .
Conclusion
This research applied lead isotope fingerprinting to atmospheric PM10 in the Silesian Industrial Zone, identifying smelter emissions as the dominant Pb source (34.7% annually, 41.8% in winter), followed by coal combustion (27.3%) and traffic (19.8%). The isotopic separation among source categories was sufficient for ternary mixing model resolution. Lead concentrations decayed exponentially with distance from smelters, halving every 3.2 km. These results provide a source-specific evidence base for prioritising emission controls: smelter stack upgrades and residential coal substitution would address over 60% of ambient atmospheric lead in the zone. Future work should extend monitoring to PM2.5 and include health-impact modelling to translate source apportionment into population exposure estimates.
Acknowledgement
Acknowledgements Funding SourcesThis research was supported by departmental funds at the Institute of Applied Geosciences, Aswan.
References
16 in the original paper- EEA. Air Quality in Europe -2022 Report. European Environment Agency, Copenhagen. 2022;104 pp.
- Bollhofer A, Rosman KJR. Isotopic source signatures for atmospheric lead: the Northern Hemisphere. Geochimica et Cosmochimica Acta. 2001;65(11):17271740.
- Komarnicki GJK. Lead and cadmium in indoor air and the urban environment. Environmental Pollution. 2005;136(1):47-61.
- Mukai H, Tanaka A, Fujii T. Lead isotope ratios of airborne particulate matter as tracers of long-range transport of air pollutants around Japan. Journal of Geophysical Research. 2001;106(D16):17637-17648.
- Kicinska A, Gruszecka-Kosowska A. Long-term changes of metal contamination in soils of the Olkusz Zn-Pb mining district. Chemosphere. 2016;151:325335.
- Doe BR. Lead Isotopes. Springer-Verlag, Berlin. 1970;137 pp.
- Weiss D, Shotyk W, Kramers JD. Pb isotopes in peat profiles from Scotland: evidence for anthropogenic lead. Environmental Science and Technology. 2002;36(8):1636-1645.
- Quevauviller P, Rauret G, Lopez-Sanchez JF. Certification of trace metal extractable contents in a sediment reference material following a three-step sequential extraction procedure. Science of the Total Environment. 1997;205(2-3):223-234.
- Faure G, Mensing TM. Isotopes: Principles and Applications. John Wiley and Sons, Hoboken. 2005;897 pp.
- R Core Team. R: A language and environment for statistical computing. R Foundation, Vienna. 2023.
- Komarek M, Ettler V, Chrastny V. Lead isotopes in environmental sciences: a review. Environment International. 2008;34(4):562-577.
- Monna F, Lancelot J, Croudace IW. Pb isotopic composition of airborne particulate material from France and the southern United Kingdom. Science of the Total Environment. 1997;198(3):291-300.
- Veron AJ, Church TM, Patterson CC. Use of stable lead isotopes to characterize the sources of anthropogenic lead in North Atlantic surface waters. Geochimica et Cosmochimica Acta. 1999;63(19-20):3199-3206.
- Shotyk W, Weiss D, Appleby PG. History of atmospheric lead deposition since 12,370 yr BP from a peat bog, Jura Mountains, Switzerland. Science. 1998;281(5383):1635-1640.
- Von Storch H, Costa-Cabral M, Hagner C. Four decades of gasoline lead emissions and control policies in Europe. Science of the Total Environment. 2003;311(1-3):151-176.
- Sonke JE, Hoogewerff JA, Van der Laan SR. A chemical and mineralogical reconstruction of Znsmelter emissions in the Campine region, Belgium. Science of the Total Environment. 2002;292(1-2):101119.