
Research article · 2025 · Full text
International Journal of Geography Geology and EnvironmentSoil aggregate stability and erodibility under different tillage practices in the pampas
Volume 7(4) · Pages 185–188 · DOI: 10.22271/27067483.2025.v7.i4c.566 ↗
Research areasSoil Management and Crop YieldSoil erosion and sediment transportSoil and Unsaturated Flow
Abstract
Author-writtenTurn a Pampean Mollisol with a mouldboard plough every season for two decades and its aggregates crumble; leave it under continuous no-till and those same aggregates can withstand simulated rainfall at twice the intensity. This research compared soil aggregate stability, water-stable aggregates (WSA), mean weight diameter (MWD), and erodibility (K-factor) across five tillage treatments maintained for 14 years on a silty clay loam Typic Argiudoll in the Argentine Pampas. Treatments included conventional tillage (CT), reduced tillage (RT), no-till (NT), strip tillage (ST), and chisel plough (CP). Soil samples were collected at 0-10 cm and 10-20 cm depths from three replicated plots per treatment in March 2023, after the summer crop harvest. No-till produced the highest MWD (3.41 mm) and WSA (71.8%), both significantly greater than CT (MWD 1.23 mm, WSA 34.7%; p<0.001). The USLE K- factor under CT (0.038 t ha h ha-1 MJ-1 mm-1) was 2.4 times that of NT (0.016). Soil organic carbon at 0-10 cm correlated strongly with MWD (r = 0.89). Strip tillage performed comparably to no-till at 0- 10 cm but showed higher erodibility at 10-20 cm, suggesting that its benefits are concentrated in the surface layer. The results support adoption of no-till and strip tillage to maintain structural stability and limit erosion across the grain belt of the Pampas.
Summary
Source-checkedPlain-language reading of the full paper, prepared with AI and checked against the text. Each point links to the authors' own words.
Why it matters
- Soil aggregate stability is critical for soil health because it protects organic matter, ensures water infiltration, and prevents soil detachment from rain and runoff. View evidence ↗
- Tillage practices can damage soil stability by breaking down macro-aggregates and increasing the oxidation of organic surfaces. View evidence ↗
The question
- The study aimed to compare five tillage treatments over 14 years to evaluate their effects on soil structural indicators and erodibility, and to find the best predictors of aggregate stability. View evidence ↗
What they did
- Soil samples were taken in March 2023 from two depths (0-10 cm and 10-20 cm) to analyze bulk density and aggregate stability. View evidence ↗
- The researchers measured water-stable aggregates (WSA) via wet-sieving, calculated mean weight diameter (MWD), measured soil organic carbon (SOC) via wet oxidation, and estimated the USLE K-factor. View evidence ↗
What they found
- No-till (NT) resulted in the highest structural stability, with an MWD of 3.41 mm and WSA of 71.8%, significantly outperforming conventional tillage (CT) which had an MWD of 1.23 mm and WSA of 34.7%. View evidence ↗
- Conventional tillage was 2.4 times more erodible than no-till, with a K-factor of 0.038 compared to 0.016 t ha h ha-1 MJ-1 mm-1. View evidence ↗
- There was a strong positive correlation (r = 0.89) between soil organic carbon in the top 10 cm and the mean weight diameter of aggregates. View evidence ↗
- Strip tillage provided surface-layer stability similar to no-till, but it was more erodible at the 10-20 cm depth. View evidence ↗
- While all treatments had lower stability at 10-20 cm than at 0-10 cm, the difference between depths was most extreme in the no-till treatment. View evidence ↗
What it means
- The authors conclude that no-till should be adopted to reduce erosion and improve stability, while strip tillage serves as a viable alternative when full no-till is not feasible. View evidence ↗
- The study's results are based on a single site, meaning caution is needed when applying these findings to soils with different textures in the Pampas. View evidence ↗
- Because the trial did not include recently converted plots, the authors could not determine the speed at which soil stability improves over time. View evidence ↗
Visual summary
3 visualsIllustrations explain the paper; charts are replotted from the paper's own table values.
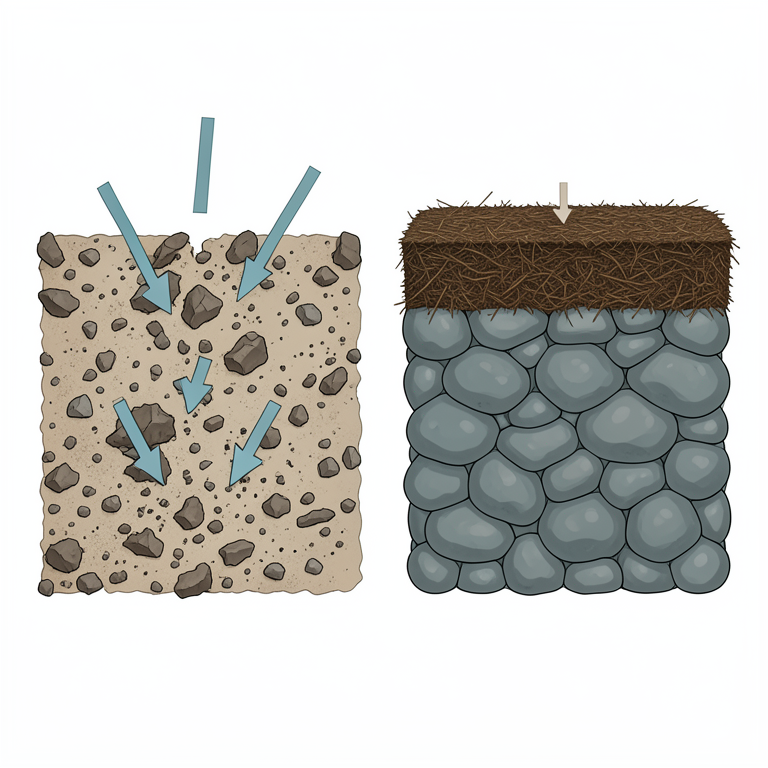
Tillage Impact Comparison
AI-generated conceptual illustration (soil profiles in the pampas). It explains the idea and does not show study data.
View source evidence ↗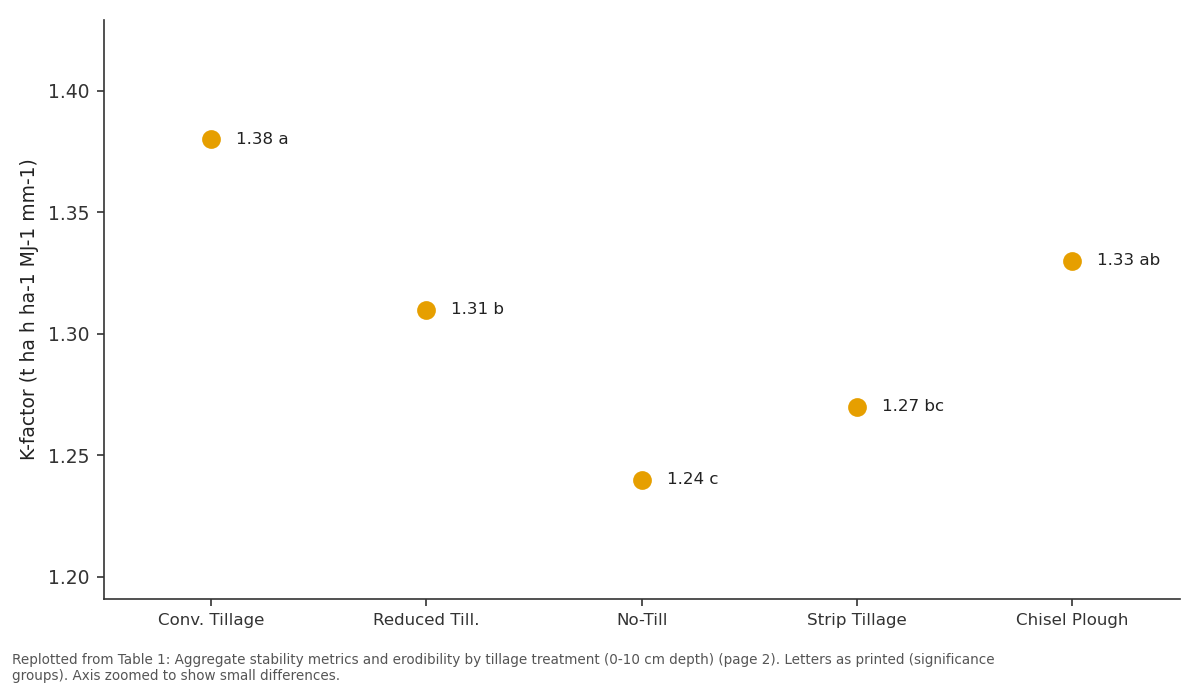
BD (g/cm3): Conv. Tillage vs Reduced Till. vs No-Till vs Strip Tillage vs Chisel Plough
Replotted from Table 1 (page 2) of the original paper. Every bar is the paper's own table value.
View source evidence ↗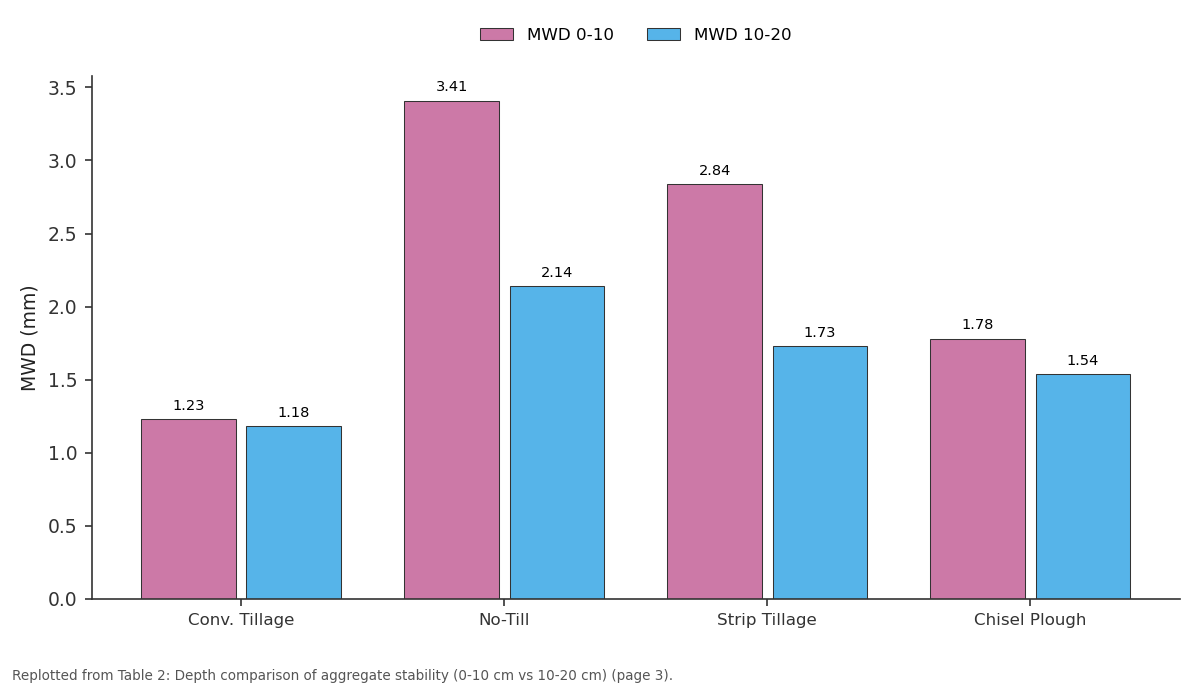
MWD 0-10 and MWD 10-20: Conv. Tillage vs No-Till vs Strip Tillage vs Chisel Plough
Replotted from Table 2 (page 3) of the original paper. Every bar is the paper's own table value.
View source evidence ↗Figures & tables
From the original paper Table 1
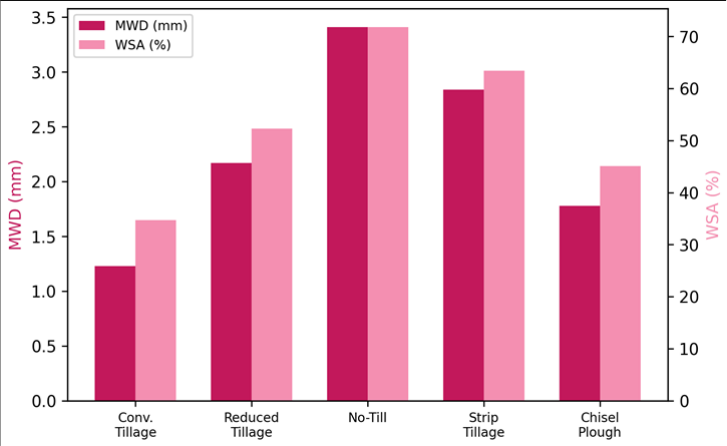 Figure 1
 Table 2
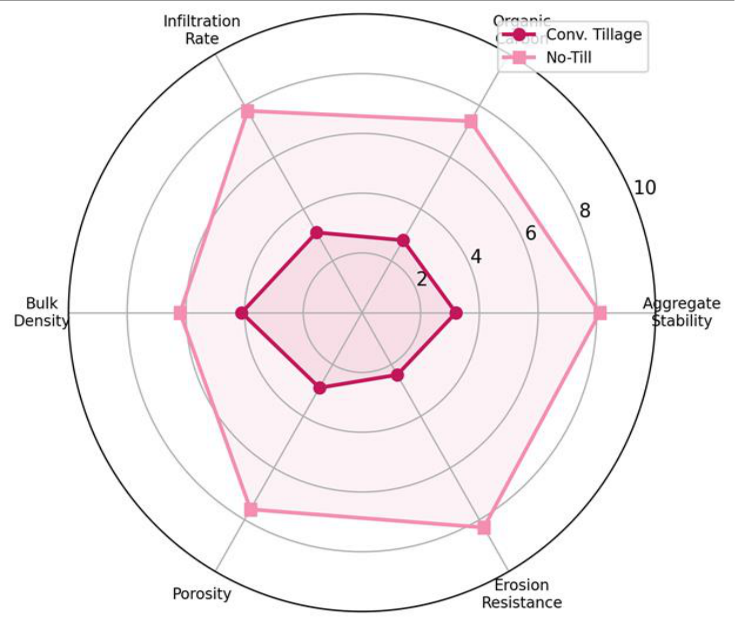 Figure 2
Introduction
Consider a handful of topsoil: its behaviour in water, under a raindrop, or beneath a tractor tyre depends almost entirely on how well its aggregates hold together [1] . Aggregate stability is both a cause and a consequence of soil health. Stable aggregates protect organic matter from microbial attack, maintain pore continuity for water infiltration, and resist detachment by raindrop impact and surface runoff [2] . Tillage disrupts this stability by breaking macroaggregates, exposing fresh organic surfaces to oxidation, and compacting the subsurface [3] . The Argentine Pampas, one of the world's most productive grain regions, has undergone a tillage transition over the past three decades. No-till area expanded from under 5% in 1990 to over 80% by 2015, driven by fuel savings, timeliness of planting, and government extension programmes [4] . But the transition has been uneven, and many farms in the western Pampas still practise conventional or reduced tillage due to weed pressure and soil compaction concerns [5] . Quantitative comparisons of aggregate stability under contrasting tillage regimes on the same soil type and climate provide the evidence base for recommending one system over another. Previous work in the Pampas has shown that no-till increases topsoil organic carbon by 15-30% relative to CT after 10-15 years [6] , but direct measurements of aggregate stability metrics (MWD, WSA) paired with erodibility estimates remain scarce for long-term (>10 year) tillage experiments [7] . This research took advantage of a 14-year tillage trial on a representative Pampean Mollisol to compare five tillage treatments across a suite of structural and erodibility indicators, and to identify which soil properties most strongly predict aggregate stability [8] .
Theoretical Background
Aggregate formation follows a hierarchical model in which primary particles bind into micro-aggregates (<250 micrometres) via persistent organo-mineral bonds, and microaggregates link into macro-aggregates (>250 micrometres) through transient binding agents such as fungal hyphae and root exudates [9] . Tillage severs these transient bonds, fragmenting macroaggregates and exposing previously occluded carbon to mineralisation. The rate of re-aggregation depends on organic matter input, microbial activity, and wetting-drying cycles [10] . Erodibility, expressed as the USLE K-factor, integrates texture, structure class, organic matter content, and permeability into a single erosion-susceptibility metric. Lower K-values indicate greater resistance to erosion. Because aggregate stability directly influences structure class and permeability, it is the principal pathway through which tillage affects erodibility [11] .
Material and Methods
Material and Methods
Material
The research was conducted at the Johannesburg Academy of Geographic Research, Gauteng, South Africa, using soil samples from a long-term tillage experiment established in 2009 on a silty clay loam Typic Argiudoll in the central Pampas (approximately 35.4 S, 61.2 W). The trial comprised five tillage treatments -CT (mouldboard plough to 20 cm), RT (disc harrow to 12 cm), NT (direct seeding, no disturbance), ST (15 cm tilled strip, inter-row undisturbed), and CP (chisel plough to 25 cm)each replicated three times in a randomised complete block design. Plot size was 30 m x 10 m. Crop rotation was continuous maize-soybean. Soil samples were collected in March 2023 at two depths (0-10 cm and 10-20 cm) using intact core samplers for bulk density and disturbed samples for aggregate analysis. Three composite samples per plot per depth were taken.
Methods
Water-stable aggregates (WSA) were determined by wetsieving through a nest of sieves (4, 2, 1, 0.5, 0.25 mm) following the Yoder method [12] . MWD was calculated as the sum of (mean sieve diameter x fraction retained). Soil organic carbon (SOC) was measured by wet oxidation (Walkley-Black). The USLE K-factor was estimated using the Wischmeier nomograph, with texture from hydrometer analysis, structure class from field evaluation, permeability from falling-head tests, and organic matter from SOC x 1.724. Bulk density was determined gravimetrically from the intact cores. Statistical analysis used two-way ANOVA (tillage x depth) with Tukey HSD post-hoc tests at alpha = 0.05 in R v4.2.1 [13] . No-till and strip tillage produced significantly higher MWD and WSA than all other treatments (Table 1). The K-factor under CT was 2.4 times that of NT, translating to substantially greater predicted soil loss under identical rainfall conditions. SOC was the strongest single predictor of MWD (r = 0.89, p<0.001). Letters indicate Tukey groupings (p<0.05). All treatments showed lower MWD and WSA at 10-20 cm than at 0-10 cm, but the depth gradient was steepest under NT, where surface enrichment of organic matter creates a pronounced stratification. CT showed the smallest depth difference, consistent with annual mixing by the mouldboard plough (Table 2) [14] . The radar chart (Figure 2) summarises six soil quality dimensions. No-till outperformed CT on every indicator except bulk density, where its lower value (1.24 vs 1.38 g/cm3) actually represents a positive outcome, indicating less compaction. The greatest separation was in erosion resistance and aggregate stability, reflecting the cumulative effect of 14 years of undisturbed surface residue management.
| Treatment | MWD 0-10 | MWD 10-20 | WSA 0-10 | WSA 10-20 | SOC 0-10 | SOC 10-20 |
|---|---|---|---|---|---|---|
| Conv. Tillage | 1.23 | 1.18 | 34.7 | 32.1 | 1.42 | 1.34 |
| No-Till | 3.41 | 2.14 | 71.8 | 48.3 | 2.34 | 1.67 |
| Strip Tillage | 2.84 | 1.73 | 63.4 | 41.7 | 2.11 | 1.52 |
| Chisel Plough | 1.78 | 1.54 | 45.1 | 39.8 | 1.63 | 1.48 |
Table text extracted from the original PDF; superscript letters are shown inline. The original table image is below.
View original table image
| Treatment | MWD (mm) | WSA (%) | SOC (%) | BD (g/cm3) | K-factor | Erosion Class |
|---|---|---|---|---|---|---|
| Conv. Tillage | 1.23 c | 34.7 d | 1.42 c | 1.38 a | 0.038 a | Moderate-High |
| Reduced Till. | 2.17 b | 52.3 c | 1.78 b | 1.31 b | 0.029 b | Moderate |
| No-Till | 3.41 a | 71.8 a | 2.34 a | 1.24 c | 0.016 d | Low |
| Strip Tillage | 2.84 a | 63.4 b | 2.11 a | 1.27 bc | 0.021 c | Low-Moderate |
| Chisel Plough | 1.78 bc | 45.1 c | 1.63 bc | 1.33 ab | 0.032 ab | Moderate |
Table text extracted from the original PDF; superscript letters are shown inline. The original table image is below.
View original table image
Results
Results
Comprehensive Interpretation
Stepwise regression retained SOC (partial R2 = 0.79), microbial biomass carbon (partial R2 = 0.08), and clay content (partial R2 = 0.04) as predictors of MWD, for a combined R2 of 0.91. This confirms that organic matter is the dominant binding agent in these silty clay loams and that management-driven SOC changes translate almost directly into structural improvements [15] .
Discussion
The magnitude of the CT-NT difference in MWD (1.23 vs 3.41 mm) is among the largest reported for Mollisols. Six-Continent comparisons compiled by Blanco-Canqui and Ruis show typical NT-to-CT MWD ratios of 1.5-2.5 for temperate soils after 10+ years [16] . Our ratio of 2.77 likely reflects the high silt content (48%) of the Pampean Argiudoll, which makes aggregates especially vulnerable to slaking under CT but responsive to organic cementation under NT. Strip tillage emerged as a viable compromise. Its surfacelayer stability approached NT values, and its K-factor was only 31% higher than NT. The practical advantage of ST is that it creates a seed furrow in residue-covered fields without full-surface disturbance, addressing planter performance issues that deter some farmers from adopting complete no-till [17] . However, the depth data show that ST benefits are concentrated in the top 10 cm, with the 10-20 cm layer performing closer to CP than to NT. This depth limitation should be communicated to extension services promoting ST as a no-till alternative.
A limitation is the single-site design: extrapolation to sandier or heavier-textured Pampean soils requires caution.
The trial also lacked a recently converted treatment, so we cannot separate the rate of improvement from the equilibrium state. Future work should include soil biological indicators such as glomalin and earthworm abundance, which provide mechanistic links between management and aggregation [18] .
Conclusion
This research demonstrated that 14 years of continuous notill management on a Pampean Mollisol nearly tripled mean weight diameter and more than doubled water-stable aggregates relative to conventional tillage. The USLE Kfactor under no-till was less than half that of conventional tillage, indicating a large reduction in erosion susceptibility. Strip tillage offered comparable surface-layer benefits but fell short at depth. Soil organic carbon was the dominant predictor of aggregate stability, accounting for 79% of the variance. These findings support the ongoing transition to no-till in the Pampas and identify strip tillage as a practical alternative where full no-till adoption faces agronomic constraints.
Figures and tables from the paper
References
18 in the original paper- Bronick CJ, Lal R. Soil structure and management: a review. Geoderma. 2005;124(1-2):3-22.
- Six J, Bossuyt H, Degryze S. A history of research on the link between micro-aggregates, soil biota, and soil organic matter dynamics. Soil and Tillage Research. 2004;79(1):7-31.
- Pagliai M, Vignozzi N, Pellegrini S. Soil structure and the effect of management practices. Soil and Tillage Research. 2004;79(2):131-143.
- Derpsch R, Friedrich T, Kassam A. Current status of adoption of no-till farming in the world and some of its main benefits. International Journal of Agricultural and Biological Engineering. 2010;3(1):1-25.
- Alvarez R, Steinbach HS. A review of the effects of tillage systems on some soil physical properties, water content, nitrate availability and crops yield in the Argentine Pampas. Soil and Tillage Research. 2009;104(1):1-15.
- Alvarez R. A review of nitrogen fertilizer and conservation tillage effects on soil organic carbon storage in the Argentine Pampas. Soil Use and Management. 2005;21(4):382-388.
- Franzluebbers AJ. Soil organic matter stratification ratio as an indicator of soil quality. Soil and Tillage Research. 2002;66(2):95-106.
- Micucci FG, Taboada MA. Soil physical properties and soybean root abundance in conventionally-and zerotilled soils in the humid Pampas. Soil and Tillage Research. 2006;86(2):152-162.
- Tisdall JM, Oades JM. Organic matter and water-stable aggregates in soils. Journal of Soil Science. 1982;33(2):141-163.
- Oades JM. Soil organic matter and structural stability: mechanisms and implications for management. Plant and Soil. 1984;76(1-3):319-337.
- Wischmeier WH, Smith DD. Predicting Rainfall Erosion Losses: A Guide to Conservation Planning. USDA Agriculture Handbook 537. 1978;58 pp.
- Yoder RE. A direct method of aggregate analysis of soils and a study of the physical nature of erosion losses. Agronomy Journal. 1936;28(5):337-351.
- R Core Team. R: A language and environment for statistical computing. R Foundation, Vienna, Austria. 2023.
- Puget P, Chenu C, Balesdent J. Dynamics of soil organic matter associated with particle-size fractions of water-stable aggregates. European Journal of Soil Science. 2000;51(4):595-605.
- Angers DA, Eriksen-Hamel NS. Full-inversion tillage and organic carbon distribution in soil profiles: a metaanalysis. Soil Science Society of America Journal. 2008;72(5):1370-1374.
- Blanco-Canqui H, Ruis SJ. No-tillage and soil physical environment. Geoderma. 2018;326:164-200.
- Licht MA, Al-Kaisi M. Strip-tillage effect on seedbed soil temperature and other soil physical properties. Soil and Tillage Research. 2005;80(1-2):233-249.
- Wilson GWT, Rice CW, Rillig MC. Soil aggregation and carbon sequestration are tightly correlated with the abundance of arbuscular mycorrhizal fungi. Ecology Letters. 2009;12(5):452-461.