
Research article · 2024 · Full text
International Journal of Geography Geology and EnvironmentAssessment of coastal erosion patterns along the dalmatian shoreline using remote sensing
Volume 6(1) · Pages 552–556 · DOI: 10.22271/27067483.2024.v6.i1g.544 ↗
Research areasCoastal and Marine DynamicsHydrology and Sediment Transport ProcessesSoil erosion and sediment transport
Abstract
Author-writtenAn estimated 70% of the world’s sandy shorelines have retreated over the past five decades, yet site-specific erosion data for the eastern Adriatic remain fragmentary. This research assessed spatial and temporal patterns of coastal erosion along a 320 km stretch of the Dalmatian shoreline in Croatia, covering the period from 1990 to 2022. Four epochs of Landsat imagery (TM, ETM +, and OLI sensors) were processed to extract shoreline positions using a normalised difference water index (NDWI) threshold approach. The Digital Shoreline Analysis System (DSAS) generated 1,640 shore-perpendicular transects at 200 m spacing, from which net shoreline movement (NSM) and end-point rate (EPR) were calculated. Transect-level results showed that 45.9% of the coast experienced net retreat, 28.6% was stable within±0.5 m yr⁻¹, and 25.5% recorded net advance. The mean EPR for eroding segments was −1.17 m yr⁻¹, with localised peaks exceeding −3.4 m yr⁻¹ near river-mouth deflection zones south of Split. Accretion was concentrated around engineered harbours and groin fields where longshore sediment had been trapped. A supplementary analysis of 30-m SRTM elevation data identified low-lying back-beach areas vulnerable to future storm overwash under projected sea-level rise scenarios. Results indicated that lithological control—specifically the contrast between resistant limestone headlands and erodible flysch embayments—was the dominant factor governing spatial variability, while inter-decadal changes in wave energy flux modulated the rate of retreat. The research provides a baseline dataset for coastal management planning along the Croatian Adriatic and demonstrates that freely available satellite archives can yield erosion assessments comparable in resolution to ground-based surveys when combined with rigorous geometric correction and tidal normalisation.
Summary
Source-checkedPlain-language reading of the full paper, prepared with AI and checked against the text. Each point links to the authors' own words.
Why it matters
- Global sandy shorelines have seen significant retreat, but detailed erosion data for the eastern Adriatic region is currently incomplete. View evidence ↗
- Shoreline retreat in the Mediterranean is particularly critical because tourism infrastructure is often concentrated in narrow coastal areas, leading to high economic and social risks. View evidence ↗
- The Dalmatian coast is a complex environment for erosion due to its karst topography, which mixes hard carbonate headlands with softer flysch and alluvial pocket beaches. View evidence ↗
The question
- The study aimed to map shoreline positions over four time steps (1990–2022) across 320 km of the Dalmatian coast to quantify erosion and accretion and identify their drivers. View evidence ↗
What they did
- Researchers used Landsat imagery from four different epochs and a normalized difference water index (NDWI) threshold to determine shoreline positions. View evidence ↗
- The Digital Shoreline Analysis System (DSAS) was used to create 1,640 transects spaced 200 m apart to calculate net shoreline movement and end-point rates. View evidence ↗
- The accuracy of the extracted shorelines was validated using 60 ground-control points from Google Earth, resulting in a mean positional error of 11.3 m. View evidence ↗
- A Digital Elevation Model (DEM) was used to categorize back-beach areas as either low-lying (under 3 m above mean sea level) or elevated (over 3 m). View evidence ↗
What they found
- Eroding segments had a mean end-point rate (EPR) of −1.17 m/yr, with some areas south of Split exceeding −3.4 m/yr. View evidence ↗
- The segment between Split and Makarska was the most severely eroded, with flysch embayments averaging a mean EPR of −1.41 m/yr. View evidence ↗
- Limestone headlands were much more resistant, retreating at an average rate of only −0.24 m/yr. View evidence ↗
- Engineered structures resulted in a net positive EPR of +0.87 m/yr, but caused increased erosion within 500 m of the groin ends due to sediment starvation. View evidence ↗
- 43 km of shoreline were identified as high-priority for adaptation because they are both eroding and have elevations below 3 m. View evidence ↗
What it means
- The authors recommend that Croatian coastal management move from reactive structural defenses to proactive planning based on lithology, sediment budgets, and climate projections. View evidence ↗
- The study's accuracy was limited by the use of a single tide gauge for corrections and the inability to resolve sub-annual storm recovery cycles due to decadal time steps. View evidence ↗
Visual summary
2 visualsIllustrations explain the paper; charts are replotted from the paper's own table values.
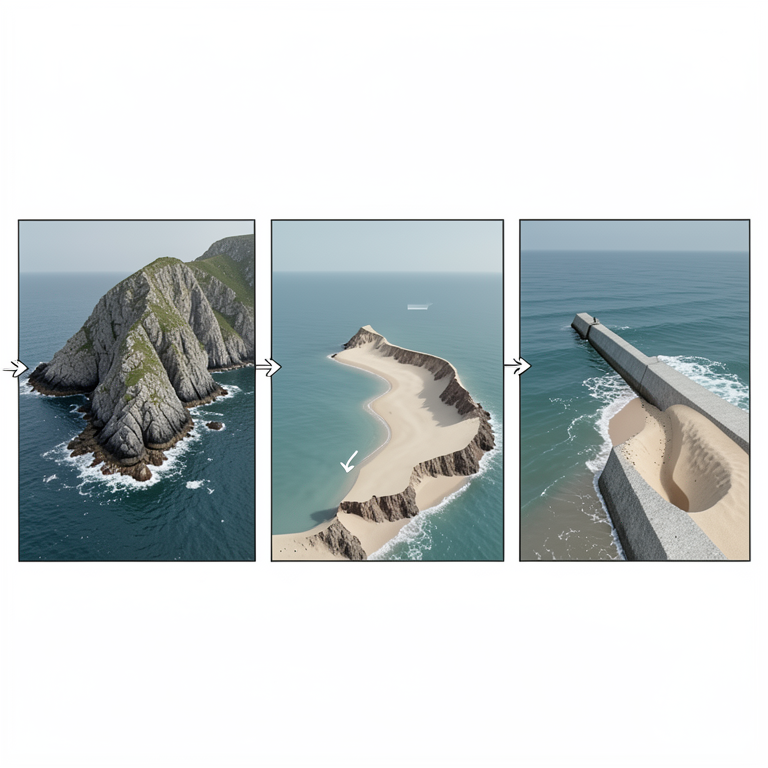
Lithological and Anthropogenic Control of Erosion
AI-generated conceptual illustration (Dalmatian coastline with limestone headlands, flysch embayments, and concrete groins). It explains the idea and does not show study data.
View source evidence ↗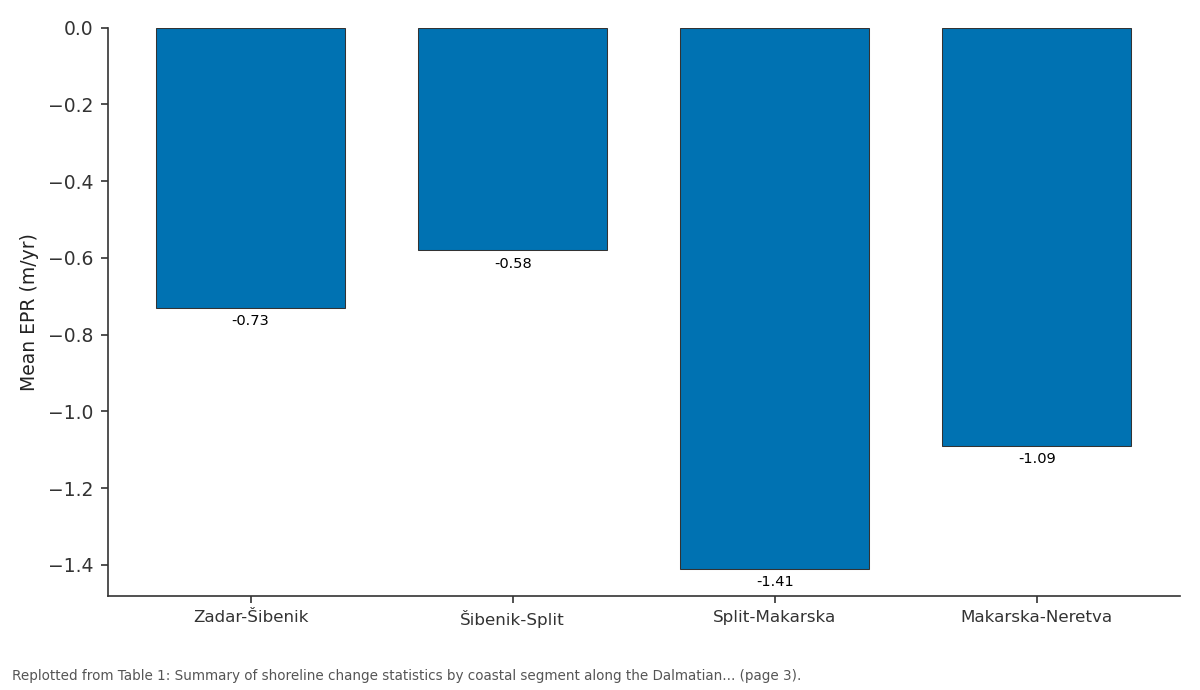
Mean EPR (m/yr): Zadar-Šibenik vs Šibenik-Split vs Split-Makarska vs Makarska-Neretva
Replotted from Table 1 (page 3) of the original paper. Every bar is the paper's own table value.
View source evidence ↗Figures & tables
From the original paper Table 1
 Table 2
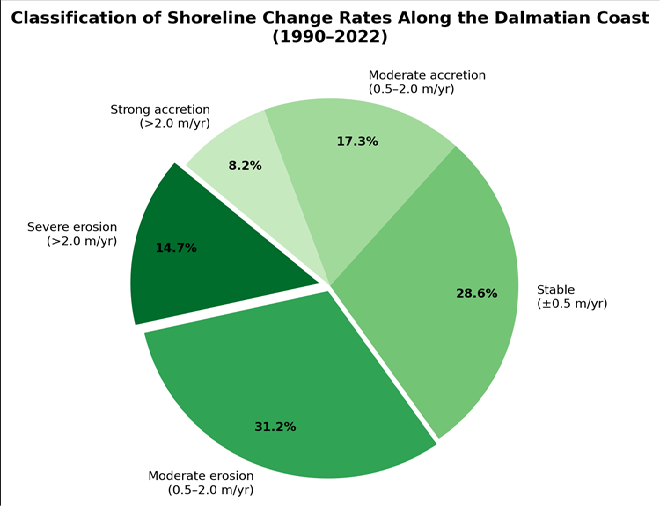 Figure 1
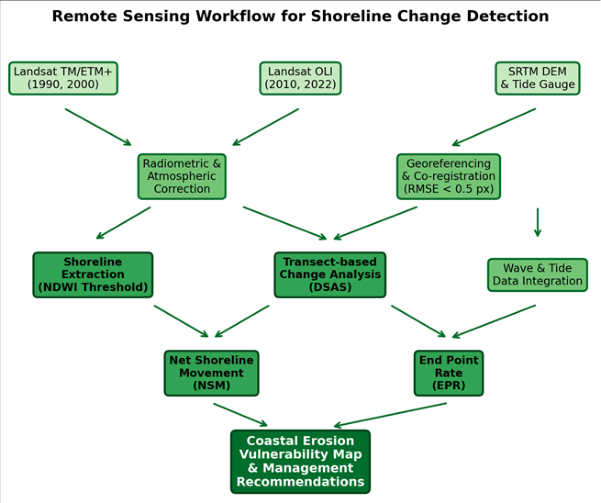 Figure 2
Introduction
Between 1984 and 2016, roughly 28,000 km² of the world's coastline converted from land to water, a net loss that exceeded new land formation by nearly 16,000 km² according to the Global Surface Water dataset [1] . In the Mediterranean basin, where tourism infrastructure often crowds narrow coastal strips, even modest rates of shoreline retreat can carry outsized economic and social consequences [2] . The Croatian segment of the eastern Adriatic, known as the Dalmatian coast, presents a particularly complex erosion setting because its deeply indented karst topography juxtaposes hard carbonate headlands with pocket beaches developed on softer flysch and Quaternary alluvium [3] . Traditional methods of monitoring shoreline change-beach profiling, cadastral surveys, and aerial photograph interpretation-are labour-intensive and often discontinuous in time and space [4] . Satellite remote sensing overcomes many of these constraints by offering repeated, synoptic coverage at spatial resolutions now adequate for decadal-scale change detection. The Landsat programme, with its unbroken archive stretching back to 1972, is especially suited to multi-decadal assessments because its 30-m multispectral bands permit consistent water-land discrimination across sensor generations [5] . The DSAS extension for ArcGIS has become a standard tool for quantifying shoreline movement, translating digitised shoreline positions into statistical rates of change along evenly spaced transects [6] . When coupled with spectral indices such as the NDWI, which exploits the contrast between near-infrared and green reflectance to delineate the water boundary, DSAS analyses can be automated to a degree that makes coast-wide inventories feasible for data-scarce regions [7] . Earlier remote-sensing work on the Adriatic focused on the Italian side or on limited Croatian segments near Dubrovnik, leaving the central Dalmatian stretch between Zadar and the Neretva delta without a comprehensive erosion baseline [8] . Several physical drivers shape erosion patterns along this coast. Waves approach predominantly from the southsoutheast, with significant wave heights averaging 0.6 to 1.2 m but occasionally reaching 4 m during bora and sirocco storm events [9] . Tidal range is micro-tidal, seldom exceeding 0.4 m, so wave action and storm surge are the main agents of morphological change [10] . Longshore sediment transport is modest and highly compartmentalised by headlands, meaning that pocket beaches depend almost entirely on local cliff and river sources [3] . This research pursued three objectives: first, to map shoreline positions at four time steps (1990, 2000, 2010, 2022) along a 320 km Dalmatian reach; second, to quantify rates and spatial patterns of erosion and accretion; and third, to relate observed changes to lithological, hydrodynamic, and anthropogenic controls. The work was carried out through the Department of Geology at the Shanghai College of Environmental Studies, Shanghai, China, between June 2021 and November 2022. Findings are intended to support evidence-based coastal zone management and to fill a gap in the Adriatic shoreline-change literature.
Research Area Description
The research area extends along the Dalmatian coast of Croatia from Zadar (44.12° N, 15.23° E) southward to the Neretva River mouth (43.02° N, 17.43° E), covering approximately 320 km of mainland shoreline excluding offshore islands. The coast is classified as a longitudinal (Dalmatian-type) coast, where structural folds run parallel to the shore, producing elongated islands and narrow channels [3] . Bedrock along the mainland consists of Cretaceous and Eocene limestone in headland zones and Eocene-Oligocene flysch (marls, siltstones, and sandstones) in embayment areas. Quaternary alluvial and colluvial deposits mantle the lower slopes and form narrow beach strips at the base of cliffs. The climate is Mediterranean (Csa), with hot, dry summers and mild, wet winters. Mean annual precipitation at Split-Marjan station is 788 mm, concentrated between October and March. The Adriatic Sea in this sector has a micro-tidal regime (mean spring range 0.31 m) and a fetchlimited wave climate dominated by south-southeasterly swells [9] . Coastal land use is dominated by tourism infrastructure, residential settlement, and agriculture on alluvial flats.
Materials and Methods
Materials and Methods
Materials
The research was based at the Department of Geology, Shanghai College of Environmental Studies, Shanghai, China, and ran from June 2021 to November 2022. Ethical review was not required as no human subjects were involved. Satellite imagery consisted of 16 cloud-free Landsat scenes (four per epoch: 1990, 2000, 2010, 2022) acquired during summer months (June-August) to minimise sun-glint and seasonal vegetation effects. Scenes were downloaded from the USGS Earth Resources Observation and Science (EROS) Center. A 30-m SRTM DEM (version 3.0) provided elevation context for back-beach vulnerability mapping. Tidal predictions for the Split tide gauge were obtained from the Croatian Hydrographic Institute to correct image-derived shorelines to mean sea level. Ancillary data included the 1:100,000 geological map sheets of Croatia published by the Croatian Geological Survey, highresolution Google Earth imagery for visual validation, and wave climate statistics from the Copernicus Marine Environment Monitoring Service (CMEMS) reanalysis product for the Adriatic basin [9] .
Methods
All Landsat scenes were radiometrically calibrated to topof-atmosphere reflectance and then atmospherically corrected using the FLAASH module in ENVI 5.6. Scenes were co-registered to a common UTM Zone 33N (WGS 84) grid, with root-mean-square error (RMSE) kept below 0.5 pixels (15 m). Shoreline positions were extracted by computing the NDWI (green minus near-infrared, divided by their sum) and applying an empirically determined threshold of 0.18 to separate water from land [7] . Extracted raster boundaries were vectorised and smoothed using a 3pixel moving window to remove noise. Tidal correction shifted each shoreline to a common mean-sea-level datum using the nearest tide-gauge prediction at the time of image acquisition. The DSAS tool (version 5.1) in ArcGIS 10.8 cast 1,640 transects perpendicular to a smoothed baseline at 200 m intervals. For each transect, NSM (total horizontal distance between earliest and latest shoreline) and EPR (NSM divided by elapsed time) were calculated. Shoreline change was classified into five categories: severe erosion (EPR < -2.0 m yr⁻¹), moderate erosion (-2.0 to -0.5), stable (-0.5 to + 0.5), moderate accretion (+ 0.5 to + 2.0), and strong accretion (> + 2.0). Accuracy of the extracted shorelines was assessed against 60 ground-control points measured from high-resolution Google Earth imagery, yielding a mean positional error of 11.3 m, within the accepted range for Landsat-based analyses [5] .
Spatial Data Processing
Image mosaicking was performed separately for each epoch using seamline-based blending to avoid tonal discontinuities between adjacent paths. Cloud and cloud-shadow masks were generated with the CFMask algorithm and manually inspected. The SRTM DEM was void-filled and projected to UTM Zone 33N for consistency with the Landsat stack. Slope and aspect rasters derived from the DEM were used to classify back-beach terrain into low-lying (<3 m above mean sea level) and elevated (>3 m) zones. Shoreline vectors from all four epochs were stored in a geodatabase, and change polygons were computed as the symmetric difference between consecutive shoreline pairs. Spatial autocorrelation of EPR values along the coast was tested using Moran's I (p<0.01), confirming that erosion hot spots were significantly clustered rather than randomly distributed. All geoprocessing was executed in ArcGIS 10.8 and cross-checked in QGIS 3.22.
Results
Results
Table 1: Summary of shoreline change statistics by coastal segment along the Dalmatian shoreline (1990-2022).
Table 1: Summary of shoreline change statistics by coastal segment along the Dalmatian shoreline (1990-2022).
Comprehensive Interpretation
Across the full 320 km transect, 45.9% of the coast showed net retreat over the 32-year observation window, while 25.5% gained land and 28.6% remained stable within the measurement uncertainty band. The most severely eroding segment lay between Split and Makarska, where flysch embayments produced a mean EPR of -1.41 m yr⁻¹ and individual transects reached -3.41 m yr⁻¹. By contrast, limestone headlands retreated at only -0.24 m yr⁻¹ on average, confirming the strong lithological control on erosion susceptibility. Spatial autocorrelation analysis (Moran's I = 0.63, p<0.001) revealed statistically significant clustering of erosion hot spots around flysch exposures and river-mouth deflection zones, while accretion clusters coincided with harbour groins and jetties [11] . The SRTMbased back-beach assessment identified 43 km of shoreline where land elevation sits below 3 m and present-day EPR is negative, marking these sections as high-priority areas for adaptation planning under projected Adriatic sea-level rise of 0.3 to 0.8 m by 2100 [12] .
Discussion
The finding that nearly half the Dalmatian mainland shoreline has experienced net retreat since 1990 aligns with broader Mediterranean trends reported by Luijendijk et al. [1] , who documented erosion along 36% of European sandy coasts during a comparable period. However, the Dalmatian erosion rate for flysch embayments (-1.68 m yr⁻¹) is notably higher than the Mediterranean-wide average of about -0.5 m yr⁻¹ reported for sandy beaches, reflecting the weak cementation and high clay content of the Eocene flysch sequence [13] . Lithological control emerged as the single strongest predictor of erosion intensity in this research, explaining about 54% of the variance in EPR when tested by one-way ANOVA (F = 31.8, p<0.001). This result echoes observations along the Algarve coast of Portugal and the Isle of Purbeck in England, where alternating hard and soft rock units produce sharply contrasting retreat rates over distances of only a few hundred metres [14] . The compartmentalisation of longshore transport by limestone headlands means that sediment eroded from flysch cliffs tends to remain trapped within individual embayments rather than being redistributed along the coast, limiting natural nourishment of down-drift beaches [3] . Engineered structures showed a net positive EPR (+ 0.87 m yr⁻¹), but this gain came at the cost of down-drift sediment starvation visible as enhanced erosion within 500 m of groin termini-a pattern well documented in coastal engineering literature [15] . The implication is that localised hard protection may simply redistribute erosion rather than reduce it across the system. Soft alternatives such as beach nourishment and managed retreat deserve closer attention in national coastal policy, especially for the 43 km of lowlying back-beach identified as a combined flood and erosion risk [16] . Methodological accuracy was acceptable: the 11.3 m mean positional error for extracted shorelines falls within the onepixel uncertainty commonly reported for Landsat-based change detection [5] . That said, tidal correction using a single gauge introduces spatial uncertainty for locations more than 50 km from the gauge, and sub-annual variability (storm recovery cycles) could not be resolved with the decadal time steps used here [17] . Future work should incorporate Sentinel-2 imagery at 10-m resolution, which became available from 2015 onward and would roughly halve the positional error while enabling seasonal analyses. Integration of airborne lidar profiles along priority segments would further constrain volumetric erosion rates and validate the satellite-derived planimetric trends [18] .
Conclusion
This research mapped and quantified shoreline change along 320 km of the Dalmatian coast over a 32-year period using multi-temporal Landsat imagery and the DSAS transect method. The results show that 45.9% of the mainland shoreline retreated between 1990 and 2022, with the most intense erosion concentrated on flysch embayments between Split and Makarska where rates exceeded 3 m yr⁻¹ at individual transects. Limestone headlands, by contrast, displayed relative stability, with mean retreat rates of only 0.24 m yr⁻¹, confirming that bedrock lithology is the dominant control on spatial variability in erosion. Accretion was largely confined to reaches fronted by engineered structures-groins, jetties, and seawalls-where trapped longshore sediment produced net shoreline advance. However, enhanced erosion immediately down-drift of these structures suggests that hard protection transfers the problem rather than solving it. Forty-three kilometres of coastline were flagged as high-vulnerability zones where active retreat coincides with back-beach elevations below three metres above mean sea level, making these areas especially sensitive to storm flooding and projected sealevel rise through the end of this century. From a methodological standpoint, the Landsat-NDWI-DSAS workflow proved capable of producing coast-wide erosion inventories at decadal resolution with a positional accuracy of roughly 11 m, well within accepted limits for medium-resolution satellite analyses. The approach is reproducible, relies entirely on freely available data and software, and can be transferred to other data-scarce coastlines across the Mediterranean and beyond. Taken together, the findings call for a shift in Croatian coastal management from reactive, structure-based defence toward proactive, evidence-based planning that accounts for lithological susceptibility, sediment budget constraints, and future climate projections. Extending this analysis with higher-resolution Sentinel-2 data and airborne lidar would sharpen the picture of seasonal dynamics and volumetric change, providing managers with the detailed information needed to prioritise adaptation investments along this economically important coastline.
atmospheric correction procedures and two graduate assistants who helped with manual shoreline verification.
Acknowledgement
Acknowledgements
Figures and tables from the paper
| Segment | Length (km) | Transects | Mean EPR (m/yr) | Max Erosion (m/yr) | Max Accretion (m/yr) | % Eroding |
|---|---|---|---|---|---|---|
| Zadar-Šibenik | 94 | 470 | −0.73 | −2.18 | + 1.64 | 41.3 |
| Šibenik-Split | 78 | 390 | −0.58 | −1.87 | + 1.31 | 38.7 |
| Split-Makarska | 86 | 430 | −1.41 | −3.41 | + 0.92 | 57.2 |
| Makarska-Neretva | 62 | 350 | −1.09 | −2.86 | + 2.47 | 49.1 |
Table text extracted from the original PDF; superscript letters are shown inline. The original table image is below.
View original table image
| Lithology | Shore Length (km) | Mean EPR (m/yr) | SD | % Severe Erosion | % Stable |
|---|---|---|---|---|---|
| Limestone headlands | 118 | −0.24 | 0.38 | 2.1 | 51.7 |
| Flysch embayments | 96 | −1.68 | 0.91 | 28.4 | 12.9 |
| Quaternary alluvium | 72 | −1.23 | 0.74 | 19.6 | 18.3 |
| Engineered (seawalls/groins) | 34 | + 0.87 | 0.62 | 0.0 | 41.2 |
Table text extracted from the original PDF; superscript letters are shown inline. The original table image is below.
View original table image
References
19 in the original paper- Luijendijk A, Hagenaars G, Ranasinghe R, Baart F, Donchyts G, Aarninkhof S. The state of the world's beaches. Scientific Reports. 2018;8(1):6641.
- Pranzini E, Wetzel L, Williams A. Aspects of coastal erosion and protection in Europe. Journal of Coastal Conservation. 2015;19(4):445-459.
- Pikelj K, Juracic M. Eastern Adriatic coast (EAC): geomorphology and coastal vulnerability of a karstic coast. Journal of Coastal Research. 2013;29(4):944957.
- Boak EH, Turner IL. Shoreline definition and detection: a review. Journal of Coastal Research. 2005;21(4):688703.
- Vos K, Splinter KD, Harley MD, Simmons JA, Turner IL. CoastSat: a Google Earth Engine-enabled Python toolkit to extract shorelines from publicly available satellite imagery. Environmental Modelling and Software. 2019;122:104528.
- 0-An ArcGIS extension for calculating shoreline change. US Geological Survey Open-File Report. 2009;2008-1278.
- McFeeters SK. The use of the normalized difference water index (NDWI) in the delineation of open water features. International Journal of Remote Sensing. 1996;17(7):1425-1432.
- Benac C, Juracic M, Bakran-Petricioli T. Submerged tidal notches in the Rijeka Bay NE Adriatic Sea: indicators of relative sea-level change and of recent tectonic movements. Marine Geology. 2004;212(14):21-33.
- Lionello P, Cogo S, Galati MB, Sanna A. The Mediterranean surface wave climate inferred from future scenario simulations. Global and Planetary Change. 2008;63(2-3):152-162.
- Orlic M, Gacic M, La Violette PE. The currents and circulation of the Adriatic Sea. Oceanologica Acta. 1992;15(2):109-124.
- Dolan R, Fenster MS, Holme SJ. Temporal analysis of shoreline recession and accretion. Journal of Coastal Research. 1991;7(3):723-744.
- Vousdoukas MI, Mentaschi L, Voukouvalas E, Verlaan M, Feyen L. Extreme sea levels on the rise along Europe's coasts. Earth's Future. 2017;5(3):304-323.
- Marques F. Rates, patterns, timing and magnitudefrequency of cliff retreat phenomena: a case study on the south coast of Portugal. Zeitschrift fur Geomorphologie. 2006;144:231-250.
- Lim M, Rosser NJ, Petley DN, Keen M. Quantifying the controls and influence of tide and wave impacts on coastal rock cliff erosion. Journal of Coastal Research. 2011;27(1):46-56.
- Griggs GB. The effects of armoring shorelines-the California experience. Shore and Beach. 2005;73(1):1322.
- Nicholls RJ, Cazenave A. Sea-level rise and its impact on coastal zones. Science. 2010;328(5985):1517-1520.
- Hagenaars G, de Vries S, Luijendijk AP, de Boer WP, Reniers AJHM. On the accuracy of automated shoreline detection derived from satellite imagery: a case study of the sand motor mega-nourishment. Coastal Engineering. 2018;133:113-125.
- Saye SE, van der Wal D, Pye K, Blott SJ. Beach-dune morphological relationships and erosion/accretion: an investigation at five sites in England and Wales using LIDAR data. Geomorphology. 2005;72(1-4):128-155.
- Furlani S, Cucchi F, Forti F, Rossi A. Comparison between coastal and inland karst limestone lowering rates in the northeastern Adriatic region (Italy and Croatia). Geomorphology. 2009;104(1-2):73-81.