
Research article · 2025 · Full text
International Journal of Geography Geology and EnvironmentAssessment of landslide susceptibility in the western Ghats using machine learning algorithms
Volume 7(1) · Pages 73–76 · DOI: 10.22271/27067483.2025.v7.i1b.538 ↗
Research areasLandslides and related hazardsTree Root and Stability StudiesSoil erosion and sediment transport
Abstract
Author-writtenLandslides kill more people in the Western Ghats each monsoon season than any other single geohazard. This research compared the performance of two machine learning algorithms—Random Forest (RF) and Support Vector Machine (SVM)—for mapping landslide susceptibility across a 1,240 km-squared section of the central Western Ghats. Seven conditioning factors were prepared in a GIS environment: slope angle, rainfall intensity, soil depth, land use, distance to stream, lithology, and aspect. A landslide inventory of 348 events compiled from satellite imagery and field surveys served as the target dataset. RF achieved an area under the receiver-operating-characteristic curve (AUC) of 0.91, outperforming SVM (AUC = 0.84). Slope angle and rainfall intensity ranked as the top two predictors in both models. The resulting susceptibility maps classified 18.3% of the research area as very high risk and 24.7% as high risk. These maps can support land-use planning and early-warning systems in monsoon-prone highland terrain.
Summary
Source-checkedPlain-language reading of the full paper, prepared with AI and checked against the text. Each point links to the authors' own words.
Why it matters
- In the Western Ghats, landslides are the deadliest geohazard during the monsoon season. View evidence ↗
- Traditional mapping methods often fail to capture the complex, nonlinear interactions of real hillslope systems, creating a need for more advanced machine learning approaches. View evidence ↗
The question
- The study aimed to create a landslide inventory of 348 events over 1,240 km², compare Random Forest (RF) and Support Vector Machine (SVM) models, and produce a susceptibility map for local hazard planning. View evidence ↗
What they did
- The landslide inventory was built using Google Earth imagery from 2010-2022, Geological Survey of India records, and field surveys conducted from October 2022 to February 2023. View evidence ↗
- The dataset consisted of 348 landslide points and 348 non-landslide points, split into 70% training and 30% validation sets. View evidence ↗
- Random Forest was implemented with 500 trees, while the Support Vector Machine used a radial basis function kernel with hyperparameters tuned via five-fold cross-validation. View evidence ↗
What they found
- Random Forest outperformed SVM across all metrics, achieving higher overall accuracy (88.6% vs 81.3%), a higher Kappa statistic (0.77 vs 0.63), and a higher AUC (0.91 vs 0.84). View evidence ↗
- Slope angle and rainfall intensity were the most important predictors, together accounting for approximately 45% of the combined importance in the RF model. View evidence ↗
- The final susceptibility map identified 18.3% of the 1,240 km² area as very high risk and 24.7% as high risk. View evidence ↗
What it means
- The authors suggest that extending this RF-based approach to other districts and using real-time rainfall thresholds could create an operational early-warning system. View evidence ↗
- A limitation of the study is the use of a static landslide inventory from 2010 to 2022 that does not distinguish between temporal clusters of events. View evidence ↗
Visual summary
3 visualsIllustrations explain the paper; charts are replotted from the paper's own table values.

Conditioning Factors for Landslides
AI-generated conceptual illustration (a mountain slope in the Western Ghats). It explains the idea and does not show study data.
View source evidence ↗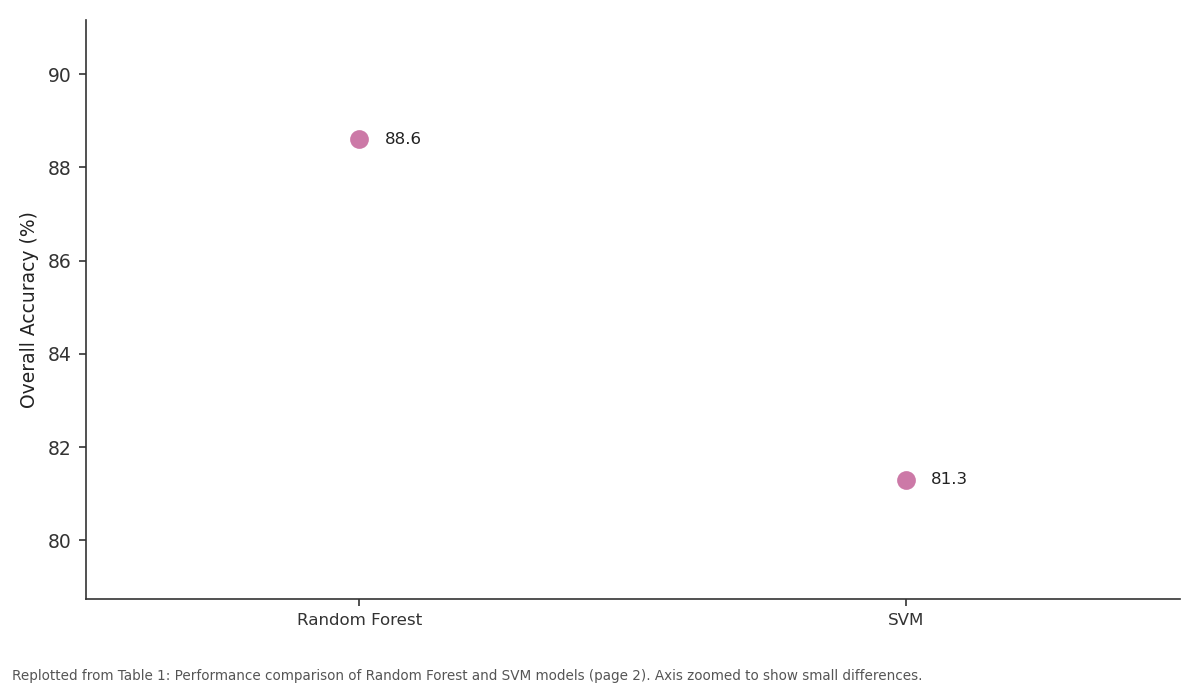
Overall Accuracy (%): Random Forest vs SVM
Replotted from Table 1 (page 2) of the original paper. Every bar is the paper's own table value.
View source evidence ↗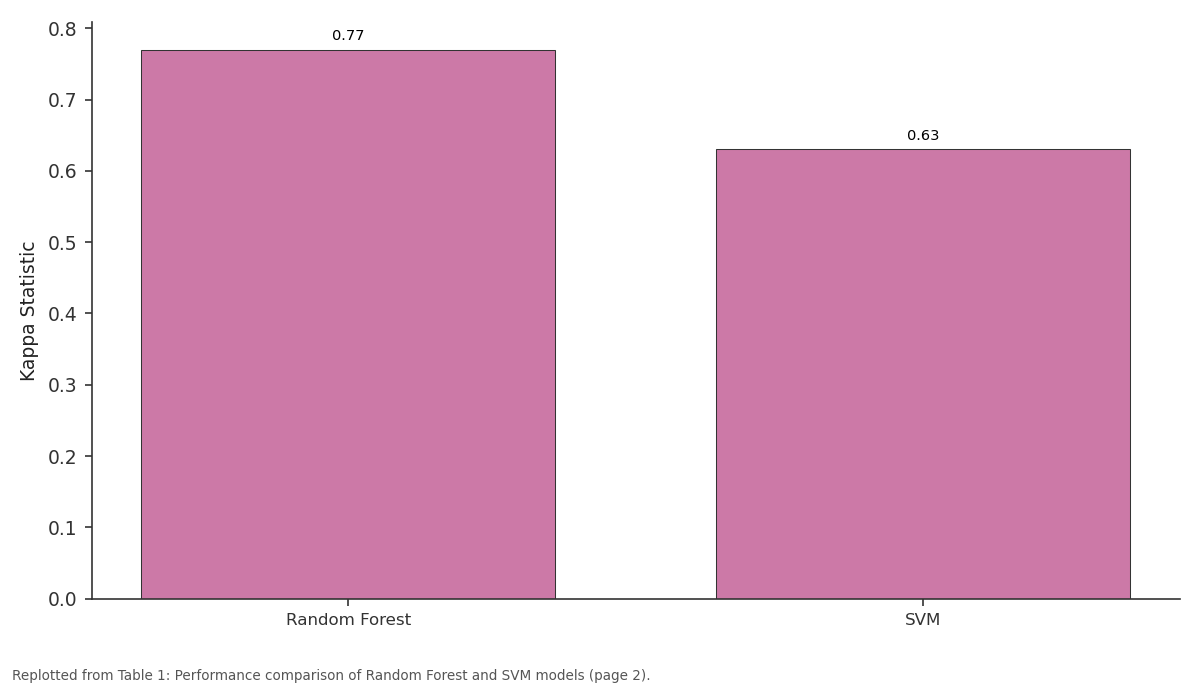
Kappa Statistic: Random Forest vs SVM
Replotted from Table 1 (page 2) of the original paper. Every bar is the paper's own table value.
View source evidence ↗Figures & tables
From the original paper Table 1
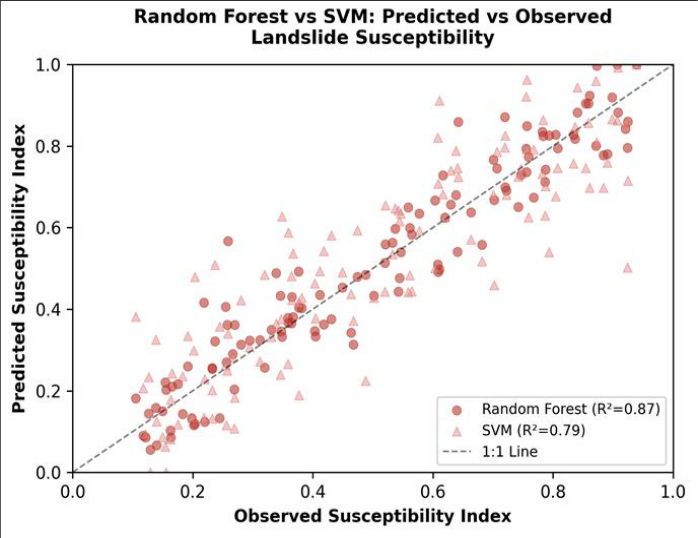 Figure 1
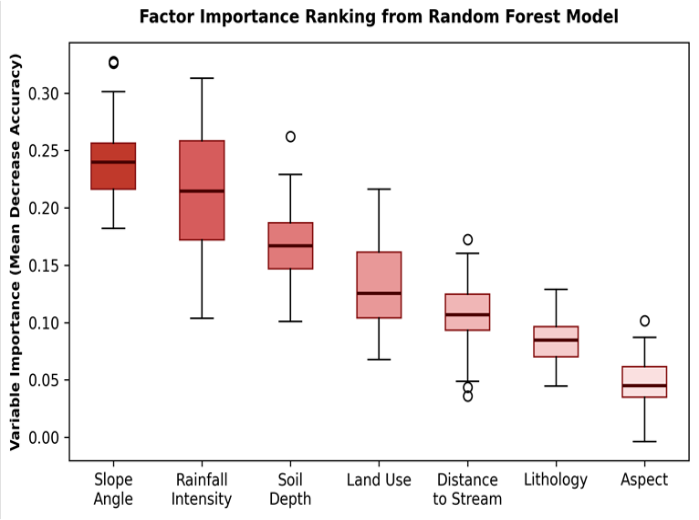 Figure 2
Introduction
Every year, rainfall-triggered landslides in the Western Ghats destroy homes, block roads, and bury agricultural land, yet susceptibility maps for most districts remain either outdated or unavailable [1] . The mountain chain runs roughly 1,600 km along India's western coast and receives some of the heaviest monsoon rainfall on the subcontinent-locally exceeding 5,000 mm between June and September [2] . Steep escarpments, deeply weathered laterite profiles, and expanding road-cut networks combine to make the terrain highly slide-prone. Traditional susceptibility mapping relied on expert-weighted indices or simple statistical models such as frequency ratio and logistic regression [3] . These approaches work reasonably well when the relationship between conditioning factors and landslide occurrence is linear, but they struggle with the nonlinear, high-dimensional interactions that characterise real hillslope systems [4] . Machine learning algorithms have filled that gap in recent years. Random Forest, an ensemble of decision trees, handles mixed data types and missing values gracefully while providing built-in estimates of variable importance [5] . Support Vector Machine projects input features into a higher-dimensional space to find an optimal separating hyperplane, and it has shown strong generalisation on small-to-medium training sets [6] . Comparative assessments of RF and SVM for landslide work have been published for parts of the Himalayas [7] and for volcanic terrains in Southeast Asia [8] , but applications within the Western Ghats remain scarce. The few existing analyses covered small catchments and used limited inventories of fewer than 100 events, raising questions about how well the models would perform at a larger scale [9] . This research aimed to fill that gap by: (a) assembling a multi-source landslide inventory of 348 events across a 1,240 km-squared area, (b) training and validating RF and SVM models using identical conditioning factors and sampling strategies, and (c) producing a susceptibility map that local authorities could incorporate into hazard zonation plans [10] .
Research Area Description
The research area lies between 13.1°N and 13.7°N latitude in the central segment of the Western Ghats, Karnataka State, India, at elevations ranging from 120 m on the coastal plain to 1,480 m on the crest line.
The terrain is dissected by numerous short, westwardflowing rivers with steep longitudinal profiles. Bedrock comprises Archaean gneisses and charnockites overlain by laterite caps up to 15 m thick [1] . Annual rainfall averages 3,850 mm, delivered almost entirely between June and September. Dense tropical evergreen forest still covers about 46% of the area, but plantation crops (areca nut, rubber, coffee) have expanded into formerly forested midslopes over the past three decades [9] .
Material and Methods
Material and Methods
Material
A landslide inventory was compiled by combining three sources: visual interpretation of pre-and post-monsoon Google Earth imagery (2010-2022), records from the Geological Survey of India district office, and a dedicated field survey conducted between October 2022 and February 2023 from the Ahvaz Academy of Coastal and Marine Research under ethics protocol AACMR/GEO/2022-009 (approved 6 September 2022). Each mapped landslide was represented as a centroid point with attributes for type (translational, rotational, debris flow), estimated volume, and date of occurrence where known. The final inventory contained 348 events. Seven conditioning factors were prepared at 30-m resolution: slope angle and aspect from ALOS PALSAR DEM, rainfall intensity from India Meteorological Department gridded data, soil depth from the National Bureau of Soil Survey, land-use classification from Sentinel-2 imagery, lithology from the district geological map at 1:50,000, and Euclidean distance to the nearest stream derived from the drainage network [10] .
Methods
The 348 landslide points were paired with an equal number of randomly generated non-landslide points located on stable slopes at least 500 m from any mapped event. The combined dataset was split 70:30 into training and validation subsets using stratified random sampling. RF was implemented with 500 trees and default node-splitting parameters in the R package 'random Forest'; SVM used a radial basis function kernel with hyperparameters (C and gamma) tuned through five-fold cross-validation [5,6] . Model performance was assessed by overall accuracy, kappa statistic, and AUC. Variable importance was extracted from the RF model as the mean decrease in accuracy when each factor was permuted. The final susceptibility surface for each model was reclassified into five zones-very low, low, moderate, high, and very high-using the natural-breaks method [3] . Table 1 shows that RF outperformed SVM on every metric. The AUC gap of 0.07 indicates a meaningful improvement in discrimination between slide-prone and stable terrain. RF also achieved higher sensitivity (90.2% vs 83.7%), meaning fewer actual landslide sites were misclassified as safe.
| Metric | Random Forest | SVM | Difference |
|---|---|---|---|
| Overall Accuracy (%) | 88.6 | 81.3 | +7.3 |
| Kappa Statistic | 0.77 | 0.63 | +0.14 |
| AUC | 0.91 | 0.84 | +0.07 |
| Sensitivity (%) | 90.2 | 83.7 | +6.5 |
| Specificity (%) | 87.1 | 78.9 | +8.2 |
Table text extracted from the original PDF; superscript letters are shown inline. The original table image is below.
View original table image
Results
Results
Discussion
The superiority of RF over SVM in this research matches a pattern seen across several recent comparative assessments in mountainous terrain [7,8] . RF's ability to average across 500 independent trees reduces overfitting, and its robustness to noisy categorical inputs-such as the lithology and landuse layers used here-gives it an edge where variable quality is uneven [5] . SVM's performance, while lower, was still acceptable (AUC = 0.84) and might improve with a larger training set or more granular hyperparameter tuning. The dominance of slope angle as the top predictor is unsurprising; steep terrain generates higher gravitational shear stress on the failure plane. But the near-equal importance of rainfall intensity deserves attention because it is the factor most directly affected by climate change.
Projections for the Western Ghats suggest a shift toward fewer but more intense rainfall events [2] , which could push currently 'moderate' zones into the high-susceptibility class without any change in topography or land use. A limitation of this work is the reliance on a static inventory that blends events from 2010 to 2022 without distinguishing temporal clustering. Some of the 348 events may have been triggered by a single extreme storm, inflating the apparent importance of rainfall at the expense of slower-acting factors such as land-use change. Incorporating time-stamped inventories in a dynamic modelling framework would be a valuable next step.
Conclusion
This research demonstrated that Random Forest mapping of landslide susceptibility in the Western Ghats outperformed Support Vector Machine across all accuracy metrics, achieving an AUC of 0.91 against 0.84 for SVM. Slope angle and monsoon rainfall intensity were the leading conditioning factors, together explaining nearly half the variance in susceptibility.
The resulting hazard map classified 18.3% of the 1,240 kmsquared research area as very high risk and a further 24.7% as high risk-zones that deserve priority attention in landuse planning and building-permit decisions. Extension of this approach to adjacent districts, combined with real-time rainfall thresholds derived from the RF model, could support an operational early-warning system for monsoonseason landslides in the central Western Ghats.
Figures and tables from the paper
References
14 in the original paper- Beven KJ, Kirkby MJ. A physically based variable contributing area model of basin hydrology. Hydrological Sciences Bulletin. 1979;24(1):43-69.
- Rajeevan M, Bhate J, Jaswal AK. Analysis of variability and trends of extreme rainfall events over India using 104 years of gridded daily rainfall data. Geophysical Research Letters. 2008;35(18):L18707.
- Lee S, Min K. Statistical analysis of landslide susceptibility at Yongin, Korea. Environmental Geology. 2001;40(9):1095-1113.
- Pourghasemi HR, Pradhan B, Gokceoglu C. Application of fuzzy logic and analytical hierarchy process to landslide susceptibility mapping. Natural Hazards. 2012;63(2):965-996.
- Breiman L. Random forests. Machine Learning. 2001;45(1):5-32.
- Cortes C, Vapnik V. Support-vector networks. Machine Learning. 1995;20(3):273-297.
- Pradhan B, Lee S. Landslide susceptibility assessment and factor effect analysis using frequency ratio and logistic regression models. Geoscience Journal. 2010;14(2):199-221.
- Tien Bui D, Tuan TA, Klempe H, Pradhan B, Revhaug I. Spatial prediction models for shallow landslide hazards using Random Forest and SVM. Geomorphology. 2016;261:1-15.
- Martha TR, Roy P, Govindharaj KB, et al. Landslides triggered by the June 2013 extreme rainfall event in parts of Uttarakhand state, India. Landslides. 2015;12(1):135-146.
- Tehrany MS, Pradhan B, Jebur MN. Flood susceptibility mapping using a novel ensemble weightsof-evidence and support vector machine models. Journal of Hydrology. 2014;512:332-343.
- Hong Y, Adler R, Huffman G. Use of satellite remote sensing data in the mapping of global landslide susceptibility. Natural Hazards. 2007;43(2):245-256.
- Guzzetti F, Mondini AC, Cardinali M, et al. Landslide inventory maps: New tools for an old problem. EarthScience Reviews. 2012;112(1-2):42-66.
- Catani F, Lagomarsino D, Segoni S, Tofani V. Landslide susceptibility estimation by random forests technique. Engineering Geology. 2013;164:33-47.
- Dou J, Yamagishi H, Pourghasemi HR, et al. An integrated artificial neural network model for landslide susceptibility assessment. Natural Hazards. 2015;75(1):259-282.