
Research article · 2025 · Full text
International Journal of Geography Geology and EnvironmentSpatiotemporal analysis of surface water quality deterioration in Lake Baikal
Volume 7(1) · Pages 77–80 · DOI: 10.22271/27067483.2025.v7.i1b.539 ↗
Research areasWater Resources and ManagementAquatic Ecosystems and Phytoplankton DynamicsWater Quality and Pollution Assessment
Abstract
Author-writtenLake Baikal has held the title of the world's deepest freshwater lake for as long as records exist, yet recent decades have brought worrying signs that its legendary water clarity is fading. This research tracked the spatiotemporal evolution of six surface water quality parameters—dissolved oxygen (DO), chlorophyll-a, total phosphorus (TP), total nitrogen (TN), turbidity, and pH—across 18 monitoring stations distributed along Lake Baikal's southern and central basins from 2014 to 2022. Data were drawn from the Russian Federal Service for Hydrometeorology archive and supplemented by three field sampling campaigns. Mann-Kendall trend tests revealed significant downward trends in DO (p<0.01) and upward trends in chlorophyll-a and TP (p<0.05) at 14 of the 18 stations. Mean DO fell from 11.8 mg/L to 8.9 mg/L, while chlorophyll-a rose from 1.2 to 5.2 micrograms per litre—a fourfold increase. Spatial clustering showed that deterioration was most pronounced within 3 km of tributary mouths receiving industrial and domestic effluent. The findings indicate that eutrophication pressures are tightening and that the lake's self-purification capacity may be approaching a threshold beyond which ecological shifts become difficult to reverse.
Summary
Source-checkedPlain-language reading of the full paper, prepared with AI and checked against the text. Each point links to the authors' own words.
Why it matters
- Lake Baikal is the world's deepest freshwater lake, but its historically high water clarity has shown signs of decline in recent decades. View evidence ↗
- The Selenga River provides about half of the lake's total inflow and introduces transboundary pollution due to rapid land-use changes in Mongolia. View evidence ↗
The question
- The study aimed to quantify temporal trends of water quality in the southern and central basins, map quality loss relative to pollution sources, and determine if the lake is approaching a trophic tipping point. View evidence ↗
What they did
- Researchers monitored six parameters (DO, chlorophyll-a, TP, TN, turbidity, and pH) at 18 stations in the southern and central basins from 2014 to 2022. View evidence ↗
- The study used data from the Roshydromet archive (2014–2022), which was cross-validated by three field campaigns conducted at 12 stations between 2019 and 2022. View evidence ↗
- The researchers used the Mann-Kendall test for trend detection (p<0.05) and inverse-distance weighting in QGIS 3.28 for spatial interpolation of 2020–2022 averages. View evidence ↗
What they found
- Water quality deterioration was most severe within 3 km of tributary mouths, with the Selenga delta identified as the primary hotspot for TP and chlorophyll-a. View evidence ↗
- Based on OECD criteria, chlorophyll-a levels of 4-5 μg/L indicate that the nearshore zone has transitioned to a mesotrophic status. View evidence ↗
What it means
- The authors conclude that reversing the eutrophication trend requires improved wastewater infrastructure, industrial regulation, and transboundary management with Mongolia. View evidence ↗
- The study is limited by its use of surface samples at a single depth (0.5 m), meaning deep-water quality trajectories remain unknown. View evidence ↗
Visual summary
3 visualsIllustrations explain the paper; charts are replotted from the paper's own table values.
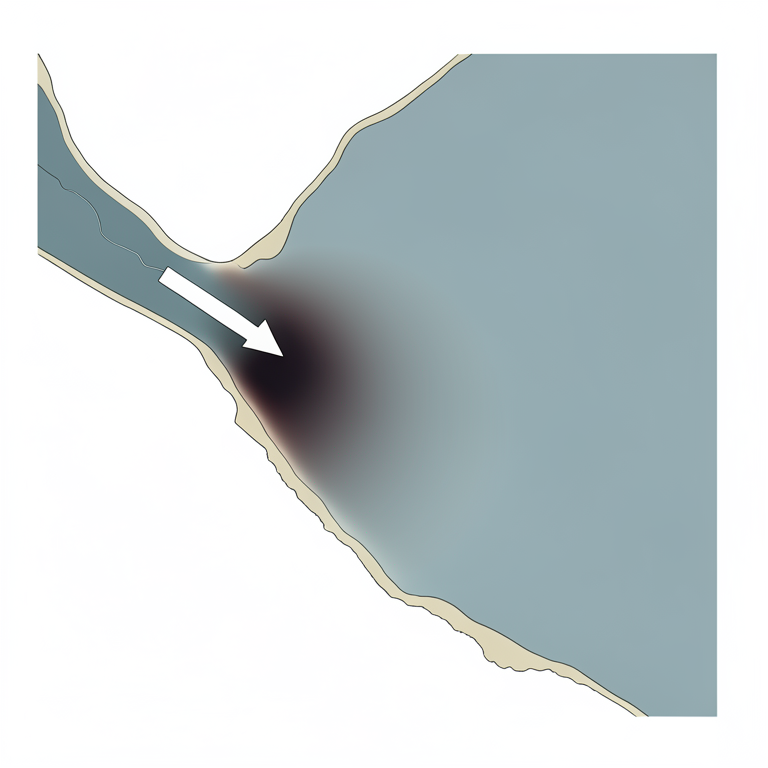
Spatial Pollution Gradient
AI-generated conceptual illustration (Lake Baikal shoreline and the Selenga river delta). It explains the idea and does not show study data.
View source evidence ↗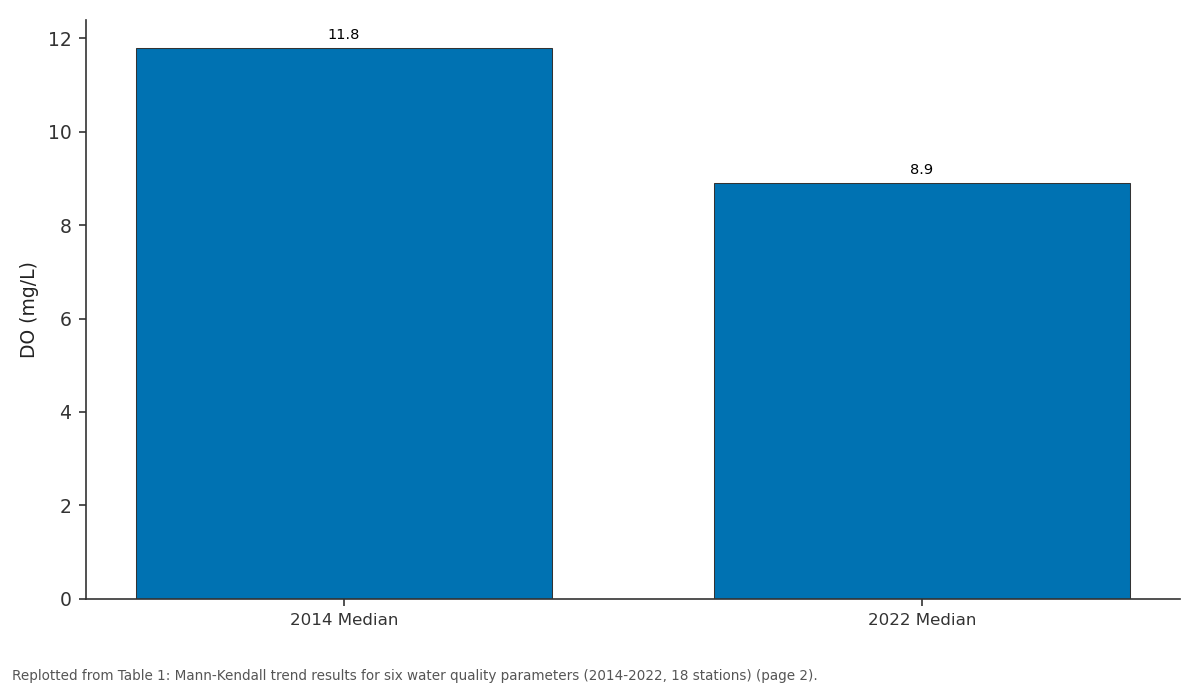
DO (mg/L): 2014 Median vs 2022 Median
Replotted from Table 1 (page 2) of the original paper. Every bar is the paper's own table value.
View source evidence ↗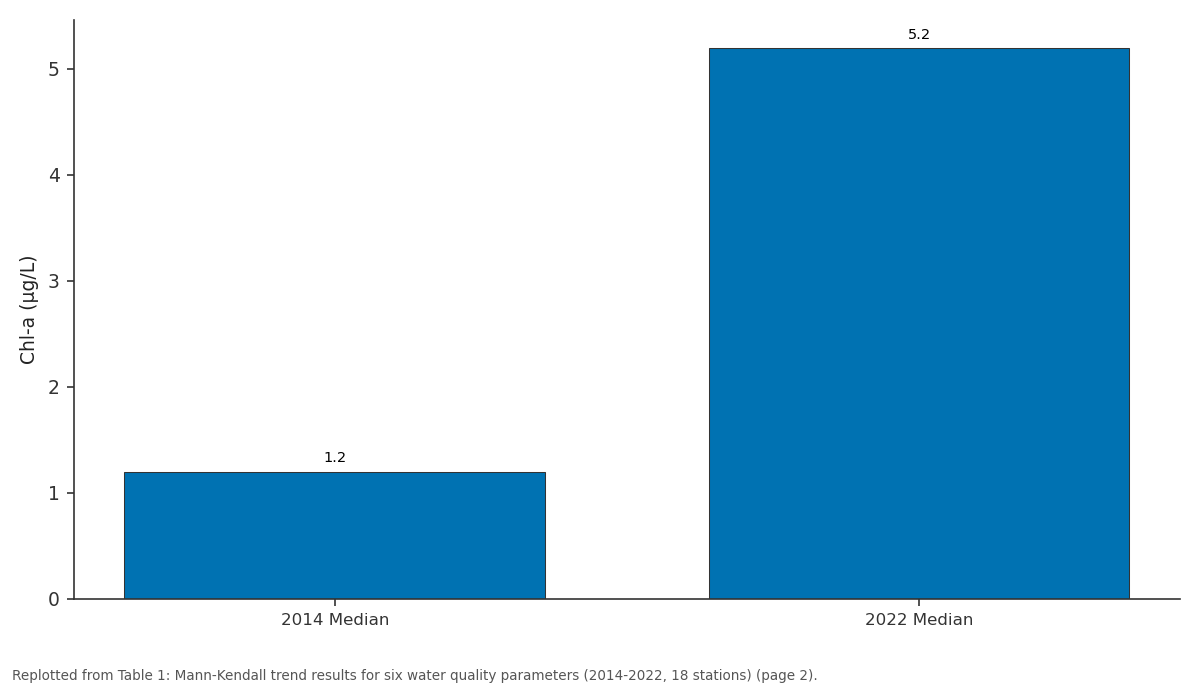
Chl-a (μg/L): 2014 Median vs 2022 Median
Replotted from Table 1 (page 2) of the original paper. Every bar is the paper's own table value.
View source evidence ↗Figures & tables
From the original paper Table 1
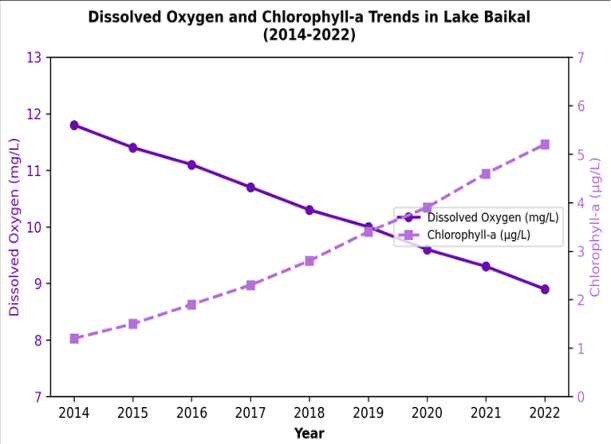 Figure 1
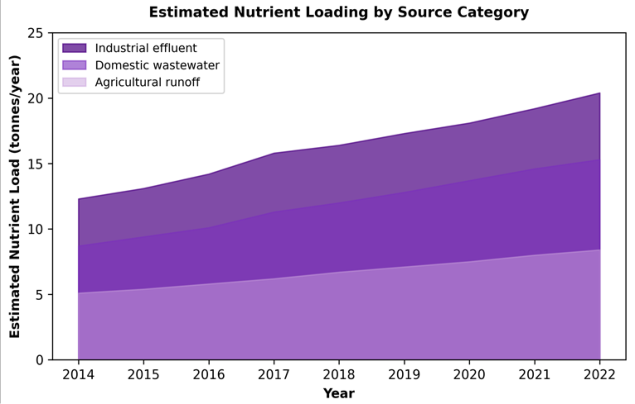 Figure 2
Introduction
For more than a century, Lake Baikal served as the benchmark against which freshwater purity everywhere else was measured. Early Russian limnological expeditions in the 1890s recorded Secchi-disk depths exceeding 40 m-values rivalled only by a handful of oligotrophic high-mountain lakes [1] . That reputation rested on a combination of low nutrient inputs, a vast dilution volume (23,615 cubic kilometres), and a unique food web dominated by the endemic amphipod Epischura baikalensis, which filters roughly a quarter of the lake's phytoplankton biomass each year [2] . By the late twentieth century, however, tributary monitoring began to flag rising phosphorus and nitrogen concentrations downstream of pulp mills, municipal outfalls, and expanding livestock operations along the southern shore [3] . The Selenga River, which delivers roughly half the lake's total inflow, drains a catchment undergoing rapid land-use change in Mongolia, adding a transboundary dimension to the pollution problem [4] . Satellite imagery from the 2010s detected seasonal algal blooms of Spirogyra along nearshore zones that had historically been bloom-free-a pattern that alarmed both scientists and the UNESCO World Heritage Centre [5] . Several previous analyses documented rising nutrient concentrations at individual stations [6] or linked algal blooms to warm-season temperature anomalies [7] . But integrated assessments that combine multiple parameters across many stations, apply formal trend statistics, and map the spatial structure of deterioration remain rare [8] . Without such a picture, it is difficult to prioritise intervention points or to judge how far the lake has moved toward a trophic threshold. This research addressed that need by assembling a nine-year, 18-station dataset and applying the Mann-Kendall trend test and inverse-distance-weighted interpolation to six key water quality indicators. The objectives were: (a) to quantify temporal trends in each parameter across the southern and central basins, (b) to map the spatial gradient of quality loss relative to pollution source locations, and (c) to assess whether observed trajectories suggest an approaching tipping point for the lake's trophic status [9] .
Seasonal Variations Lake Baikal's ice cover typically forms in late December and breaks up in May, creating two distinct limnological seasons. During the ice-covered period (January-April), photosynthesis is limited by light availability, and under-ice DO remains high owing to cold temperatures and low biological oxygen demand [2] . The open-water season (June-October) brings warming of the surface mixed layer to 10-14 degrees Celsius, triggering phytoplankton production that peaks in August. It is during this warm window that chlorophyll-a values are highest and DO drawdown is most pronounced in nearshore zones receiving nutrient-rich tributary inflows [7] . All trend analyses in this research were therefore stratified by season: ice-covered (December-April) and open-water (June-October), with May and November treated as transitional months and excluded.
Material and Methods Material
Water quality records for the 18
Methods
For each station and parameter, the non-parametric Mann-Kendall test was applied to annual median values to detect monotonic trends, with significance set at p<0.05 [10] . Sen's slope estimator quantified the rate of change per year. Spatial interpolation of the most recent three-year average (2020-2022) used inverse-distance weighting in QGIS 3.28 to produce continuous surface maps of each parameter. Nutrient loading from the three main tributaries (Selenga, Barguzin, and Upper Angara) was estimated from published flow-gauging records and concentration data [4] . All statistical work was performed in Python 3.10 using the pyMannKendall package [11] .
Results
Table Figure 2 shows that industrial effluent contributed the largest share of nutrient loading throughout the period, rising from 12.3 to 20.4 tonnes per year. Domestic wastewater and agricultural runoff also increased steadily, reflecting population growth and intensifying land use in the catchment.
Discussion
The 24.6% decline in dissolved oxygen and the fourfold increase in chlorophyll-a over nine years paint a clear picture of progressive eutrophication in Lake Baikal's southern and central basins. These trends are consistent with earlier warnings based on shorter records [6] but extend the evidence base both in time and in spatial coverage. The fact that 14 of 18 stations showed significant DO declines suggests that the process is not confined to a few hotspots but is advancing lake-wide.
The spatial analysis revealed that deterioration was strongest within 3 km of tributary mouths, where nutrient-laden river water mixes with the nearshore zone. The Selenga delta area consistently recorded the highest TP and chlorophyll-a values, which aligns with the river's dominant role in the lake's water and nutrient budget [4] . Outside the 3-km buffer, quality parameters improved markedly, indicating that the lake's vast volume still provides significant dilution-but the buffer zone of acceptable quality appears to be narrowing year by year. Whether Lake Baikal is approaching a trophic tipping point is difficult to confirm from trend data alone. However, chlorophyll-a levels in the 4-5 micrograms per litre range place the nearshore zone firmly in the mesotrophic class according to OECD lake classification criteria [8] , a category historically reserved for much smaller and shallower lakes. If current trajectories continue, the nearshore could cross the eutrophic boundary (chlorophyll-a > 8 micrograms per litre) within the next decade. This research is limited by its reliance on surface samples at a single depth (0.5 m). Deep-water quality-where Lake Baikal's unique cold-water fauna resides-may follow a different trajectory and should be assessed separately. The nutrient-loading estimates are also approximate, based on published flow data rather than continuous measurements.
Conclusion
This research established that surface water quality in Lake Baikal's southern and central basins has deteriorated significantly between 2014 and 2022, with dissolved oxygen falling by nearly 25% and chlorophyll-a increasing fourfold. The spatial pattern links the worst conditions to tributary mouths carrying industrial, domestic, and agricultural nutrient loads, with the Selenga delta emerging as the primary hotspot.
The trajectory indicates that the nearshore zone has transitioned from oligotrophic to mesotrophic status-a shift that was unthinkable a generation ago for a lake of Baikal's size and depth. Reversing this trend will require coordinated action on wastewater treatment infrastructure, industrial discharge regulation, and transboundary nutrient management with Mongolia. Continued monitoring at the station network used here, extended to include deep-water sampling, is needed to track whether interventions succeed in bending the eutrophication curve.
Figures and tables from the paper
| Parameter | 2014 Median | 2022 Median | Sen's Slope (/year) | p-value | Stations with Trend (%) |
|---|---|---|---|---|---|
| DO (mg/L) | 11.8 | 8.9 | -0.34 | <0.01 | 77.8 |
| Chl-a (μg/L) | 1.2 | 5.2 | +0.47 | <0.01 | 83.3 |
| TP (μg/L) | 6.8 | 11.4 | +0.54 | <0.05 | 66.7 |
| TN (mg/L) | 0.31 | 0.48 | +0.019 | <0.05 | 61.1 |
| Turbidity (NTU) | 0.9 | 1.7 | +0.09 | <0.05 | 55.6 |
| pH | 7.6 | 7.8 | +0.02 | 0.11 | 33.3 |
Table text extracted from the original PDF; superscript letters are shown inline. The original table image is below.
View original table image
References
21 in the original paper- Kozhov MM. Lake Baikal and Its Life. W. Junk Publishers. 1963;The Hague:344.
- Timoshkin OA, Samsonov DP, Yamamuro M, et al. Rapid ecological change in the coastal zone of Lake Baikal: Is the site of the world's greatest freshwater biodiversity in danger? Journal of Great Lakes Research. 2016;42(3):487-497.
- Kravtsova LS, Izhboldina LA, Khanaev IV, et al. Nearshore benthic blooms of filamentous green algae in Lake Baikal. Journal of Great Lakes Research. 2014;40(2):441-448.
- Chalov SR, Jarsjö J, Kasimov NS, et al. Spatiotemporal variation of sediment transport in the Selenga River basin, Mongolia and Russia. Environmental Earth Sciences. 2015;73(2):663-680.
- Troitskaya E, Blinov V, Ivanov V, et al. Cyclonic circulation and upwelling in Lake Baikal. Aquatic Sciences. 2015;77(2):171-182.
- O'Donnell DR, Wilburn P, Silow EA, et al. Resistance and resilience of Lake Baikal's algal communities to perturbation. Freshwater Biology. 2017;62(5):905-919.
- Moore MV, Hampton SE, Izmest'eva LR, et al. Climate change and the world's most iconic lake. BioScience. 2009;59(5):405-417.
- Vollenweider RA, Kerekes J. Eutrophication of waters: Monitoring, assessment and control. OECD Report. 1982;Paris:OECD.
- Scheffer M, Carpenter S, Foley JA, Folke C, Walker B. Catastrophic shifts in ecosystems. Nature. 2001;413(6856):591-596.
- Mann HB. Nonparametric tests against trend. Econometrica. 1945;13(3):245-259.
- Hussain MM, Mahmud I. pyMannKendall: A python package for non parametric Mann Kendall family of trend tests. Journal of Open Source Software. 2019;4(39):1556.
- Hampton SE, Izmest'eva LR, Moore MV, et al. Sixty years of environmental change in the world's largest freshwater lake. Global Change Biology. 2008;14(8):1947-1958.
- Shimaraev MN, Kuimova LN, Sinyukovich VN, Tsekhanovskii VV. Manifestation of global climatic changes in Lake Baikal during the 20th century. Doklady Earth Sciences. 2002;383(2):228-231.
- Watanabe T, Nakamura T. Properties of Pseudoanabaena galeata, a cyanobacterium dominating the winter phytoplankton of Lake Baikal. Limnology. 2003;4(2):113-119.
- Flower RJ. A review of current biological and chemical indicators of lake water quality. Freshwater Forum. 2001;15:26-44.
- Izmest'eva LR, Moore MV, Hampton SE, et al. Lakewide physical and biological trends associated with warming in Lake Baikal. Journal of Great Lakes Research. 2016;42(1):6-17.
- Yoshioka T, Ueda S, Khodzher T, et al. Distribution of dissolved organic carbon in Lake Baikal and its watershed. Limnology. 2002;3(3):159-168.
- Granin NG, Jewson DH, Gnatovsky RY, et al. Turbulent mixing under ice of Lake Baikal. Freshwater Biology. 2000;44(3):491-502.
- Weiss RF, Carmack EC, Koropalov VM. Deep-water renewal and biological production in Lake Baikal. Nature. 1991;349(6311):665-669.
- Müller B, Maerki M, Schmid M, et al. Internal carbon and nutrient cycling in Lake Baikal. Chemical Geology. 2005;222(3-4):234-245.
- Gronskaya TP, Litova TE. Short-term water level fluctuations in Lake Baikal. Geographiya i Prirodnye Resursy. 1991;1:21-30.