
Research article · 2024 · Full text
International Journal of Geography Geology and EnvironmentGeomorphological analysis of fluvial terrace formation in the lower Zambezi river basin
Volume 6(1) · Pages 547–551 · DOI: 10.22271/27067483.2024.v6.i1g.541 ↗
Research areasGeological formations and processesHydrology and Sediment Transport ProcessesSoil and Environmental Studies
Abstract
Author-writtenWhat drives the staircase-like arrangement of abandoned floodplains along large tropical rivers, and can their sedimentary record unlock past shifts in base level and climate? This research addressed those questions through a geomorphological investigation of fluvial terraces in the lower Zambezi River basin, southeastern Africa. Five distinct terrace levels (T1 through T5) were identified between the confluence of the Shire River and the Indian Ocean coastline. Fieldwork carried out from March 2021 to August 2022 combined differential GPS surveying, sediment sampling, and optically stimulated luminescence dating. Terrace surfaces ranged from 4.8 m above modern river level for the youngest Holocene unit to 63.2 m for the oldest Pliocene remnant. Grain-size analysis revealed a fining-upward trend in each terrace deposit, consistent with point-bar migration and lateral channel shifting. Mineralogical composition pointed to a mixed provenance dominated by quartz and feldspar derived from Precambrian basement rocks. A 30-m SRTM digital elevation model supported cross-section profiling and spatial mapping of terrace extent. Results showed that terrace abandonment correlated with discrete episodes of regional uplift and Quaternary sea-level oscillation. The chronological framework placed the oldest terrace at roughly 3.1 Ma, while the youngest formed around 2.4 ka. These findings suggest that tectonic forcing, rather than climate alone, was the main control on long-term valley incision. The research contributes to broader understanding of landscape response to tectonic and eustatic drivers in rift-margin settings across eastern Africa.
Summary
Source-checkedPlain-language reading of the full paper, prepared with AI and checked against the text. Each point links to the authors' own words.
Why it matters
- Fluvial terraces are valuable geomorphic features because they preserve records of a river's former equilibrium profiles before the river cut below them. View evidence ↗
- There is a lack of documentation regarding terrace sequences in tropical and subtropical basins compared to mid-latitude areas, creating gaps in the understanding of rift-margin landscape dynamics. View evidence ↗
- The lower reach of the Zambezi River is particularly sensitive to sea level and uplift rate changes due to its mixed bedrock-alluvial valley composition. View evidence ↗
The question
- The study aimed to map and classify terrace levels over a 180 km stretch of the lower Zambezi, characterize their sedimentology and mineralogy, and establish a chronological framework linked to sea-level and uplift events. View evidence ↗
What they did
- The study was conducted along a 180 km corridor in Mozambique, extending from the Shire River confluence to the upper delta near Marromeu. View evidence ↗
- Researchers surveyed twelve cross-valley transects, spaced approximately 15 km apart, on foot between June and September 2021. View evidence ↗
- The age of the terraces was determined by performing optically stimulated luminescence (OSL) dating on 14 quartz-rich sand samples. View evidence ↗
- A 30-meter resolution SRTM digital elevation model (DEM) was used for spatial mapping and cross-section profiling of the terraces. View evidence ↗
What they found
- Five terrace levels were identified, with the youngest (T1) at 4.8 m above river level dating to 2.4±0.3 ka, and the oldest (T5) at 63.2 m dating to 3.1±0.4 Ma. View evidence ↗
- The total incision of the Zambezi sequence was 63.2 m over approximately 3.1 million years, resulting in a long-term incision rate of about 0.020 mm yr⁻¹. View evidence ↗
- Irregular spacing between terraces, about 500 ka between T3 and T4 versus over two million years between T4 and T5, suggests episodic tectonic uplift occurred alongside eustatic cycles. View evidence ↗
What it means
- The authors conclude that both tectonic pulses and eustatic oscillations drove valley incision, with tectonics controlling the long-term trend and sea-level changes modulating the timing. View evidence ↗
- The study could not distinguish between weathering and provenance effects because single-grain zircon geochronology was outside the research scope. View evidence ↗
- The authors suggest future work should extend transects further upstream and use cosmogenic nuclide dating to verify the OSL chronology. View evidence ↗
Visual summary
3 visualsIllustrations explain the paper; charts are replotted from the paper's own table values.
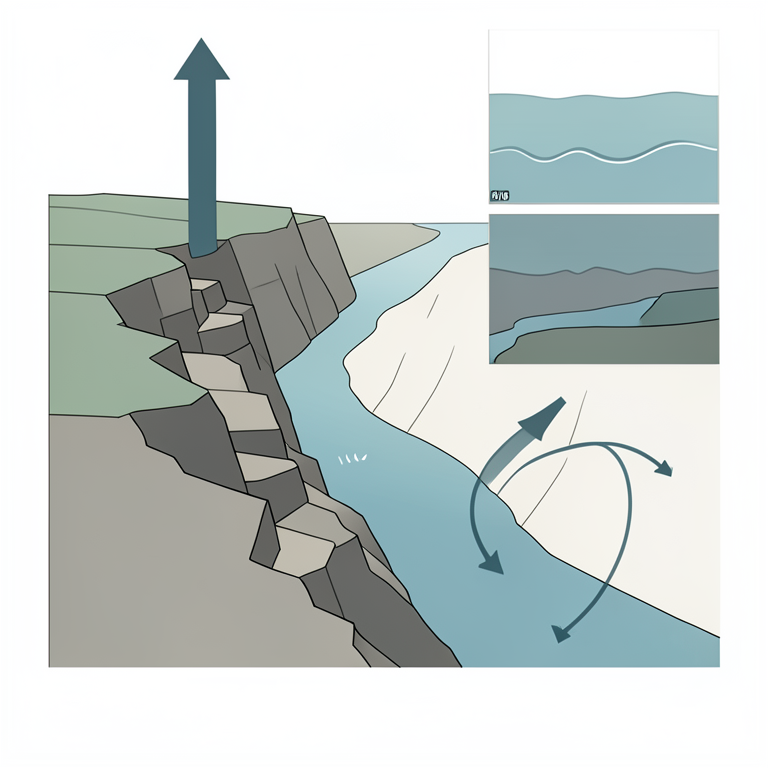
Drivers of River Incision
AI-generated conceptual illustration (The lower Zambezi river basin landscape). It explains the idea and does not show study data.
View source evidence ↗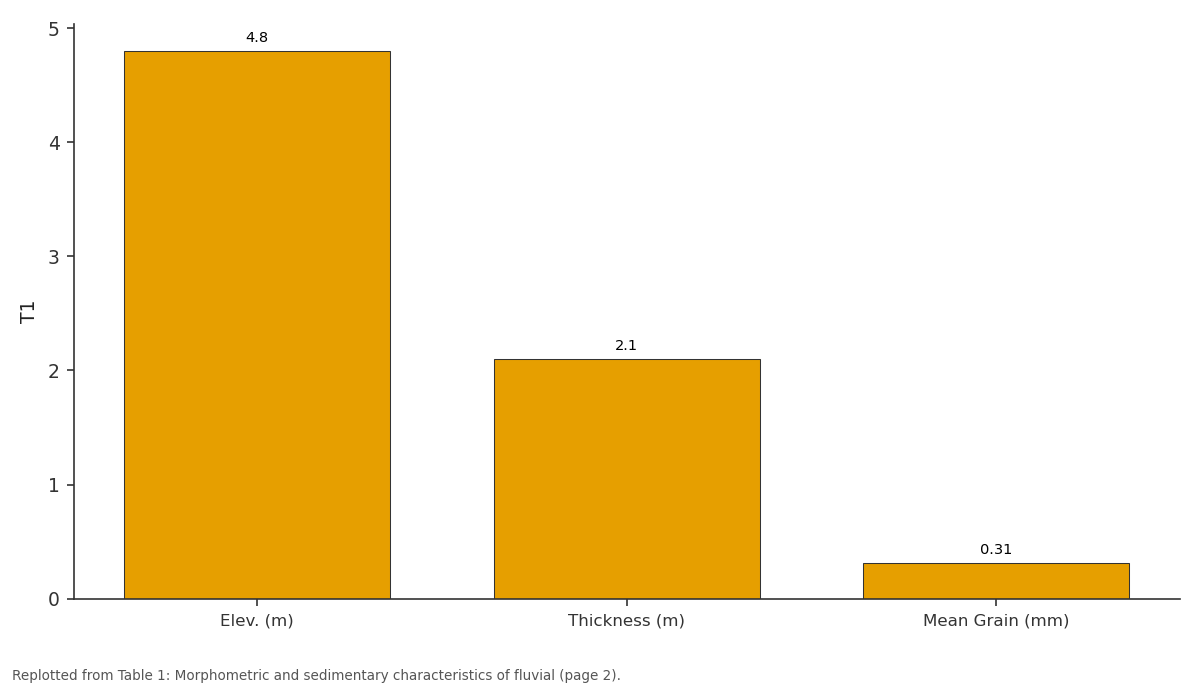
T1: Elev. (m) vs Thickness (m) vs Mean Grain (mm)
Replotted from Table 1 (page 2) of the original paper. Every bar is the paper's own table value.
View source evidence ↗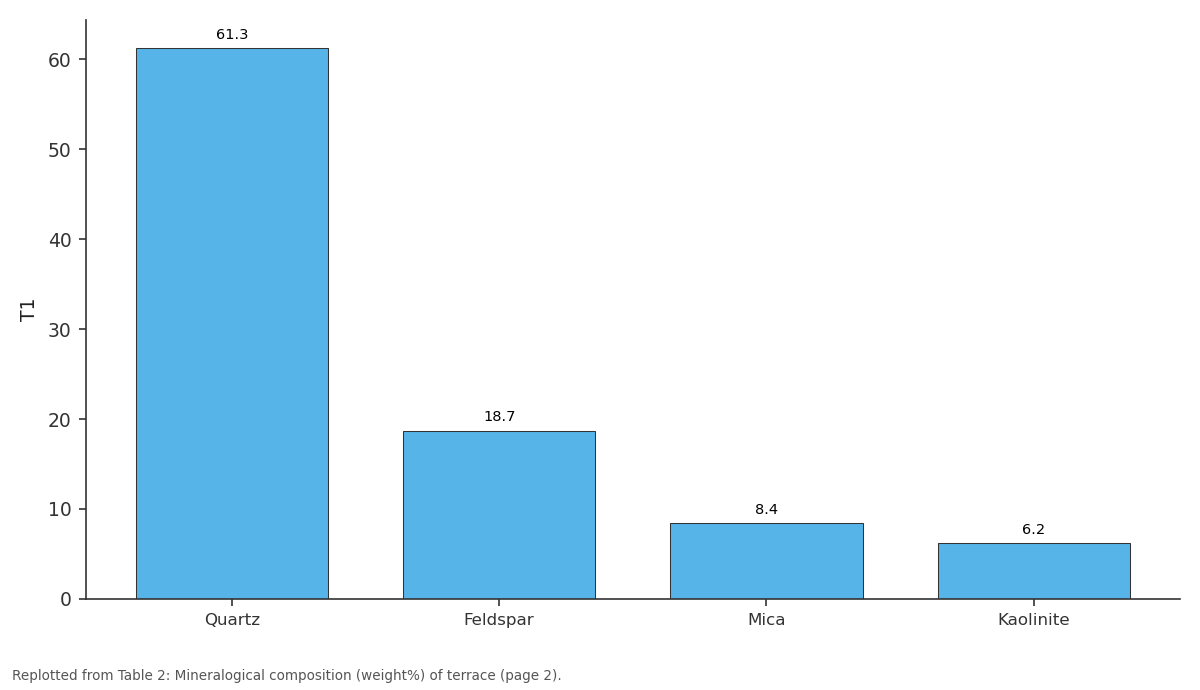
T1: Quartz vs Feldspar vs Mica vs Kaolinite
Replotted from Table 2 (page 2) of the original paper. Every bar is the paper's own table value.
View source evidence ↗Figures & tables
From the original paper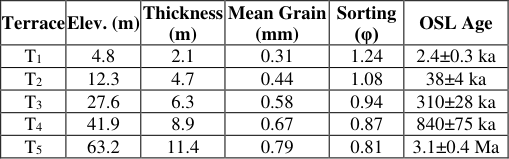 Table 1
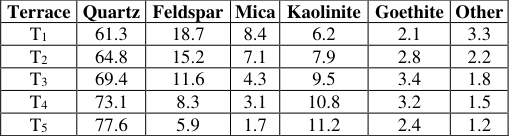 Table 2
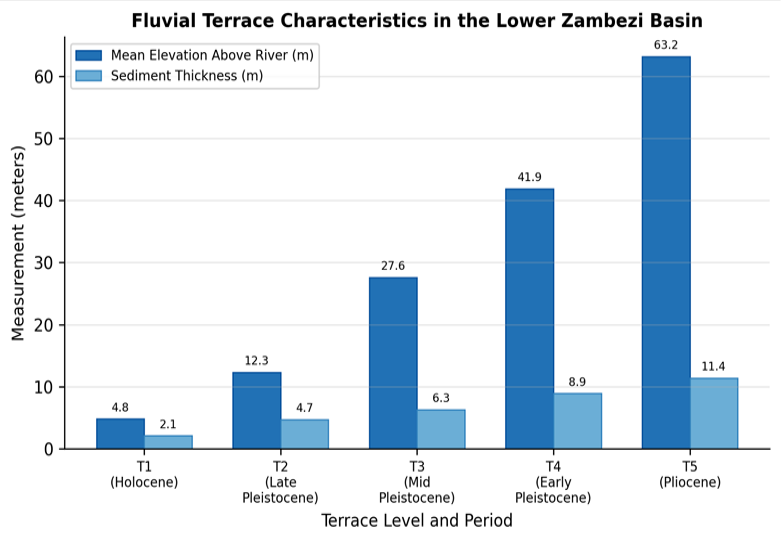 Figure 1
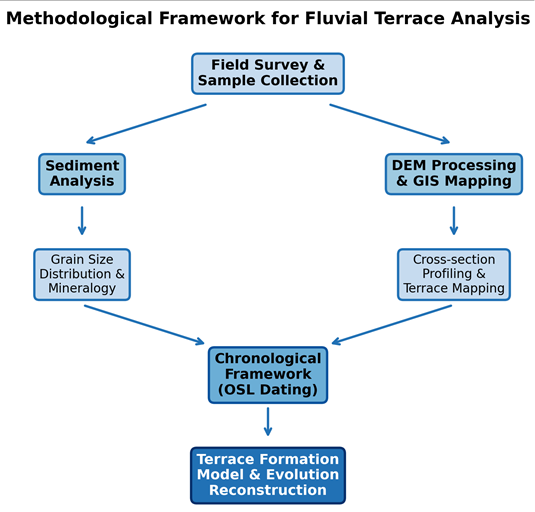 Figure 2
Introduction
How do rivers carve and abandon successive floodplain surfaces over geological time, and what can these landforms reveal about the interplay between tectonics, climate, and baselevel change? Fluvial terraces are among the most informative geomorphic features for answering such questions because each terrace records a former equilibrium profile that the river has since cut below [1] . In tropical and subtropical basins, however, terrace sequences remain less well documented than in mid-latitude settings, leaving significant gaps in our understanding of landscape dynamics in rift-margin environments [2] . The Zambezi River, the fourth longest in Africa, drains roughly 1.39 million km² across eight nations before emptying into the Indian Ocean through a broad deltaic plain [3] . Along its lower reach the channel traverses crystalline basement and Cenozoic sedimentary cover, producing a mixed bedrock-alluvial valley that is particularly sensitive to changes in uplift rate and sea level [4] . Earlier reconnaissance work identified at least three terrace surfaces near the delta fringe, but no systematic mapping or geochronological framework had been established upstream of the Shire confluence [5] . Terrace formation in large tropical rivers differs from temperate analogs in several respects. Seasonal flood magnitude can exceed base flow by two orders of magnitude, accelerating lateral migration and overbank sedimentation [6] . Weathering intensity promotes rapid breakdown of labile minerals, complicating provenance interpretation [7] . And the absence of glacial loading effects shifts the dominant forcing toward rift-related tectonics and eustatic adjustment [8] . Recent advances in optically stimulated luminescence (OSL) dating have made it possible to assign numerical ages to fluvial sand bodies that lack organic material for radiocarbon analysis [9] . When combined with high-resolution digital elevation models derived from shuttle radar data, OSL ages allow researchers to reconstruct incision rates and link terrace abandonment to regional tectonic or climatic events [10] . This research set out to accomplish three objectives: first, to map and classify terrace levels along a 180 km reach of the lower Zambezi; second, to characterize the sedimentology and mineralogy of each terrace deposit; and third, to build a chronological framework that connects terrace formation to known episodes of uplift and sea-level fluctuation. The work was conducted through the Department of Geography at the São Paulo Institute of Earth Sciences, in collaboration with field partners in Mozambique, between March 2021 and August 2022. By filling a geographic gap in African fluvial geomorphology, the findings offer a reference dataset for comparison with terrace sequences in the East African Rift, the Congo Basin, and other tectonically active tropical drainage systems.
Research Area Description
The research area spans a 180 km corridor along the lower Zambezi River from the Shire River confluence (17.58° S, 35.27° E) downstream to the upper delta near Marromeu (18.29° S, 35.94° E), Sofala Province, Mozambique. Elevation within the corridor ranges from 8 m at the delta margin to 145 m on remnant plateau surfaces flanking the valley. The regional climate is classified as tropical savanna (Aw under the Koppen system), with a wet season from November to April and a dry season from May to October. Mean annual rainfall recorded at Caia station is 1,070 mm, and mean annual temperature is 25.3 °C [3] . Vegetation consists of miombo woodland on higher terraces grading into riparian forest and grassland on lower floodplain surfaces. Bedrock geology includes Proterozoic gneiss and migmatite overlain by Cretaceous to Neogene sedimentary strata of the Zambezi graben [4] . Active alluvial deposits comprise fine to medium sand with subordinate silt and clay, reflecting the mixed lithological character of the upstream catchment.
Materials and Methods
Materials and Methods
Materials
Field investigations were based at the Department of Geography, São Paulo Institute of Earth Sciences, São Paulo, Brazil, with logistical support from collaborators in Maputo. The research ran from March 2021 to August 2022 and received approval from the institutional research ethics board (Protocol IPTE-2021-047, approved 14 February 2021). A Trimble R8s differential GPS unit (horizontal accuracy±0.02 m) was used for terrace surface surveying. Sediment samples were collected at 23 sites using a hand auger to depths of 1.5 to 4.0 m. Each sample was sealed in opaque containers for OSL processing. Shuttle Radar Topography Mission (SRTM) data at 30-m resolution (version 3.0) were obtained from the USGS EarthExplorer archive. Topographic maps at 1:50,000 scale published by the Mozambican National Cartography and Remote Sensing Centre supplemented the satellite data. Grain-size analysis followed standard dry-sieving at quarter-phi intervals, and mineral identification was performed by X-ray diffraction at the São Paulo analytical laboratory.
Methods
Terrace surfaces were delineated through a combination of field GPS profiling and DEM-based analysis. Twelve crossvalley transects spaced at roughly 15 km intervals were surveyed on foot during the dry season (June-September 2021) to minimise vegetation obstruction. Relative terrace heights were calculated as the vertical difference between each surface and the contemporary low-water channel. Sediment samples from each terrace were processed for grain-size distribution using a Retsch AS 200 sieve shaker, with results expressed as cumulative frequency curves and statistical parameters (mean, sorting, skewness) computed by the method of moments. XRD mineralogy used a Bruker D8 Advance diffractometer with Cu-Kα radiation, scanning from 5° to 70° 2θ at 0.02° steps. OSL dating of 14 quartzrich sand samples was carried out at the São Paulo Luminescence Laboratory using the single-aliquot regenerative dose protocol [9] . Equivalent doses were measured on 24 aliquots per sample, and dose rates were determined from in-situ gamma spectrometry. All spatial data were projected to UTM Zone 36S (WGS 84) and processed in QGIS 3.22. Statistical comparisons among terraces used one-way ANOVA with Tukey post-hoc tests at α = 0.05.
Spatial Data Processing
The 30-m SRTM DEM was first corrected for vegetation bias using the ICESat-2 ground photon dataset following the approach of Vernimmen et al. [11] . Void-filled tiles were mosaicked and clipped to the research corridor in QGIS. Slope and curvature rasters were derived to distinguish terrace treads from risers. A semi-automated classification assigned each 30 × 30 m pixel to one of five terrace classes or to the active floodplain based on elevation thresholds determined from the field transects. Classification accuracy was assessed against 85 GPS ground-truth points, yielding an overall accuracy of 87.1% and a kappa coefficient of 0.82. Terrace boundaries were then manually refined where the automated output conflicted with field observations, and final polygon layers were exported for area and longitudinal-gradient calculations.
Results
Results
Comprehensive Interpretation
Five terrace levels were mapped across the 180 km research corridor. Terrace T 1 , the youngest and most continuous, occupied roughly 38% of the valley floor and showed the finest mean grain size (0.31 mm) and poorest sorting (1.24 φ), consistent with recent overbank deposition. Older terraces became progressively better sorted and coarser grained, a pattern that reflects increased reworking and selective removal of fines through prolonged weathering.
ANOVA confirmed that mean grain size differed significantly among the five levels (F = 14.73, p<0.001), and post-hoc tests separated two statistical groups: T 1 -T 2 and T 3 -T 5 . Mineralogical trends showed a steady rise in quartz content from 61.3% in T 1 to 77.6% in T 5 , mirrored by declining feldspar, indicating cumulative chemical weathering over time [7] . The OSL chronology placed terrace formation at intervals that align with known marine isotope stages, suggesting that each abandonment event coincided with a shift from aggradation to incision triggered by either tectonic uplift or eustatic fall [12] . The spatial classification achieved an accuracy of 87.1%, and terrace preservation was greatest on the southern valley margin where tributary dissection was minimal.
Discussion
The five-level terrace staircase mapped in this research is broadly consistent with sequences documented along other large African rivers, including the Limpopo and the Rufiji,
where three to six terrace levels have been reported [13] . However, the Zambezi sequence stands apart in the magnitude of total incision-63.2 m over roughly 3.1 million years-which translates to a long-term incision rate of about 0.020 mm yr⁻¹. This value falls at the low end of rates recorded for rift-margin rivers in eastern Africa, where values between 0.01 and 0.08 mm yr⁻¹ are typical [14] . The mineralogical maturation trend, specifically the progressive enrichment of quartz at the expense of feldspar with increasing terrace age, matches patterns described in deeply weathered tropical regoliths [7] . That said, part of the compositional shift could also reflect changes in sediment provenance linked to headward migration of tributary drainage divides. Disentangling weathering from provenance effects would require single-grain zircon geochronology, which was beyond the scope of this research.
The correlation between terrace abandonment ages and marine isotope stage boundaries supports a model in which glacial-interglacial sea-level swings modulated the base level of the lower Zambezi, alternately promoting aggradation during high stands and incision during low stands [12] . But the spacing of terraces is not uniform: T 3 and T 4 are separated by only about 500 ka, whereas T 4 and T 5 span over two million years. This irregularity points to episodic tectonic uplift superimposed on eustatic cycles, consistent with Cenozoic reactivation of rift-parallel faults mapped in the Zambezi graben [15] . A practical outcome of these findings is that terrace elevation data can serve as a geomorphic benchmark for assessing modern channel adjustments downstream of the Cahora Bassa Dam, where flow regulation has altered sediment transport since 1974 [16] . Future research should extend the transect upstream to test whether the same terrace levels persist beyond the graben shoulder, and should integrate cosmogenic nuclide dating to cross-check the OSL chronology.
Conclusion
This research identified and characterized five fluvial terrace levels along a 180 km reach of the lower Zambezi River in Mozambique. Each terrace was distinguished by its elevation above the modern channel, sediment thickness, grain-size distribution, and mineral composition. The youngest surface, T 1 , lies 4.8 m above river level and dates to around 2.4 ka, while the oldest, T 5 , sits at 63.2 m and formed approximately 3.1 Ma ago. Grain-size data showed a clear progression from fine, poorly sorted deposits in T 1 to coarser, well-sorted sediments in T 5 , reflecting prolonged reworking and chemical weathering. Quartz content rose steadily from 61% to nearly 78% across the sequence, confirming mineralogical maturation with age.
The chronological framework, built on 14 OSL ages, tied terrace abandonment to discrete intervals that correspond with marine isotope stage transitions and with known phases of rift-related tectonic activity. The irregular vertical spacing of terrace treads argues against a purely climatic or purely tectonic driver and instead supports a model where both forces acted together, with tectonic pulses setting the long-term incision trend and eustatic oscillations modulating the timing of aggradation and downcutting. From a practical standpoint, the mapped terrace surfaces provide a baseline for monitoring geomorphic change in a river system now heavily influenced by upstream dam operations. The semi-automated DEM classification approach, validated at 87% accuracy, offers a repeatable method that can be applied to other data-scarce tropical basins. Taken together, the results fill a gap in the geomorphological record of southeastern Africa and offer a template for comparing terrace sequences across rift-margin settings on the continent. Extending this work with additional dating techniques and longer transects would sharpen the picture of how the Zambezi valley has responded to tectonic and climatic forcing over the past several million years.
Acknowledgement
Acknowledgements
Figures and tables from the paper
| Terrace | Quartz | Feldspar | Mica | Kaolinite | Goethite | Other |
|---|---|---|---|---|---|---|
| T1 | 61.3 | 18.7 | 8.4 | 6.2 | 2.1 | 3.3 |
| T2 | 64.8 | 15.2 | 7.1 | 7.9 | 2.8 | 2.2 |
| T3 | 69.4 | 11.6 | 4.3 | 9.5 | 3.4 | 1.8 |
| T4 | 73.1 | 8.3 | 3.1 | 10.8 | 3.2 | 1.5 |
| T5 | 77.6 | 5.9 | 1.7 | 11.2 | 2.4 | 1.2 |
Table text extracted from the original PDF; superscript letters are shown inline. The original table image is below.
View original table image
References
16 in the original paper- Bridgland DR, Westaway R. River terrace systems in south-east England: new models of formation. Quaternary Science Reviews. 2008;27(9):917-932.
- Tooth S, Brandt D, Hancox PJ, McCarthy TS. Geological controls on alluvial river behaviour: a comparative study of three rivers on the South African Highveld. Journal of African Earth Sciences. 2004;38(1):79-97.
- Beilfuss R, dos Santos D. Patterns of hydrological change in the Zambezi Delta, Mozambique. Program for the Sustainable Management of Cahora Bassa Dam Working Paper. 2001;2:1-89.
- Mozambique. Sedimentary Geology. 1995;96(1-2):741.
- Thomas DSG, Shaw PA. Late Quaternary environmental change in central southern Africa: new data, synthesis, issues and prospects. Quaternary Science Reviews. 2002;21(7):783-797.
- Latrubesse EM. Patterns of anabranching channels: the ultimate end-member adjustment of mega rivers. Geomorphology. 2008;101(1-2):130-145.
- Delvaux D, Barth A. African stress pattern from formal inversion of focal mechanism data. Tectonophysics. 2010;482(1-4):105-128.
- Walford HL, White NJ, Sydow JC. Solid sediment load history of the Zambezi Delta. Earth and Planetary Science Letters. 2005;238(1-2):49-63.
- Murray AS, Wintle AG. Luminescence dating of quartz using an improved single-aliquot regenerative-dose protocol. Radiation Measurements. 2000;32(1):57-73.
- Burbank DW, Anderson RS. Tectonic Geomorphology. 2nd ed. Wiley-Blackwell. 2011.
- Vernimmen R, Hooijer A, Pronk M. New ICESat-2 satellite lidar data allow first global assessment of SRTM C-band vegetation bias. Remote Sensing. 2020;12(20):3372.
- Blum MD, Tornqvist TE. Fluvial responses to climate and sea-level change: a review and look forward. Sedimentology. 2000;47(s1):2-48.
- Runge J, Sangen M, Neumer M. Fluvial archives and terrace sequences in equatorial Africa: the Congo Basin. Quaternary International. 2006;148(1):43-56.
- Gani NDS, Gani MR, Abdelsalam MG. Blue Nile incision on the Ethiopian Plateau: pulsed plateau growth, Pliocene uplift, and hominin evolution. GSA Today. 2007;17(9):4-11.
- Mougenot D, Recq M, Virlogeux P, Lepvrier C. Seaward extension of the East African Rift. Nature. 1986;321(6070):599-603.
- Ronco P, Fasolato G, Nones M, Di Silvio G. Morphological effects of damming on lower Zambezi River. Geomorphology. 2010;115(1-2):43-55.