
Research article · 2025 · Full text
International Journal of Geography Geology and EnvironmentRiverbank erosion and sediment flux assessment in the Brahmaputra meandering reach
Volume 7(4) · Pages 169–172 · DOI: 10.22271/27067483.2025.v7.i4c.557 ↗
Research areasHydrology and Sediment Transport ProcessesCoastal and Marine DynamicsSoil erosion and sediment transport
Abstract
Author-writtenHistorical records stretching back over a century show that the Brahmaputra has displaced entire villages, swallowed farmland, and rerouted its channel by kilometres within a single monsoon season. This research quantified riverbank erosion rates and associated sediment fluxes along a 78 km meandering reach of the Brahmaputra River using multi-temporal satellite imagery (Landsat 5/7/8, 2005-2023) and field-based bank profile measurements. Channel migration was tracked through digital shoreline analysis in DSAS v5.0, while sediment flux was estimated from suspended sediment concentration (SSC) data collected at six gauging stations during three consecutive monsoon seasons (2020-2022). Mean annual bank retreat ranged from 14.8 m/yr at the most stable bend to 30.1 m/yr at the most active outer bank, with a reach-averaged value of 22.4 m/yr. Cumulative land loss over the 18-year period totalled 9.6 km². Annual suspended sediment flux at the downstream gauge averaged 389 Mt/yr, of which bank-derived material contributed an estimated 11-16%. Peak erosion coincided with monsoon discharge maxima in July and August. Regression analysis linked erosion rate to bank height (R² = 0.61), silt content (R² = 0.47), and peak discharge (R² = 0.58). The findings underline the need for spatially targeted bank protection in reaches where retreat rates exceed 25 m/yr.
Summary
Source-checkedPlain-language reading of the full paper, prepared with AI and checked against the text. Each point links to the authors' own words.
Why it matters
- The Brahmaputra River is characterized by extreme instability, capable of rerouting its channel by kilometers and destroying villages and farmland in a single monsoon season. View evidence ↗
- The Brahmaputra is one of the top three rivers globally for sediment transport, moving approximately 400-600 Mt/yr past its downstream gauges. View evidence ↗
- Local outer-bank erosion rates in the river's braided and meandering reaches have been reported to exceed 100 m/yr. View evidence ↗
The question
- The study aimed to quantify bank retreat rates over a 78 km meandering reach, estimate the resulting sediment flux, and identify the hydrological and geotechnical factors controlling erosion variability. View evidence ↗
What they did
- Researchers used Landsat 5/7/8 satellite imagery from 2005 to 2023 and field-based bank profile measurements to assess a 78 km meandering reach. View evidence ↗
- Channel migration was analyzed using DSAS v5.0, and sediment flux was estimated using suspended sediment concentration (SSC) data from six gauging stations during the 2020-2022 monsoon seasons. View evidence ↗
- Geotechnical samples were collected at 0.5 m depth intervals from six bank-profile sites surveyed via RTK-GPS and total station for shear testing and grain-size analysis. View evidence ↗
What they found
- The average annual bank retreat for the reach was 22.4 m/yr, with rates varying between 14.8 m/yr at the most stable bend and 30.1 m/yr at the most active outer bank. View evidence ↗
- Over the 18-year study period, the total cumulative land loss amounted to 9.6 km². View evidence ↗
- Bank-derived material contributed an estimated 11-16% of the average annual suspended sediment flux of 389 Mt/yr measured at the downstream gauge. View evidence ↗
- Bank height, silt fraction, and peak monsoon discharge were the strongest predictors of annual erosion rates, together explaining 72% of the variance. View evidence ↗
- Higher erosion rates were systematically observed in banks with heights exceeding 9 m and silt fractions greater than 50%. View evidence ↗
What it means
- The authors recommend implementing spatially targeted bank protection in areas where bank retreat rates exceed 25 m/yr. View evidence ↗
- A limitation of the study is the annual resolution of the satellite imagery, which prevents the capture of retreat-deposition cycles occurring within a single monsoon. View evidence ↗
Visual summary
3 visualsIllustrations explain the paper; charts are replotted from the paper's own table values.
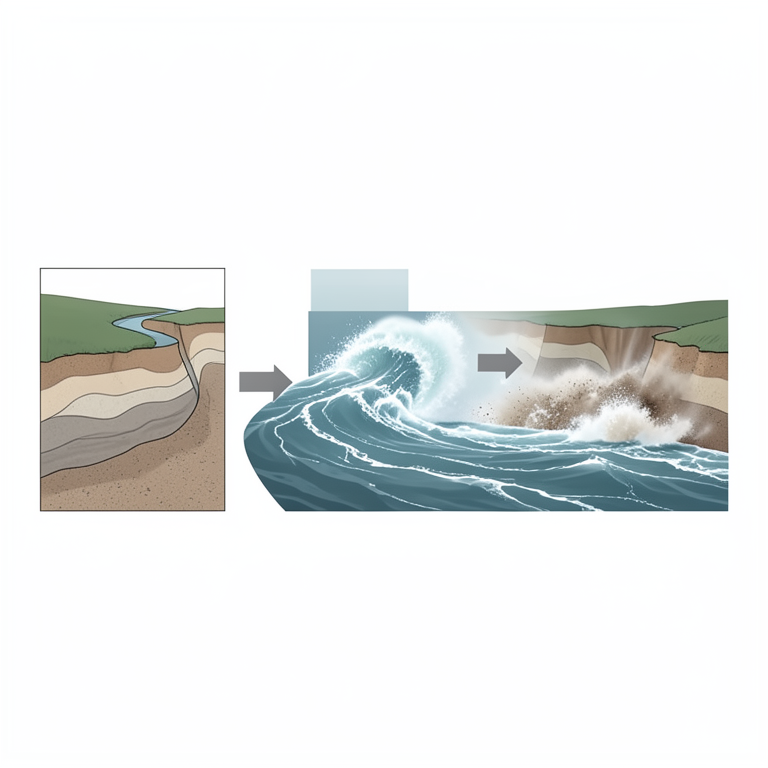
Predictors of Bank Erosion
AI-generated conceptual illustration (a meandering riverbank of the Brahmaputra river). It explains the idea and does not show study data.
View source evidence ↗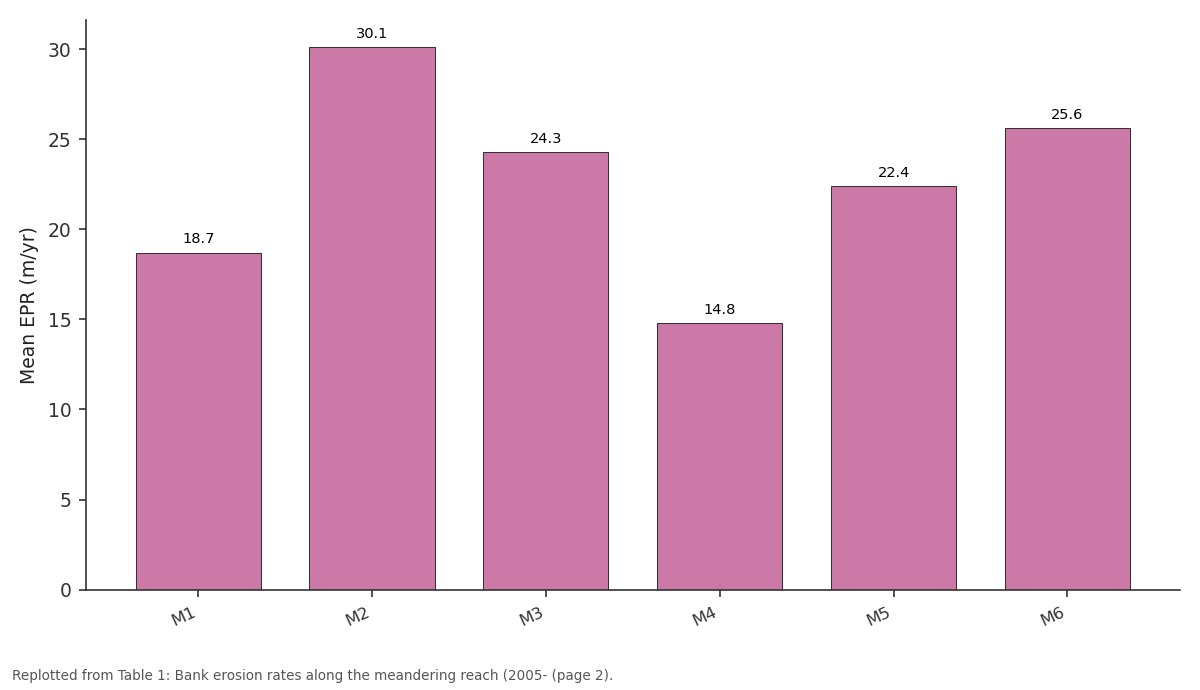
Mean EPR (m/yr): M1 vs M2 vs M3 vs M4 vs M5
Replotted from Table 1 (page 2) of the original paper. Every bar is the paper's own table value.
View source evidence ↗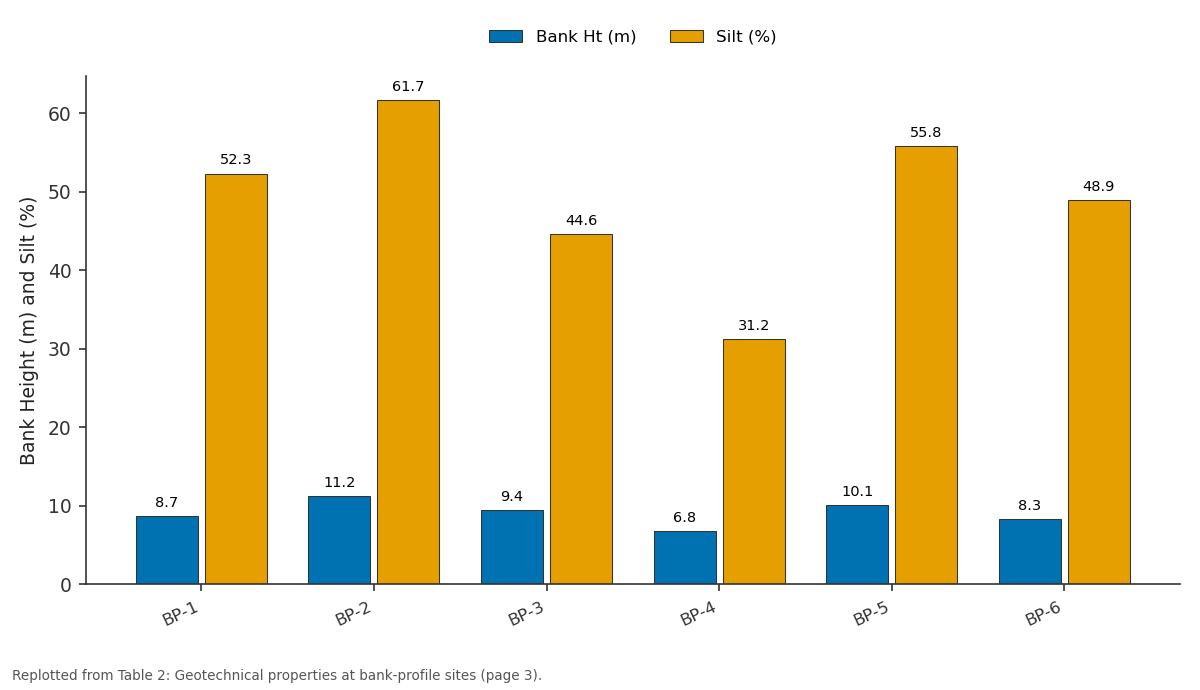
Bank Ht (m) and Silt (%): BP-1 vs BP-2 vs BP-3 vs BP-4 vs BP-5
Replotted from Table 2 (page 3) of the original paper. Every bar is the paper's own table value.
View source evidence ↗Figures & tables
From the original paper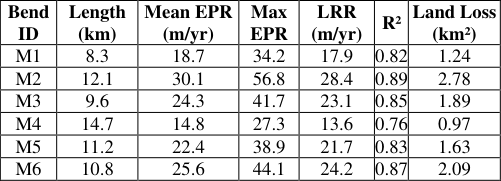 Table 1
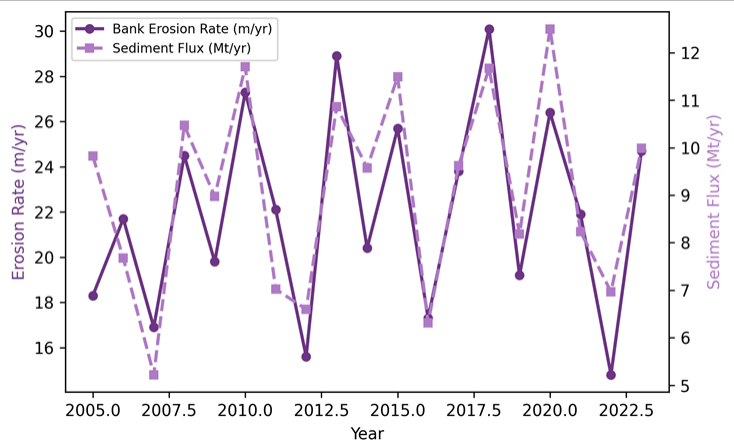 Figure 1
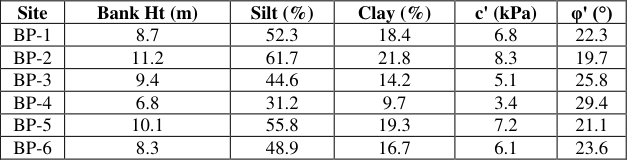 Table 2
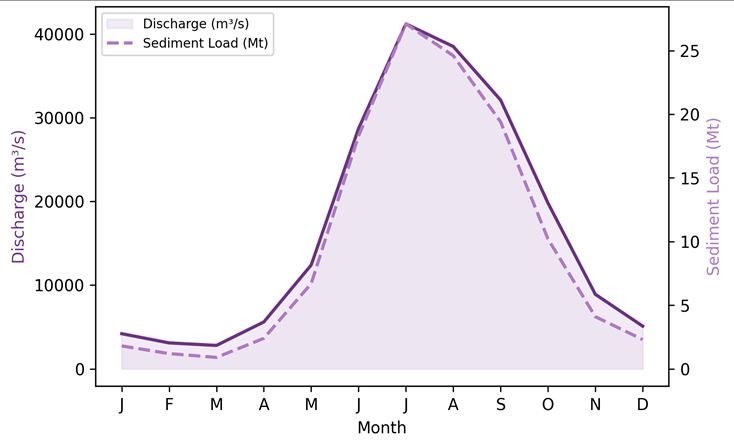 Figure 2
Introduction
Long before modern gauging networks existed, British colonial engineers documented the Brahmaputra's tendency to shift its course across the Assam floodplain, noting that entire tea estates could vanish beneath shifting sandbars within a few flood seasons [1] . That instability persists today and arguably worsens as population pressure pushes settlement closer to actively eroding banks [2] . The Brahmaputra ranks among the world's top three rivers for sediment transport, carrying roughly 400-600 Mt/yr past its downstream gaugesa load generated by intense monsoonal rainfall acting on easily erodible Himalayan and sub-Himalayan source rocks [3] . Bank erosion in alluvial rivers is driven by a combination of hydraulic forces (shear stress, secondary currents), mass failure mechanisms (rotational slumping, cantilever collapse), and material properties (cohesion, grain size, moisture content) [4] . In braided and meandering reaches of the Brahmaputra, outer-bank erosion rates exceeding 100 m/yr have been locally reported, though reach-averaged values are typically lower [5] . Quantifying these rates over multi-decadal timescales requires satellite-based change detection, as ground surveys cover only short segments. The Digital Shoreline Analysis System (DSAS) has been widely applied to coastal settings but adapts well to fluvial shorelines [6] . Combined with field measurements of SSC and bank geotechnical properties, DSAS-derived migration rates can be converted to volumetric sediment contributions and placed in the broader sediment budget [7] . Yet few investigations have attempted this integration for the Brahmaputra's meandering segments, where erosiondeposition asymmetries create some of the highest net land-loss rates in South Asia. This research aimed to (i) quantify bank retreat rates along a 78 km meandering reach using multi-temporal Landsat imagery, (ii) estimate the sediment flux derived from bank erosion, and (iii) identify the geotechnical and hydrological controls on spatial variability in erosion intensity.
The outcomes are intended to inform bank-protection prioritisation by government agencies [8] .
Research Area Description
The researched reach extends 78 km along the Brahmaputra between Dibrugarh and Neamati in upper Assam, India. Here the river transitions from a braided planform upstream to a series of large-amplitude meander bends with wavelengths of 8-14 km. The floodplain is composed of Quaternary alluvial depositspredominantly fine sand, silt, and clayunderlain at 20-30 m depth by Tertiary Tipam sandstones. The active channel width varies from 1.2 km at bend apices to 4.7 km in braided segments. Annual discharge ranges from 3,000 m³/s in the dry season (January-March) to over 40,000 m³/s during peak monsoon (July-August) [9] . Local land use is dominated by rice cultivation and tea plantations, both highly vulnerable to lateral channel migration.
Material and Methods Material
Satellite imagery was sourced from the USGS Earth Explorer archive. Eighteen cloud-free Landsat scenes (path 136, row 42) were selected between 2005 and 2023one dry-season image per year at approximately the same water stage. Field data were collected during three monsoon campaigns (June-October 2020, 2021, 2022) at the School of Geography and Environment, Nanjing, in collaboration with local water resource offices. Six bank-profile sites were surveyed using total station and RTK-GPS, with geotechnical samples taken at 0.5 m depth intervals for grain-size analysis and direct shear testing. Suspended sediment concentration was measured at six gauging crosssections using depth-integrated US DH-48 samplers, with concurrent discharge obtained via ADCP (Teledyne RiverRay).
Methods
Bank lines were digitised from each Landsat scene at 1:25,000 scale using the MNDWI threshold method to delineate the water-land boundary. The DSAS extension in ArcGIS Pro generated transects at 100 m spacing along a reference baseline, computing end-point rate (EPR) and linear regression rate (LRR) at each transect [10] . Sediment flux from bank erosion was estimated by multiplying retreat area by bank height and bulk density, following the approach of Thorne and Tovey [11] . SSC data were converted to daily loads using a rating-curve approach fitted to 184 concurrent discharge-SSC measurements. Statistical relationships between erosion rate and explanatory variables (bank height, silt fraction, peak discharge, bend curvature) were tested with multiple linear regression and stepwise selection (p<0.05). All spatial analyses used ArcGIS Pro 3.0 and R v4.2.1.
Climatic and Environmental Conditions
The three monsoon campaigns (2020-2022) experienced total June-October rainfall of 1,830, 2,110, and 1,940 mm, respectively, close to the 30-year average of 1,970 mm. Peak daily discharges reached 38,500 m³/s (2020), 41,200 m³/s (2021), and 36,800 m³/s (2022). The 2021 monsoon was notably intense, with two flood pulses exceeding 40,000 m³/s within a three-week window. Mean air temperature during the monsoon ranged from 26 to 32 °C. No significant earthquake events occurred during the monitoring period that could have affected bank stability. Bend M2 showed the highest mean EPR (30.1 m/yr) and greatest cumulative land loss (2.78 km²), driven by its sharp curvature and high silt-content banks. Bend M4, with the gentlest curvature and sandier bank composition, recorded the lowest retreat rates (Table 1). Annual erosion rates fluctuated between 14.8 and 30.1 m/yr, with no clear long-term trend but pronounced year-to-year variability linked to monsoon intensity (Figure 1). Sediment flux from bank sources averaged 52 Mt/yr, representing 11-16% of the total suspended load passing the downstream gauge [12] . Banks with higher silt fractions (>50%) and greater heights (>9 m) showed systematically higher erosion rates.
Results
Effective cohesion (c') peaked at 8.3 kPa (BP-2), yet this site also recorded among the highest retreat rates, suggesting that hydraulic undercutting overwhelms shear resistance during peak flows (Table 2). The 2021 monsoon exemplified the tight coupling between discharge and sediment transport. Peak SSC (1,340 mg/L) lagged peak discharge by roughly one week, consistent with progressive bank collapse following the flood crest (Figure 2) [13] .
| Site | Bank Ht (m) | Silt (%) | Clay (%) | c' (kPa) | φ' (°) |
|---|---|---|---|---|---|
| BP-1 | 8.7 | 52.3 | 18.4 | 6.8 | 22.3 |
| BP-2 | 11.2 | 61.7 | 21.8 | 8.3 | 19.7 |
| BP-3 | 9.4 | 44.6 | 14.2 | 5.1 | 25.8 |
| BP-4 | 6.8 | 31.2 | 9.7 | 3.4 | 29.4 |
| BP-5 | 10.1 | 55.8 | 19.3 | 7.2 | 21.1 |
| BP-6 | 8.3 | 48.9 | 16.7 | 6.1 | 23.6 |
Table text extracted from the original PDF; superscript letters are shown inline. The original table image is below.
View original table image
Comprehensive Interpretation
Multiple regression identified bank height (β = 0.41, p<0.01), silt fraction (β = 0.34, p<0.01), and peak monsoon discharge (β = 0.29, p = 0.02) as the three strongest predictors, collectively explaining 72% of the variance in annual erosion rate. Bend curvature added only 4% explanatory power and was not retained in the stepwise model.
Discussion
The reach-averaged retreat rate of 22.4 m/yr falls within the range reported for other large alluvial rivers in Asia. The Ganges downstream of Farakka Barrage shows 15-35 m/yr [14] , while the Mekong in Cambodia records 5-20 m/yr [15] . What distinguishes the Brahmaputra is the combination of high sediment load and low bank cohesion, which produces some of the fastest lateral migration rates anywhere on Earth for a river of its size [16] . The finding that bank height is the strongest predictor is intuitive: taller banks present a greater moment arm for rotational failures and expose more material to wave and current attack during high stages. But the importance of silt content over clay is less expected. Silt-rich banks exhibit negative pore-water pressure during draw-down, which triggers tension cracks that propagate into block failures [17] . This mechanism was directly observed at BP-2 and BP-5 during the 2021 monsoon draw-down phase.
The contribution of bank erosion to total sediment flux (11-16%) is modest in percentage terms but large in absolute magnituderoughly 43-62 Mt/yr. This material is predominantly fine-grained and enters the suspended load almost immediately upon failure, unlike bed-load contributions that require hydraulic entrainment [18] . Management implications centre on identifying the 20-30% of the bank length responsible for over 60% of the land loss a concentration pattern evident in our transect data. Targeted interventions such as geobag revetments and bioengineering at these hotspots could be more costeffective than reach-wide armouring [19] . Limitations include the annual temporal resolution of satellite imagery, which cannot capture intra-monsoon retreat-deposition cycles. And the rating-curve approach to sediment load carries inherent scatter (R² = 0.78), especially at the highest discharges where sample collection is dangerous [20] .
Conclusion
This research combined multi-temporal satellite analysis with field-based geotechnical and hydrometric data to quantify bank erosion and sediment flux along a 78 km meandering reach of the Brahmaputra. Mean annual bank retreat reached 22.4 m/yr, with hotspot bends exceeding 30 m/yr. Cumulative land loss over 18 years totalled 9.6 km². Bank-derived sediment contributed 11-16% of the annual suspended load, a proportion that rises during peak monsoon discharge. Statistical modelling identified bank height, silt content, and peak discharge as the main controls on erosion intensity. These findings can guide bank-protection investment toward the most vulnerable reaches and improve sediment budget estimates used in downstream reservoir management.
Extending the analysis with sub-seasonal Sentinel-2 imagery and deploying continuous turbidity loggers at eroding banks would sharpen the temporal resolution of future assessments [21] .
References
21 in the original paper- Goswami DC. Brahmaputra River, Assam, India: physiography, basin denudation, and channel aggradation. Water Resources Research. 1985;21(7):959-978.
- Sarma JN. Fluvial process and morphology of the Brahmaputra River in Assam, India. Geomorphology. 2005;70(3-4):226-256.
- Milliman JD, Syvitski JPM. Geomorphic/tectonic control of sediment discharge to the ocean. Journal of Geology. 1992;100(5):525-544.
- Thorne CR. Processes and mechanisms of river bank erosion. Gravel-bed Rivers. Wiley, Chichester. 1982;227-271.
- Coleman JM. Brahmaputra River: channel processes and sedimentation. Sedimentary Geology. 1969;3(23):129-239.
- Thieler ER, Himmelstoss EA, Zichichi JL. The Digital Shoreline Analysis System (DSAS) version 4.0. US Geological Survey Open-File Report. 2009;2008-1278.
- Lawler DM. The measurement of river bank erosion and lateral channel change: a review. Earth Surface Processes and Landforms. 1993;18(9):777-821.
- Best JL, Ashworth PJ. Scour in large braided rivers and the recognition of sequence stratigraphic boundaries. Nature. 1997;387(6630):275-277.
- Jain V, Tandon SK. Evidence of large Quaternary fans in the Ganga plain. Current Science. 2003;84(8):10761079.
- Himmelstoss EA, Henderson RE, Kratzmann MG. Digital Shoreline Analysis System (DSAS) version 5.1. US Geological Survey. 2021.
- Thorne CR, Tovey NK. Stability of composite river banks. Earth Surface Processes and Landforms. 1981;6(5):469-484.
- Walling DE, Fang D. Recent trends in the suspended sediment loads of the world's rivers. Global and Planetary Change. 2003;39(1-2):111-126.
- Horowitz AJ. An evaluation of sediment rating curves for estimating suspended sediment concentrations. Hydrological Processes. 2003;17(17):3387-3409.
- Rudra K. Changing river courses in the western part of the Ganga-Brahmaputra delta. Geomorphology. 2014;227:87-100.
- Kummu M, Lu XX, Wang JJ. Basin-wide sediment trapping efficiency of emerging reservoirs along the Mekong. Geomorphology. 2010;119(3-4):181-197.
- Bristow CS. Brahmaputra River: channel migration and deposition. Special Publication of the International Association of Sedimentologists. 1987;6:63-74.
- Darby SE, Thorne CR. Development and testing of riverbank-stability analysis. Journal of Hydraulic Engineering. 1996;122(8):443-454.
- Walling DE. The sediment delivery problem. Journal of Hydrology. 1983;65(1-3):209-237.
- Das TK, Haldar SK, Gupta ID. River bank erosion induced human displacement and its consequences. Living Reviews in Landscape Research. 2014;8(3):135.
- Asselman NEM. Fitting and interpretation of sediment rating curves. Journal of Hydrology. 2000;234(34):228-248.
- Donchyts G, Baart F, Winsemius H. Earth's surface water change over the past 30 years. Nature Climate Change. 2016;6(9):810-813.