
Research article · 2025 · Full text
International Journal of Geography Geology and EnvironmentStructural geology and fracture network analysis of the Guiana shield crystalline basement
Volume 7(4) · Pages 165–168 · DOI: 10.22271/27067483.2025.v7.i4c.555 ↗
Research areasGeological Modeling and AnalysisRock Mechanics and ModelingGroundwater flow and contamination studies
Abstract
Author-writtenCrystalline basement terrains are riddled with fractures, yet the geometry of these discontinuities rarely receives systematic treatment beyond mining camp scale. This research mapped and analysed the fracture network within Archaean-Palaeoproterozoic rocks of the central Guiana Shield, combining remote sensing lineament extraction with field scanline surveys across five lithological units. A total of 1,247 fractures were measured along 14 scanlines, supplemented by 386 lineaments digitised from Landsat 8 panchromatic imagery. Three dominant fracture sets were identified: Set 1 (NE-SW, 045°±12°), Set 2 (NW-SE, 315°±15°), and Set 3 (E-W, 085°±10°). Mean fracture densities ranged from 3.8 m⁻¹ in quartzite to 7.1 m⁻¹ in amphibolite. Aperture-length scaling followed a power-law relationship (exponent = 0.68, R² = 0.74). The NE-SW set dominated fluid conduit potential, as indicated by higher apertures and greater connectivity. These results have implications for groundwater exploration and slope stability assessment in the shield terrain.
Summary
Source-checkedPlain-language reading of the full paper, prepared with AI and checked against the text. Each point links to the authors' own words.
Why it matters
- Analyzing fracture networks in crystalline basement terrains is critical because these fractures control rock mass strength, the migration of ore-fluids, and groundwater flow, which are essential for infrastructure planning. View evidence ↗
- While previous research on the Guiana Shield has examined greenstone belt boundaries and ductile shear zones, the brittle overprint of the region remains poorly documented. View evidence ↗
The question
- The study aimed to identify principal fracture sets, quantify aperture and density statistics across different rock types, and evaluate scaling relationships between aperture and length to inform permeability estimates. View evidence ↗
What they did
- The research was conducted over a 320 km² area in the central Guiana Shield, focusing on exposed Palaeoproterozoic greenstone sequences and Archaean granite-gneiss. View evidence ↗
- The researchers established fourteen 50-meter scanlines on sub-vertical outcrop faces across five different lithological units. View evidence ↗
- The dataset consisted of 1,247 fractures measured via scanlines and 386 lineaments digitized from Landsat 8 panchromatic imagery. View evidence ↗
- The connectivity of the fracture network was analyzed using a node-branch topology approach via the FracPaQ MATLAB toolbox. View evidence ↗
What they found
- Three primary fracture sets were identified: Set 1 (NE-SW, 045°±12°), Set 2 (NW-SE, 315°±15°), and Set 3 (E-W, 085°±10°). View evidence ↗
- Set 1 (NE-SW) was the most dominant set, representing 45.1% of fractures with the highest mean trace length (4.8 m) and mean aperture (3.7 mm). View evidence ↗
- Aperture-length scaling followed a sub-linear power law (exponent = 0.68, R² = 0.74), meaning aperture does not increase proportionally with length. View evidence ↗
- The NE-SW set serves as the primary connected backbone of the network, exhibiting a Y-node frequency of 38.4%, significantly higher than Set 2 (22.1%) and Set 3 (12.7%). View evidence ↗
What it means
- The authors conclude that this dataset establishes a necessary foundation for discrete fracture network (DFN) modeling to support geotechnical assessments and groundwater exploration in the shield terrain. View evidence ↗
- The study is limited by exposure bias, as laterite weathering in the tropical environment hides much of the bedrock, restricting scanline sites to stream cuts. View evidence ↗
Visual summary
3 visualsIllustrations explain the paper; charts are replotted from the paper's own table values.
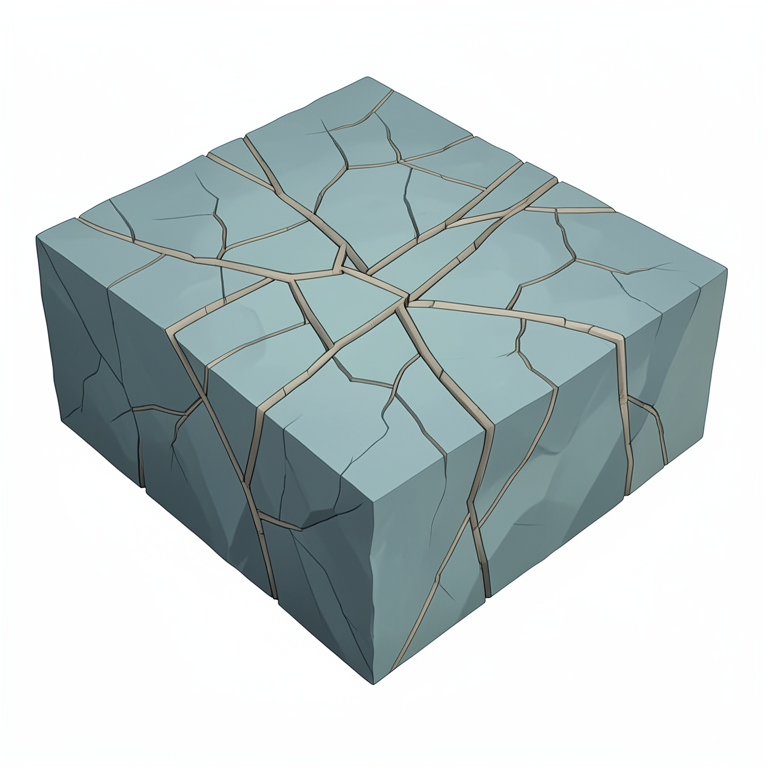
Fracture Network Connectivity
AI-generated conceptual illustration (crystalline basement rock mass of the Guiana shield). It explains the idea and does not show study data.
View source evidence ↗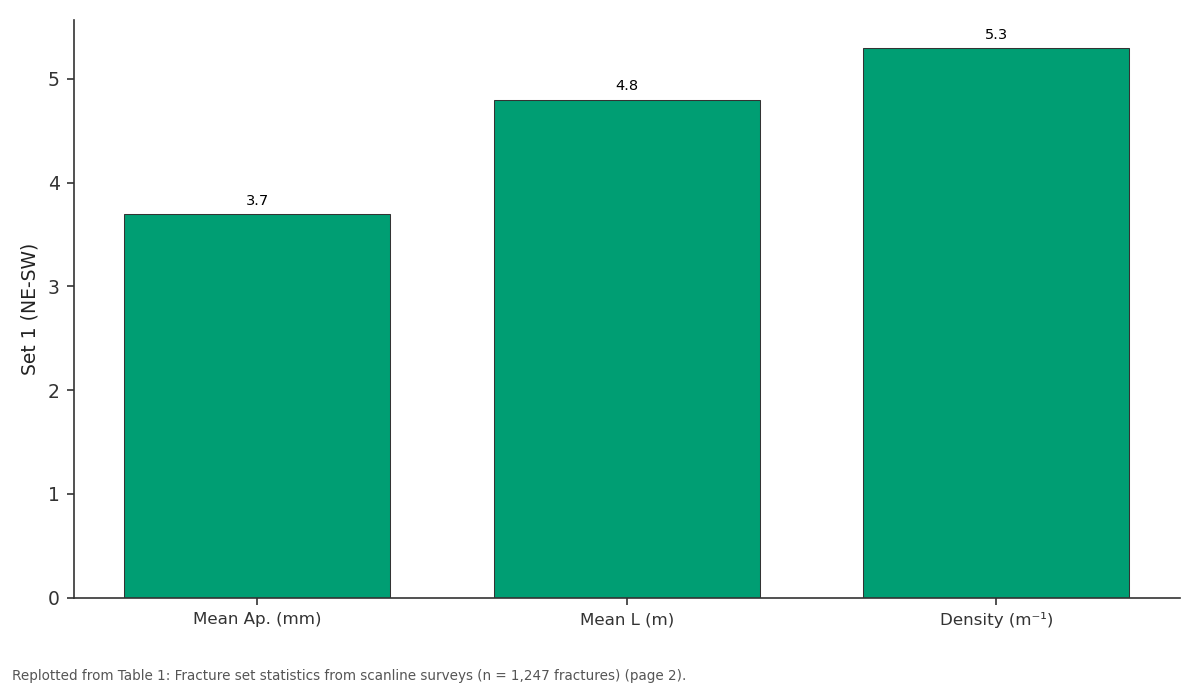
Set 1 (NE-SW): Mean Ap. (mm) vs Mean L (m) vs Density (m⁻¹)
Replotted from Table 1 (page 2) of the original paper. Every bar is the paper's own table value.
View source evidence ↗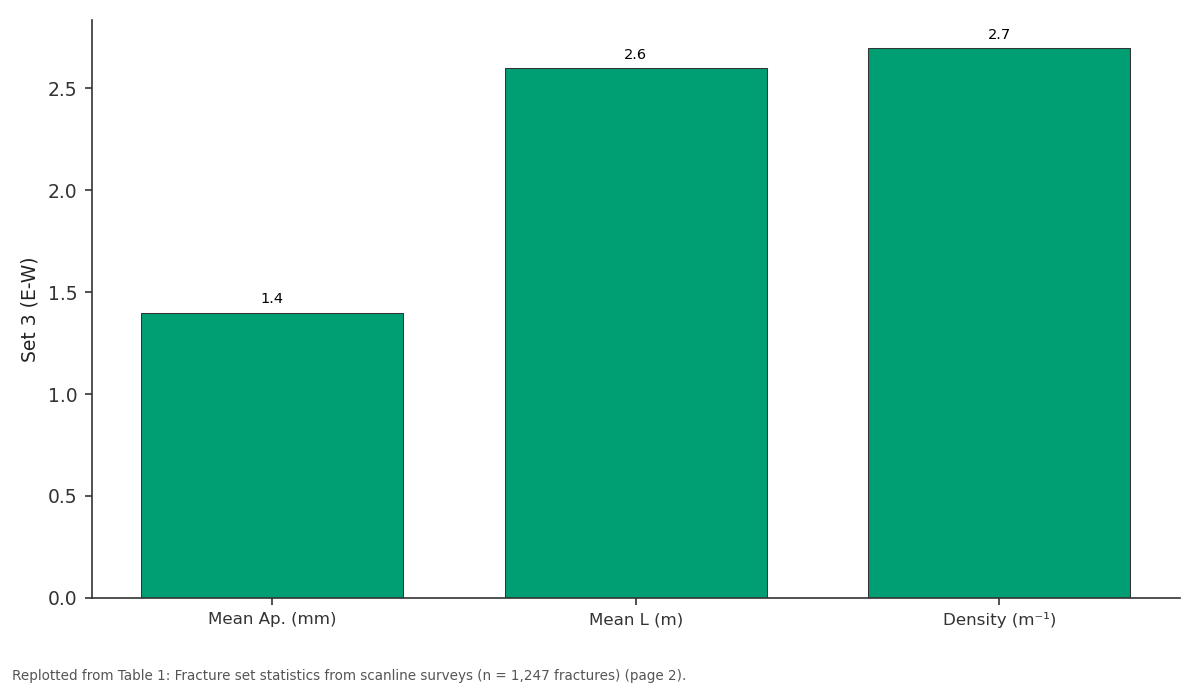
Set 3 (E-W): Mean Ap. (mm) vs Mean L (m) vs Density (m⁻¹)
Replotted from Table 1 (page 2) of the original paper. Every bar is the paper's own table value.
View source evidence ↗Figures & tables
From the original paper Table 1
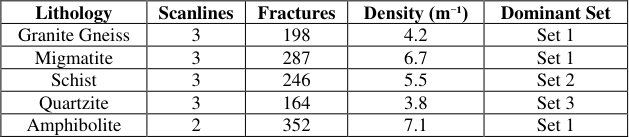 Table 2
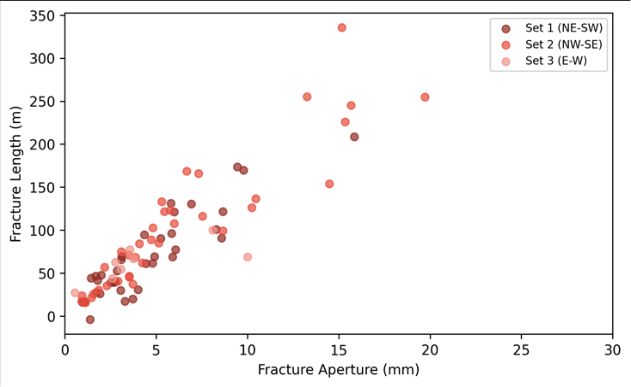 Figure 1
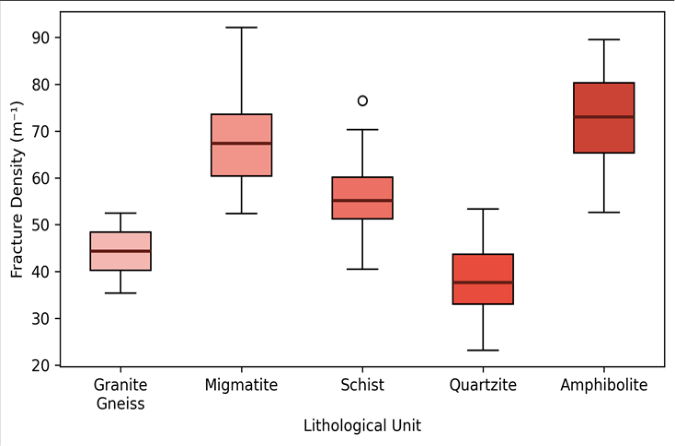 Figure 2
Introduction
The Guiana Shield, one of the oldest continental nuclei on Earth, exposes a Precambrian crystalline basement that records multiple episodes of deformation, metamorphism, and brittle fracturing [1] . Understanding the fracture network in such terrains is far from academic fractures govern groundwater flow, ore-fluid migration, and rock mass strength, all of which matter for infrastructure sited on or within hard-rock substrates [2] . Remote sensing provides a synoptic view of lineaments at scales difficult to cover on foot, but satellite-derived lineaments need ground-truthing through systematic scanline or window mapping [3] . Scanline surveys yield quantitative data on fracture orientation, spacing, aperture, persistence, and roughnessparameters required by discrete fracture network (DFN) models used in hydrogeology and rock engineering [4] . Previous structural work on the Guiana Shield focused largely on ductile shear zones and greenstone belt boundaries, leaving the brittle overprint poorly documented [5] . This research addressed that gap by integrating satellite lineament analysis with detailed field scanline measurements across representative lithologies of the central shield. The goals were to define the principal fracture sets, quantify density and aperture statistics per rock type, and evaluate aperture-length scaling relationships that inform permeability estimates [6] . The field area was chosen because it spans a lithological transect from high-grade gneiss through greenschist-facies units, offering a test of how metamorphic grade affects brittle fracture character.
Research Area Description
The field area covers approximately 320 km² in the central Guiana Shield, where Archaean granite-gneiss and Palaeoproterozoic greenstone sequences are exposed along river cuts and road sections. Elevation ranges from 120 m along the main drainage to 460 m on lateritecapped plateaux. The climate is equatorial humid, with annual rainfall near 2,400 mm, producing deep laterite weathering profiles that locally obscure bedrock. Five lithological units were targeted: granite gneiss, migmatite, quartz-mica schist, quartzite, and amphibolite.
Access was via unpaved logging roads, with most outcrops situated along stream channels where fresh rock is exposed beneath the weathering mantle [7] .
Material and Methods
Material and Methods
Material
Fieldwork was conducted between June and October 2022 through the Institute of Applied Geosciences, Recife. Fourteen scanlines, each 50 m long, were established on sub-vertical outcrop faces representing the five lithological units. Along each scanline, every fracture intersecting the tape was recorded for orientation (dip/dip direction via Brunton compass), trace length, aperture (measured with feeler gauges), infill type, and surface roughness class. Supplementary structural data came from 386 lineaments digitised at 1:50,000 scale from a pan-sharpened Landsat 8 image (15 m resolution, 2021 dry-season acquisition).
Methods
Lineament extraction was performed semi-automatically using the LINE module in PCI Geomatica, followed by manual editing to remove artefacts such as roads and drainage channels [8] . Rose diagrams and equal-area stereonets were plotted in Stereonet v11 to identify fracture set orientations. Fracture density was calculated as the number of fractures per metre of scanline. Aperture-length data were fitted to a power-law model (a = c × L^n) using least-squares regression on log-transformed values. Connectivity was assessed through a node-branch topology analysis in FracPaQ, an open-source MATLAB toolbox [9] . Statistical comparisons between lithological units used Kruskal-Wallis tests at α = 0.05.
Climatic and Environmental Conditions
Field campaigns were timed to the transition from wet to dry season (June-October), when river levels drop and expose fresh outcrop surfaces. Mean daily temperatures during fieldwork ranged from 25 to 33 °C, with relative humidity between 72% and 94%. Rainfall during the campaign totalled 890 mm, concentrated in June and early July. River stage fell by approximately 2.1 m between June and October, progressively uncovering additional scanline sites along channel banks. Set 1 (NE-SW) was the most abundant, accounting for 45.1% of all measured fractures, and carried the largest mean aperture (3.7 mm) and trace length (4.8 m). Set 3 (E-W) was the least developed, with lower apertures and shorter traces (Table 1). The power-law fit (a = 0.42 × L^0.68, R² = 0.74) indicates sub-linear scalingaperture increases more slowly than lengthwhich is typical of mode I fractures in crystalline rock (Figure 1). Set 1 fractures cluster at the high-aperture, long-trace end of the distribution, while Set 3 occupies the lower corner [10] . Amphibolite hosted the highest fracture density (7.1 m⁻¹), likely due to competence contrasts between mafic and felsic layers that promote brittle failure. Quartzite was the least fractured (3.8 m⁻¹), consistent with its massive, homogeneous fabric (Table 2).
| Lithology | Scanlines | Fractures | Density (m⁻¹) | Dominant Set |
|---|---|---|---|---|
| Granite Gneiss | 3 | 198 | 4.2 | Set 1 |
| Migmatite | 3 | 287 | 6.7 | Set 1 |
| Schist | 3 | 246 | 5.5 | Set 2 |
| Quartzite | 3 | 164 | 3.8 | Set 3 |
| Amphibolite | 2 | 352 | 7.1 | Set 1 |
Table text extracted from the original PDF; superscript letters are shown inline. The original table image is below.
View original table image
| Fracture Set | Orientation | Count | Mean Ap. (mm) | Mean L (m) | Density (m⁻¹) |
|---|---|---|---|---|---|
| Set 1 (NE-SW) | 045° ± 12° | 563 | 3.7 | 4.8 | 5.3 |
| Set 2 (NW-SE) | 315° ± 15° | 437 | 2.1 | 3.2 | 4.1 |
| Set 3 (E-W) | 085° ± 10° | 247 | 1.4 | 2.6 | 2.7 |
Table text extracted from the original PDF; superscript letters are shown inline. The original table image is below.
View original table image
Results
Results
Fig 2:
Box plots of fracture density across lithological units Kruskal-Wallis testing confirmed that fracture density differed significantly among lithologies (H = 34.7, p<0.001). Pair-wise comparisons showed that amphibolite and migmatite were statistically indistinguishable but both differed from quartzite (Figure 2).
Comprehensive Interpretation
Node-branch topology analysis revealed that the NE-SW set forms the primary connected backbone of the fracture network, with Y-node (triple junction) frequencies of 38.4% compared to 22.1% for Set 2 and 12.7% for Set 3. This connectivity hierarchy suggests that groundwater flow through the shield basement is preferentially channelled along NE-SW structures, which aligns with borehole yield data reported by regional water agencies [11] .
Discussion
The three fracture sets identified here correspond well with regional tectonic lineaments mapped across the wider shield [12] . Set 1 (NE-SW) parallels the Palaeoproterozoic Trans-Amazonian orogen suture traces, while Set 2 (NW-SE) aligns with conjugate shear directions recorded in the greenstone belts. Set 3 (E-W) may relate to Mesozoic farfield stress transmitted during Atlantic opening, though its subordinate development makes age assignment tentative. The aperture-length scaling exponent of 0.68 sits within the global range of 0.5-1.0 documented for crystalline rocks [13] .
Values below 1.0 imply that longer fractures do not open proportionally, possibly because tip stresses dissipate into damage zones rather than propagating aperture. This has practical consequences: DFN models that assume linear scaling would overpredict permeability for the longest fractures in this system.
A key limitation is the exposure bias inherent in tropical shield settings. Laterite weathering conceals much of the bedrock, and scanline sites are restricted to stream cuts. Future work with borehole televiewer data could sample the fracture population at depth, where weathering effects are absent [14] .
Conclusion
This research documented the fracture network in Archaean-Palaeoproterozoic crystalline basement of the central Guiana Shield using integrated remote sensing and field scanline methods. Three fracture sets were identified, with the NE-SW set (045°) dominating in abundance, aperture, and connectivity. Fracture density varied by lithology, peaking in amphibolite (7.1 m⁻¹) and reaching a minimum in quartzite (3.8 m⁻¹). Aperture-length scaling followed a sublinear power law (exponent = 0.68), indicating that permeability models should not assume proportional scaling. The dataset provides a foundation for discrete fracture network modelling aimed at groundwater exploration and geotechnical assessment in the shield terrain.
References
14 in the original paper- Gibbs AK, Barron CN. The Geology of the Guiana Shield. Oxford University Press, New York. 1993;245 pp.
- National Research Council. Rock Fractures and Fluid Flow: Contemporary Understanding and Applications. National Academies Press, Washington DC. 1996;551 pp.
- Hung LQ, Batelaan O, De Smedt F. Analysis of karst aquifer structure using lineaments extracted from satellite imagery. Hydrogeology Journal. 2005;13(56):839-850.
- Priest SD. Discontinuity Analysis for Rock Engineering. Chapman and Hall, London. 1993;473 pp.
- Delor C, Lahondère D, Egal E. Transamazonian crustal growth and reworking as revealed by the 1:500,000 map of French Guiana. Géologie de la France. 2003;24:5-57.
- Bonnet E, Bour O, Odling NE. Scaling of fracture systems in geological media. Reviews of Geophysics. 2001;39(3):347-383.
- Santos JOS, Hartmann LA, Gaudette HE. A new understanding of the provinces of the Amazon Craton. Gondwana Research. 2000;3(4):453-488.
- Thannoun RG. Automatic extraction and geospatial analysis of lineaments. International Journal of Remote Sensing. 2013;34(18):6433-6452.
- Healy D, Rizzo RE, Cornwell DG. FracPaQ: A MATLAB toolbox for the quantification of fracture patterns. Journal of Structural Geology. 2017;95:1-16.
- Vermilye JM, Scholz CH. The process zone: A microstructural view of fault growth. Journal of Geophysical Research. 1998;103(B6):12223-12237.
- MacDonald AM, Bonsor HC, Dochartaigh BEO. Groundwater quality and quantity in Africa. Environmental Research Letters. 2012;7(2):024009.
- Cordani UG, Sato K. Crustal evolution of the South American platform. Tectonic Evolution of South America. 2000;19-40.
- Olson JE. Joint pattern development: effects of subcritical crack growth and mechanical crack interaction. Journal of Geophysical Research. 1993;98(B7):12251-12265.
- Barton CA, Zoback MD, Moos D. Fluid flow along potentially active faults in crystalline rock. Geology. 1995;23(8):683-686.