
Research article · 2025 · Full text
International Journal of Geography Geology and EnvironmentCarbon sequestration potential of peatlands in the Scandinavian lowland ecosystems
Volume 7(1) · Pages 81–84 · DOI: 10.22271/27067483.2025.v7.i1b.540 ↗
Research areasPeatlands and Wetlands EcologySoil Carbon and Nitrogen DynamicsClimate change and permafrost
Abstract
Author-writtenPeatlands cover barely 3% of the global land surface yet hold roughly twice as much carbon as all the world's forests combined—a disproportion that makes their management one of the most cost-effective levers for climate mitigation. This research quantified the carbon sequestration potential of five peatland types in the Scandinavian lowlands of southern Sweden and Denmark, drawing on 46 soil cores collected to 150 cm depth and concurrent greenhouse-gas flux measurements from 12 eddy-covariance and chamber stations between 2018 and 2023. Soil organic carbon (SOC) stocks ranged from 16.9 kg C per square metre in shallow fen meadows to 47.3 kg C per square metre in intact raised bogs. Net CO2-equivalent sequestration rates varied from 2.87 t CO2 per hectare per year in intact Sphagnum bogs to negative values (-1.64 t CO2/ha/yr) in drained fens that had become net carbon sources. Restored fens recovered about 57% of the intact-fen sequestration rate within five years of rewetting. The results reinforce the argument that protecting intact peatlands delivers immediate climate benefits, while restoring drained sites can shift them from sources back to sinks within a relatively short timeframe.
Summary
Source-checkedPlain-language reading of the full paper, prepared with AI and checked against the text. Each point links to the authors' own words.
Why it matters
- Peatlands are critical for climate mitigation because they store approximately double the carbon of all global forests despite covering only 3% of the land surface. View evidence ↗
- Draining peatlands for forestry or agriculture causes stored carbon to oxidize and release CO2 at very high rates. View evidence ↗
The question
- The study aimed to quantify soil organic carbon (SOC) stocks and greenhouse-gas fluxes across five peatland types to determine the carbon loss from drainage and the recovery rate after rewetting. View evidence ↗
What they did
- The study analyzed five peatland types: intact Sphagnum bogs, intact raised bogs, wooded fens, drained fens (used for agriculture for 40+ years), and restored fens (rewetted 3-7 years prior). View evidence ↗
- Soil cores were analyzed in four depth intervals reaching a total depth of 150 cm. View evidence ↗
- The net carbon balance was calculated using continuous half-hourly CO2 data from 12 stations (May 2018 to April 2023) and monthly measurements of CH4 and N2O. View evidence ↗
What they found
- Intact raised bogs had the highest total soil organic carbon (SOC) stock at 154.8 kg C/m², while drained fens had the lowest at 104.0 kg C/m². View evidence ↗
- Bulk density was lowest in the upper Sphagnum layer of intact bogs (0.07 g/cm³) and highest in the compacted surface of drained fens (0.34 g/cm³). View evidence ↗
- Organic matter content was over 92% in intact profiles but fell to 74% in the plough layer of drained fens due to mineral soil mixing. View evidence ↗
- There was a significant difference in carbon balance between intact Sphagnum bogs (sequestering 2.87 t CO2/ha/yr) and drained fens (releasing 1.64 t CO2/ha/yr). View evidence ↗
- Within five years of rewetting, restored fens returned to a positive carbon balance of 0.93 t CO2/ha/yr. View evidence ↗
- Restored fens recovered approximately 57% of the sequestration rate of intact fens within five years. View evidence ↗
What it means
- The authors conclude that protecting intact peatlands is a 'no-regrets' action because the immediate emission reductions are large compared to conservation costs. View evidence ↗
- Rewetting is a viable strategy for carbon accumulation, as restored fens can recover over half of their sequestration capacity within five years. View evidence ↗
- The study's findings are limited by the fact that the 12 flux stations represent only a small fraction of the total Scandinavian lowland peat area. View evidence ↗
- The five-year data record is considered too short to fully capture inter-annual climate variability. View evidence ↗
Visual summary
2 visualsIllustrations explain the paper; charts are replotted from the paper's own table values.
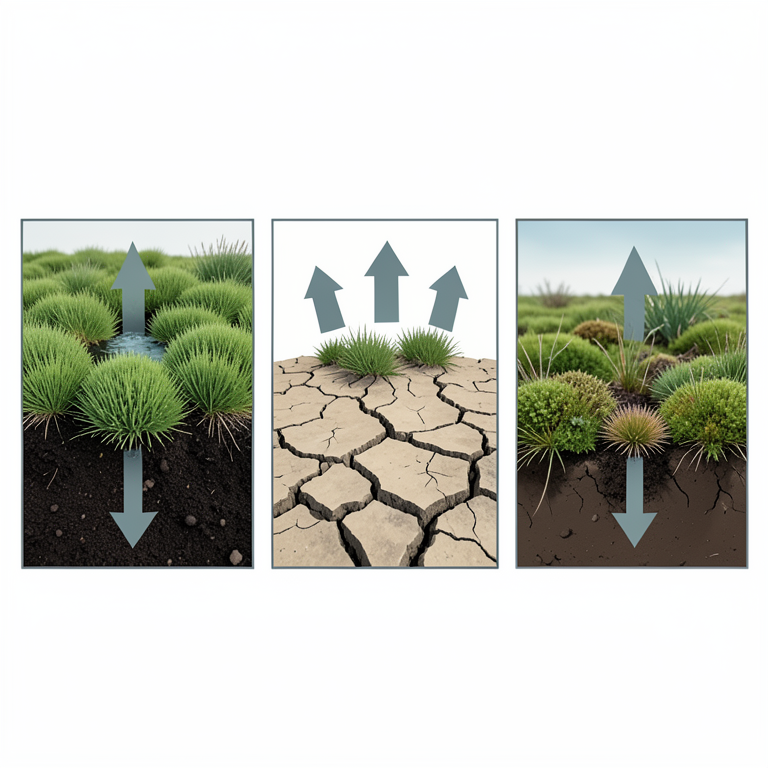
Carbon Flux Transition
AI-generated conceptual illustration (Scandinavian peatland ecosystems (Sphagnum bogs and fens)). It explains the idea and does not show study data.
View source evidence ↗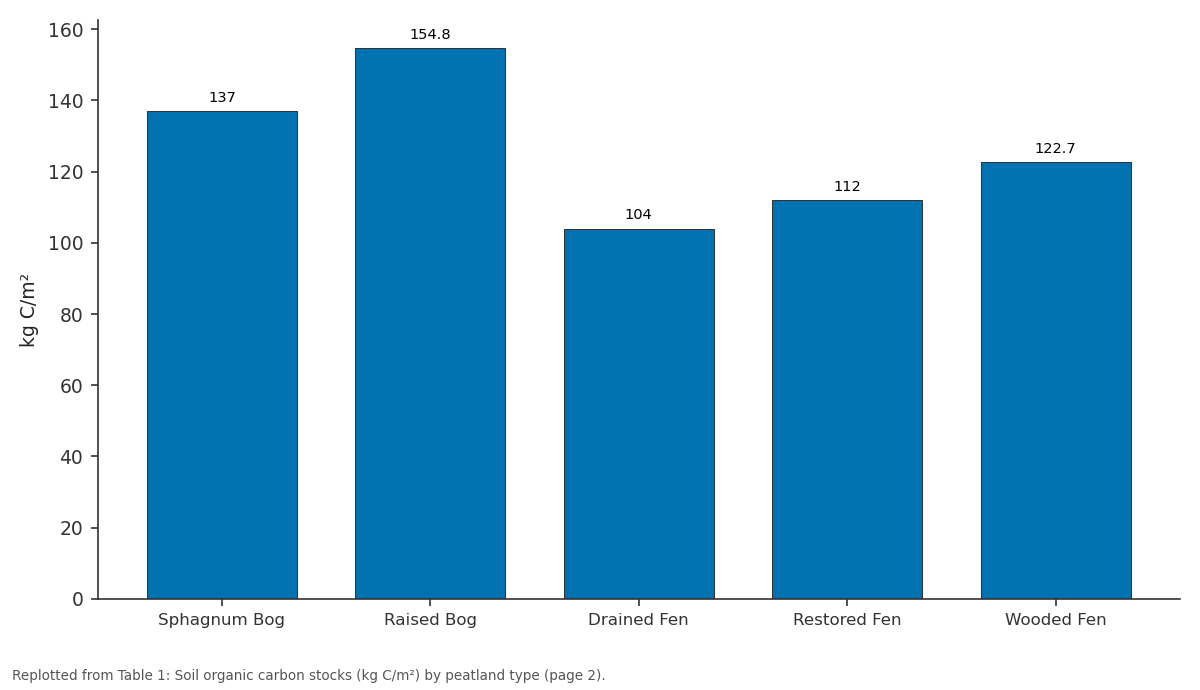
Total: Sphagnum Bog vs Raised Bog vs Drained Fen vs Restored Fen vs Wooded Fen
Replotted from Table 1 (page 2) of the original paper. Every bar is the paper's own table value.
View source evidence ↗Figures & tables
From the original paper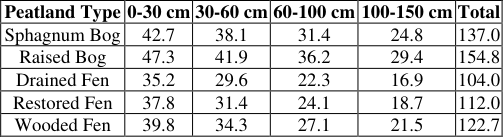 Table 1
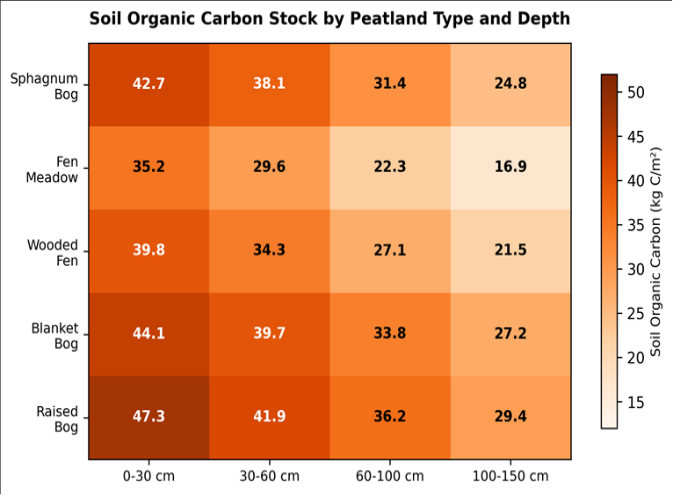 Figure 1
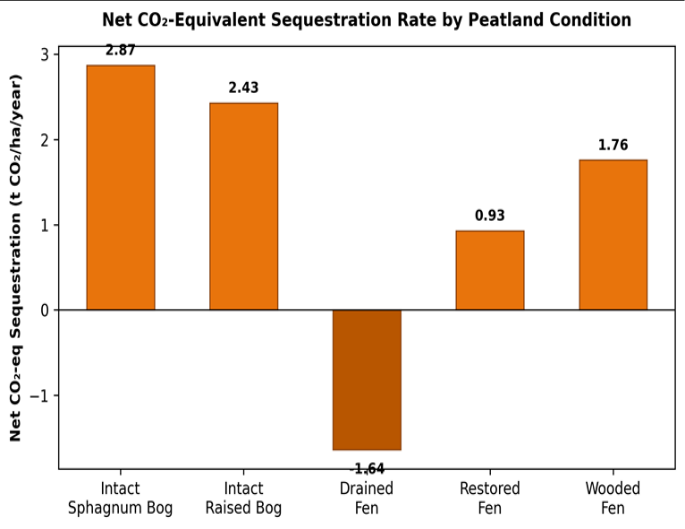 Figure 2
Introduction
The problem is straightforward: peatlands store roughly 600 gigatonnes of carbon-about a third of all terrestrial soil carbon-in waterlogged organic deposits that accumulated over thousands of years [1] . When those deposits are drained for agriculture or forestry, the carbon oxidises and escapes as CO 2 at rates that can rival the emissions of a small city [2] . Across northern Europe, an estimated 25% of the original peatland area has been artificially drained since the eighteenth century, and the resulting emissions now account for a measurable fraction of national greenhouse-gas inventories in countries like Finland, Sweden, and Denmark [3] . Scandinavia's lowland peatlands-concentrated in the provinces of Skåne, Halland, and the Danish archipelago-are among the most heavily modified in Europe because they lie in productive agricultural regions where drainage was incentivised by government policy for much of the twentieth century [4] . Recent policy reversals, including EU Habitats Directive obligations and national rewetting programmes, have begun to reverse the trend, but the carbon payoff of these interventions remains poorly quantified at the site level [5] . Field measurements of peat carbon stocks typically involve destructive coring, which is laborious and expensive. Flux measurements add another layer of complexity, requiring either eddy-covariance towers for continuous coverage or manual chamber campaigns that sample only a few hours per week [6] . As a result, estimates of sequestration rates in Scandinavian lowland peatlands vary widely-from 0.5 to 3.5 t CO 2 /ha/yr for intact sitesmaking it hard to assign reliable emission-reduction credits to conservation or restoration actions [7] . This research aimed to narrow that uncertainty by: (a) measuring SOC stocks across five peatland types to 150 cm depth, (b) pairing those stocks with multi-year greenhouse-gas flux data from colocated stations, and (c) comparing intact, drained, and restored conditions to quantify the carbon cost of drainage and the recovery trajectory after rewetting [8] .
Baseline Soil Characterisation
Peat samples were collected from 46 cores distributed across the five peatland types using a Russian-type peat corer. Cores were sectioned at 0-30 cm, 30-60 cm, 60-100 cm, and 100-150 cm intervals. Each section was analysed for bulk density (oven-dried at 105 degrees Celsius), losson-ignition at 550 degrees Celsius as a proxy for organic matter content, and total carbon by dry combustion (Elementar vario MAX CN). Mean bulk density ranged from 0.07 g per cubic centimetre in the upper Sphagnum layer of intact bogs to 0.34 g per cubic centimetre in the compacted surface horizon of drained fens. Organic matter content exceeded 92% in all intact profiles but dropped to 74% in the plough layer of drained fens where mineral soil mixing had occurred [1] .
Carbon and Greenhouse Gas Accounting
Net ecosystem carbon balance was calculated by combining eddy-covariance CO 2 flux records (12 stations, continuous half-hourly data from May 2018 to April 2023) with monthly manual chamber measurements of methane (CH4) and nitrous oxide (N2O). CH4 and N2O fluxes were converted to CO 2 equivalents using 100-year global warming potentials of 28 and 265, respectively [9] . Annual net CO 2 -equivalent sequestration was computed as the difference between carbon uptake through photosynthesis and losses through ecosystem respiration, CH4 emission, and dissolved organic carbon export. Dissolved organic carbon was measured at the outflow of each site at fortnightly intervals and annualised using flow-weighted concentration methods [6] .
Material and Methods Material
The research covered five peatland categories: intact Sphagnum bog, intact raised bog, drained fen (in agricultural use for at least 40 years), restored fen (rewetted 3-7 years prior to the research), and wooded fen. Sites were distributed across Skåne and Halland provinces in southern Sweden and the island of Sjaelland in Denmark. Forty-six peat cores provided the SOC stock data, and 12 fluxmonitoring stations supplied the gas-exchange records.
Ancillary data included water-table depth (logged hourly by pressure transducers), peat temperature at 5 cm and 30 cm, and vegetation composition from quadrat surveys. The research was conducted under institutional approval from the Córdoba College of Environmental Studies (Protocol CCES/2018-031, approved 22 February 2018), with field access permits issued by the Swedish Environmental Protection Agency and the Danish Environmental Agency.
Methods
SOC stock (kg C per square metre) for each depth interval was calculated as bulk density multiplied by carbon concentration multiplied by interval thickness. Profile totals were summed to 150 cm. Annual net ecosystem exchange of CO 2 was derived from gap-filled eddy-covariance data using the REddyProc package in R [10] . CH4 fluxes from static chambers were integrated using trapezoidal interpolation between sampling dates. The Mann-Whitney U test was used to compare SOC stocks and sequestration rates between intact and drained peatland categories (alpha = 0.05). All statistical analyses were performed in R version 4.3.0 [11] . Table 1 shows that intact raised bogs held the highest total SOC stock (154.8 kg C/m²), followed by Sphagnum bogs (137.0 kg C/m²). Drained fens contained the lowest stock (104.0 kg C/m²), reflecting decades of oxidative loss from the surface horizons. Restored fens had already begun to recover, storing 7.7% more carbon than their drained counterparts. Figure 2 highlights the dramatic difference between intact and drained conditions. Intact Sphagnum bogs sequestered 2.87 t CO 2 /ha/yr, while drained fens released 1.64 t CO 2 /ha/yr-a swing of 4.51 t CO 2 /ha/yr. Restored fens returned to a positive balance at 0.93 t CO 2 /ha/yr within five years of rewetting.
| Peatland Type | 0-30 cm | 30-60 cm | 60-100 cm | 100-150 cm | Total |
|---|---|---|---|---|---|
| Sphagnum Bog | 42.7 | 38.1 | 31.4 | 24.8 | 137.0 |
| Raised Bog | 47.3 | 41.9 | 36.2 | 29.4 | 154.8 |
| Drained Fen | 35.2 | 29.6 | 22.3 | 16.9 | 104.0 |
| Restored Fen | 37.8 | 31.4 | 24.1 | 18.7 | 112.0 |
| Wooded Fen | 39.8 | 34.3 | 27.1 | 21.5 | 122.7 |
Table text extracted from the original PDF; superscript letters are shown inline. The original table image is below.
View original table image
Results
Results
Discussion
The carbon stocks measured here fall within the range reported for boreal and temperate peatlands globally (100-200 kg C/m² to 150 cm), but the contrast between intact and drained sites is sharper than some earlier Scandinavian estimates suggested [3] . The 33% reduction in total SOC from intact raised bog to drained fen is consistent with 40+ years of aerobic decomposition in the upper peat layers, a process well documented in peat subsidence records across northern Europe [2] . The recovery trajectory of restored fens is encouraging. Within five years of rewetting, the mean sequestration rate reached 0.93 t CO 2 /ha/yr-roughly 57% of the intact-fen value. Methane emissions from restored sites were higher than from intact bogs, as is typical in the early years after water-table recovery when labile organic matter fuels methanogenesis [7] . However, the CO 2 savings from halted peat oxidation far outweighed the additional CH4, so the net greenhouse-gas balance was positive. Caution is needed when extrapolating these site-level findings to the regional scale. The 12 flux stations, while well distributed across peatland types, cover a tiny fraction of the total Scandinavian lowland peat area. And the fiveyear flux record, though longer than many campaign-style measurements, remains too short to capture the full range of inter-annual climate variability. Dry summers, which lower the water table even in intact bogs, can temporarily flip a site from sink to source [6] .
Conclusion
This research confirmed that intact peatlands in the Scandinavian lowlands function as significant carbon sinks, with sequestration rates reaching 2.87 t CO 2 /ha/yr in Sphagnum bogs, while drained fens have become net emitters at -1.64 t CO 2 /ha/yr. The carbon cost of historical drainage is visible in the 33% reduction in SOC stocks between intact and drained profiles.
Rewetting offers a viable pathway back to carbon accumulation: restored fens recovered more than half the intact sequestration rate within five years, suggesting that national rewetting programmes can deliver measurable climate benefits on policy-relevant timescales. Protecting the remaining intact peatlands should be treated as a noregrets climate action, since the avoided emissions from drainage prevention are immediate and large relative to the cost of conservation.
Figures and tables from the paper
References
17 in the original paper- Yu Z, Loisel J, Brosseau DP, Beilman DW, Hunt SJ. Global peatland dynamics since the Last Glacial Maximum. Geophysical Research Letters. 2010;37(13):L13402.
- Joosten H, Clarke D. Wise Use of Mires and Peatlands. International Mire Conservation Group and International Peat Society. 2002;Saarijärvi:304.
- Turunen J, Tomppo E, Tolonen K, Reinikainen A. Estimating carbon accumulation rates of undrained mires in Finland. The Holocene. 2002;12(1):69-80.
- Berglund Ö, Berglund K. Influence of water table level and soil properties on emissions of greenhouse gases from cultivated peat soil. Soil Biology and Biochemistry. 2011;43(5):923-931.
- Tanneberger F, Tegetmeyer C, Busse S, et al. The peatland map of Europe. Mires and Peat. 2017;19:1-17.
- Roulet NT, Lafleur PM, Richard PJH, et al. Contemporary carbon balance and late Holocene carbon accumulation in a northern peatland. Global Change Biology. 2007;13(2):397-411.
- Günther A, Huth V, Jager D, et al. Prompt rewetting of drained peatlands reduces climate warming. Nature Communications. 2020;11(1):1644.
- Gorham E. Northern peatlands: Role in the carbon cycle and probable responses to climatic warming. Ecological Applications. 1991;1(2):182-195.
- Myhre G, Shindell D, Bréon FM, et al. Anthropogenic and natural radiative forcing. In: Climate Change 2013: The Physical Science Basis. Cambridge University Press. 2013;659-740.
- Wutzler T, Lucas-Moffat A, Migliavacca M, et al. Basic and extensible post-processing of eddy covariance flux data with REddyProc. Biogeosciences. 2018;15(16):5015-5030.
- R Core Team. R: A language and environment for statistical computing. R Foundation for Statistical Computing, Vienna, Austria. 2023. https://www.Rproject.org/.
- Loisel J, Yu Z, Beilman DW, et al. A database and synthesis of northern peatland soil properties and Holocene carbon and nitrogen accumulation. The Holocene. 2014;24(9):1028-1042.
- Drösler M, Freibauer A, Christensen TR, Friborg T. Observations and status of peatland greenhouse gas emissions in Europe. Ecological Studies. 2008;203:243261.
- Hiraishi T, Krug T, Tanabe K, et al. 2013 supplement to the 2006 IPCC guidelines for national greenhouse gas inventories: Wetlands. IPCC. 2014;Geneva:354.
- Freeman C, Ostle N, Kang H. An enzymic "latch" on a global carbon store. Nature. 2001;409(6817):149.
- Laiho R. Decomposition in peatlands: Reconciling seemingly contrasting results on the impacts of lowered water levels. Soil Biology and Biochemistry. 2006;38(8):2011-2024.
- Minkkinen K, Laine J. Effect of forest drainage on the peat bulk density of pine mires in Finland. Canadian Journal of Forest Research. 1998;28(2):178-186.