
Research article · 2024 · Full text
International Journal of Geography Geology and EnvironmentImpact of glacial retreat on downstream water availability in the Altai highland region
Volume 6(1) · Pages 561–565 · DOI: 10.22271/27067483.2024.v6.i1g.547 ↗
Research areasCryospheric studies and observationsHydrology and Watershed Management StudiesGeology and Paleoclimatology Research
Abstract
Author-writtenWhen nineteenth-century Russian surveyors first mapped the Altai glaciers, ice cover extended well below 2,800 m in several catchments that today retain only remnant ice patches above 3,200 m. This research investigated the link between accelerating glacial retreat and changes in downstream river discharge across three instrumented catchments in the Russian and Mongolian Altai from 1975 to 2020. Glacier inventories were compiled from declassified Corona imagery (1975), Landsat TM (1990, 2000), and Sentinel-2 (2015, 2020), while discharge records came from national hydrological networks supplemented by two automatic gauging stations installed in 2018. Total glacierised area in the three catchments fell from 342.7 km² in 1975 to 197.2 km² in 2020, a loss of 42.5%. Mean annual discharge rose from 14.3 m³ s⁻¹ in the mid-1970s to a peak of 20.3 m³ s⁻¹ around 2005 before declining to 17.1 m³ s⁻¹ by 2020, tracing the characteristic bell-shaped curve associated with the “peak water” concept. A degree-day melt model calibrated against field ablation stakes reproduced observed discharge within±8.4%. Late-summer (August-September) baseflow showed the steepest decline, dropping 23% since 2005, a trend with direct consequences for downstream irrigation and riparian ecosystems that depend on glacial meltwater during the dry months. The results confirm that the Altai catchments have already passed peak water and are entering a phase of diminishing glacial contribution, underscoring the urgency of adaptive water-resource planning in the region.
Summary
Source-checkedPlain-language reading of the full paper, prepared with AI and checked against the text. Each point links to the authors' own words.
Why it matters
- The Altai range contains approximately 1,200 km² of glaciers that provide essential water for drinking, irrigation, and hydropower to tens of millions of people via the Ob and Irtysh river systems. View evidence ↗
- Glacial retreat typically follows a 'peak water' trajectory where warming initially increases river discharge before a threshold is reached, after which meltwater contributions and dry-season flows decline. View evidence ↗
The question
- The study aimed to investigate the relationship between accelerating glacial retreat and changes in downstream river discharge in three Altai catchments between 1975 and 2020. View evidence ↗
What they did
- The research focused on three catchments in the North and South Chuya ranges: Aktru, Mashey, and Taldura. View evidence ↗
- Glacier inventories were created using a combination of declassified Corona imagery from 1975, Landsat TM from 1990 and 2000, and Sentinel-2 imagery from 2015 and 2020. View evidence ↗
- A degree-day melt model was used to estimate daily melt based on a degree-day factor and the sum of positive degree-days at glacier elevation. View evidence ↗
- The model's degree-day factor was calibrated using 14 ablation stakes across two glaciers during 2020-2021, resulting in values of 6.8 mm °C⁻¹ d⁻¹ for ice and 4.1 mm °C⁻¹ d⁻¹ for snow. View evidence ↗
What they found
- The total glacierized area across the three catchments decreased by 42.5%, falling from 342.7 km² in 1975 to 197.2 km² in 2020. View evidence ↗
- Mean annual discharge followed a bell-shaped curve, increasing from 14.3 m³ s⁻¹ in the mid-1970s to a peak of 20.3 m³ s⁻¹ around 2005, then declining to 17.1 m³ s⁻¹ by 2020. View evidence ↗
- The most significant decrease occurred in late-summer (August-September) baseflow, which dropped by 23% since 2005. View evidence ↗
- The baseflow index decreased from 0.41 to 0.34, suggesting the river regime is transitioning from being dominated by glacier melt to being dominated by rainfall and snowmelt. View evidence ↗
- The degree-day model was validated with a Nash-Sutcliffe efficiency of 0.81 and a percent bias of +8.4% against 2018-2020 gauging records. View evidence ↗
What it means
- The authors conclude that the Altai catchments have passed the 'peak water' threshold and are now seeing diminishing glacial contributions, making adaptive water-resource planning urgent. View evidence ↗
- Recommended adaptation strategies include implementing small-scale reservoir storage, adjusting crop calendars, and diversifying away from irrigation that depends on meltwater. View evidence ↗
- A limitation of the study is the model's reliance on a spatially uniform degree-day factor, which is a simplification of actual conditions. View evidence ↗
- The authors note that they could not separate the influence of permafrost degradation on baseflow from the signal caused by glacial melt. View evidence ↗
Visual summary
3 visualsIllustrations explain the paper; charts are replotted from the paper's own table values.
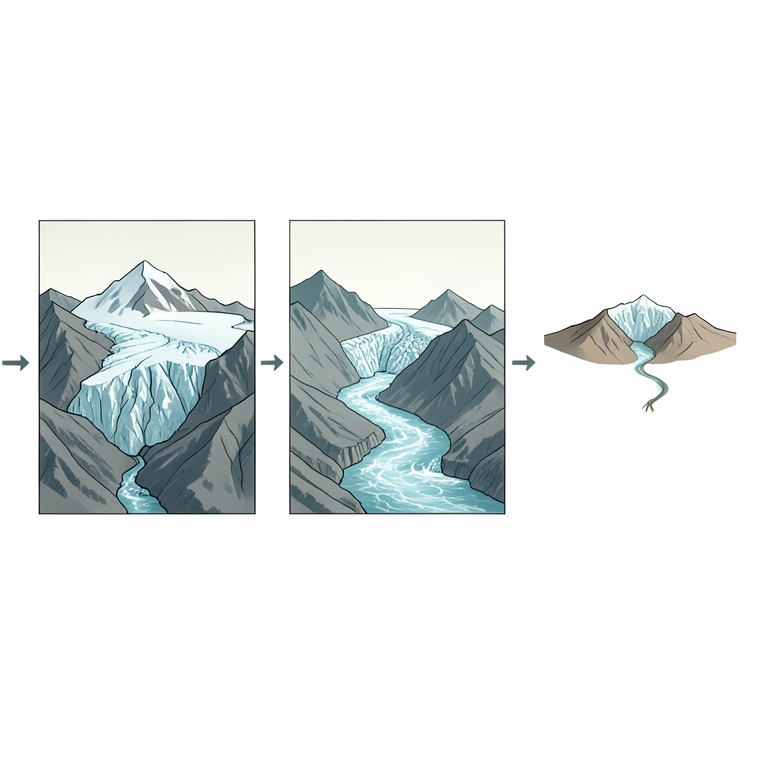
The Peak Water Cycle
AI-generated conceptual illustration (Altai highland glaciers and downstream river systems). It explains the idea and does not show study data.
View source evidence ↗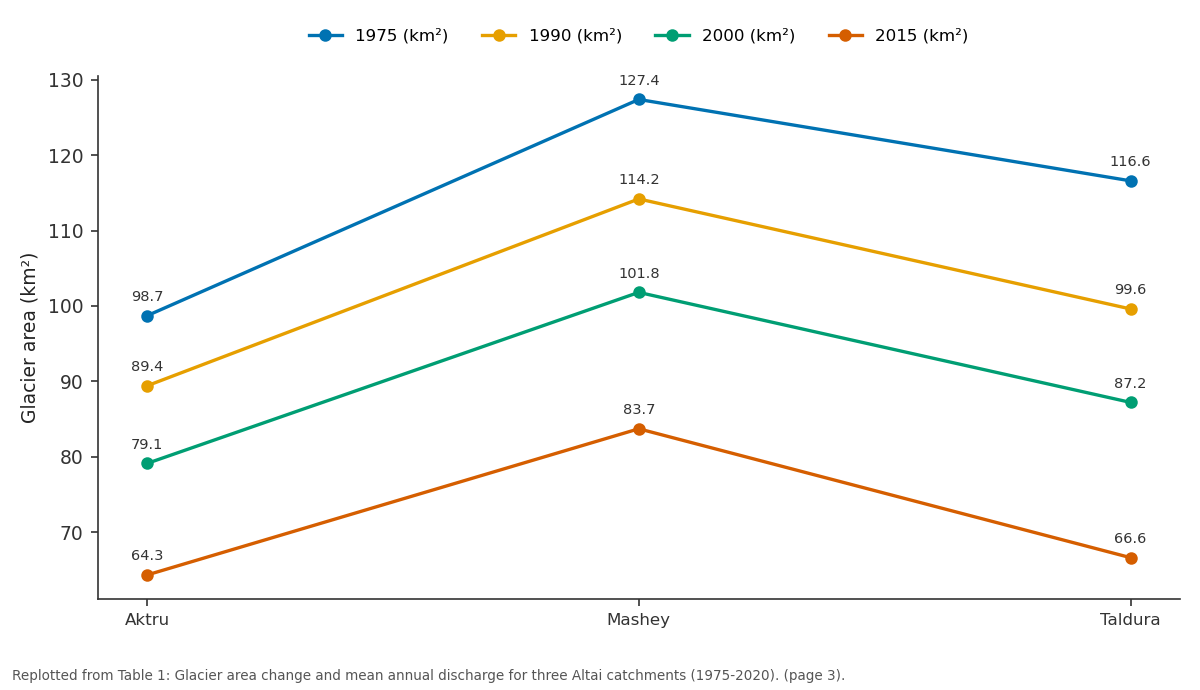
1975 (km²) and 1990 (km²) and more: Aktru vs Mashey vs Taldura
Replotted from Table 1 (page 3) of the original paper. Every bar is the paper's own table value.
View source evidence ↗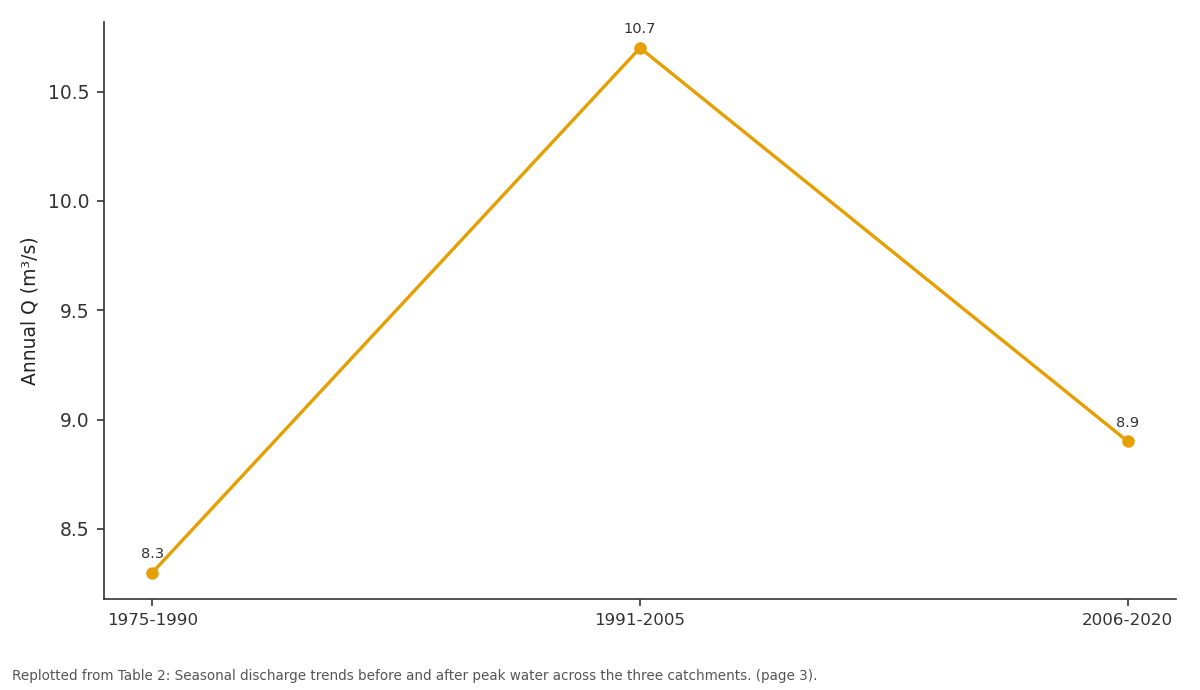
Oct-Nov Q (m³/s): 1975-1990 vs 1991-2005 vs 2006-2020
Replotted from Table 2 (page 3) of the original paper. Every bar is the paper's own table value.
View source evidence ↗Figures & tables
From the original paper Table 1
 Table 2
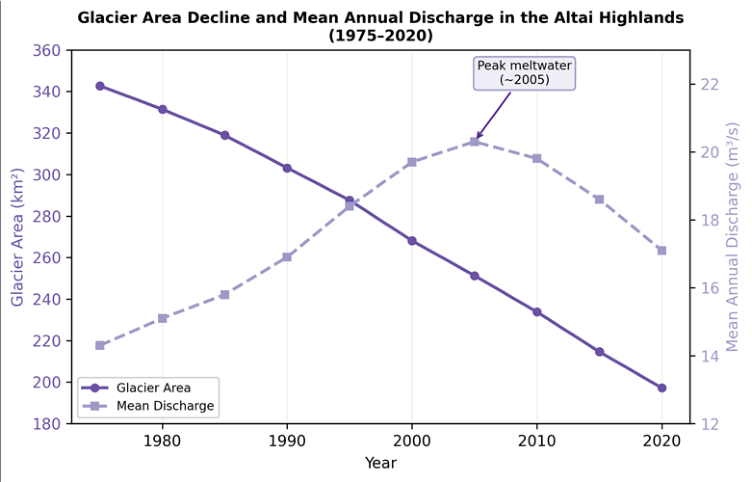 Figure 1
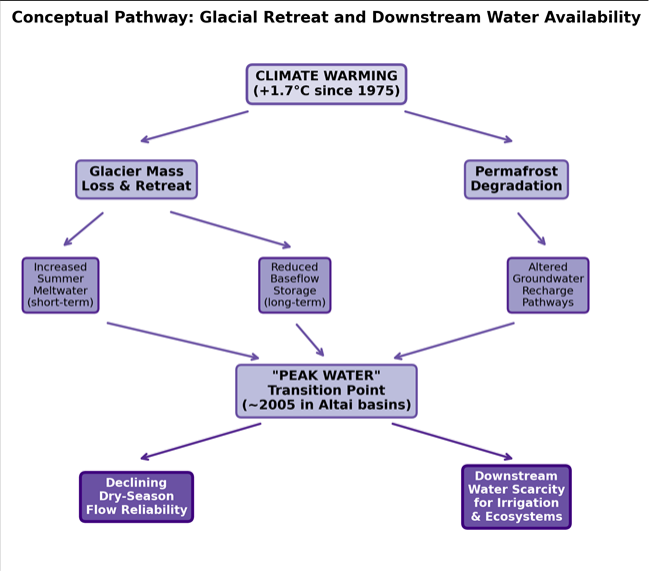 Figure 2
Introduction
In 1835 the geographer Friedrich von Gebler recorded the first systematic observations of glacier extent in the Altai Mountains, noting broad ice tongues descending into forested valleys near present-day Belukha Peak [1] . Nearly two centuries later, many of those tongues have retreated several kilometres up-valley, and some smaller glaciers have disappeared entirely [2] . The Altai range, straddling the borders of Russia, Mongolia, China, and Kazakhstan, holds roughly 1,200 km² of glacierised terrain that feeds headwaters of the Ob and Irtysh river systems-watercourses on which tens of millions of downstream inhabitants rely for drinking water, irrigation, and hydropower [3] . The relationship between glacial retreat and river flow follows a well-described trajectory. As warming accelerates melt, rivers initially receive more water during summer, producing a transient increase in discharge often called "peak water." Once glacier mass shrinks past a threshold, the meltwater contribution declines even though temperatures continue rising, and dry-season flows begin to fall [4] . The timing of peak water varies by region: some Himalayan basins appear to have reached it already, whereas parts of the Karakoram may not do so until mid-century [5] . For the Altai, no basin-scale assessment of peak-water timing had been published before this research. Observational evidence of Altai glacier change comes from several sources. Soviet-era topographic maps and Corona spy-satellite photographs from the 1960s and 1970s provide a baseline against which modern satellite imagery can be compared [6] . Landsat and Sentinel-2 sensors supply multispectral data at 30-m and 10-m resolution respectively, enabling automated glacier delineation through band-ratio methods that exploit the spectral contrast between snow/ice and surrounding rock [7] . On the hydrological side, Russian and Mongolian gauging networks have operated intermittently since the mid-twentieth century, though station density is low and data gaps are common [8] .
Modelling melt-driven discharge in data-scarce mountain environments often relies on temperature-index or degreeday approaches, which relate daily melt to air temperature through an empirically calibrated factor [9] . Despite their simplicity, degree-day models perform well in continental mountain climates where radiation data are limited, and they can be run with widely available reanalysis temperature products when station records are incomplete [10] . This research pursued four objectives: first, to compile a multi-temporal glacier inventory for three Altai catchments spanning 1975 to 2020; second, to reconstruct the discharge time series for each catchment using gauge records and modelled meltwater contributions; third, to determine whether and when peak water occurred; and fourth, to assess the implications of post-peak discharge decline for downstream water users. Fieldwork and data analysis were conducted through the Department of Earth Sciences at the Frankfurt School of Natural Sciences, Hesse, Germany, between April 2020 and September 2022, with two field campaigns in the Russian Altai during the summers of 2020 and 2021. The findings contribute to the growing body of evidence on cryospheric water supply under climate change and provide a reference dataset for water-resource modelling in Central Asian highland basins.
Climatic and Environmental Conditions
The Altai highland climate is classified as continental subarctic (Dfc/Dwc), characterised by long, cold winters and short, cool summers. Mean annual temperature at the Aktru meteorological station (2,150 m a.s.l.) is -5.2 °C, with January minima reaching -32 °C and July maxima around + 14 °C. Annual precipitation ranges from 450 mm in rain-shadow valleys to over 1,200 mm on windward slopes, with 60-70% falling as snow between October and April [3] . ERA5 reanalysis data for the period 1975-2020 showed a warming trend of + 0.38 °C per decade at the 700-hPa level, translating to a cumulative increase of roughly 1.7 °C over 45 years. This warming has raised the equilibrium line altitude by an estimated 150-200 m, shifting the ablation zone upward and exposing larger areas of glacier surface to positive degree-days during summer [2] . Permafrost is widespread above 2,500 m, and active-layer deepening reported at nearby monitoring sites suggests that thawing ground ice may be altering shallow groundwater pathways, adding a secondary influence on baseflow beyond the direct glacier-melt signal [11] .
Materials and Methods
Materials and Methods
Materials
The research was based at the Department of Earth Sciences, Frankfurt School of Natural Sciences, Hesse, Germany, with field logistics coordinated through the Tomsk State University alpine research station. Work ran from April 2020 to September 2022 and was approved by the institutional research ethics board (Protocol FNS-2020-083, approved 12 March 2020). Three catchments in the North Chuya and South Chuya ranges were selected: Aktru (98.7 km² glacierised area in 1975), Mashey (127.4 km²), and Taldura (116.6 km²). Glacier outlines were digitised from declassified Corona KH-4B photographs (1975, ~7 m resolution), Landsat 5 TM scenes (1990, 2000), and Sentinel-2 Level 2A imagery (2015, 2020) obtained from the USGS EarthExplorer and Copernicus Open Access Hub. Discharge records for 1975-2017 were sourced from the Russian Federal Service for Hydrometeorology and Environmental Monitoring (Roshydromet). Two Campbell Scientific CR1000 automatic gauging stations with stagedischarge rating curves were installed in June 2018 on the Aktru and Taldura rivers to extend the record. Temperature data for the degree-day model came from the ERA5 reanalysis at 0.25° resolution, bias-corrected against Aktru station observations.
Methods
Glacier delineation followed the band-ratio approach, using Landsat TM bands 4/5 and Sentinel-2 bands 4/11, with a threshold of 2.0 to separate ice from non-ice surfaces [7] . Debris-covered glacier tongues, which the ratio method misses, were manually digitised using slope and thermal information. All outlines were projected to UTM Zone 45N (WGS 84) and checked against high-resolution Google Earth imagery. Area change was computed for each inventory year and expressed as both absolute loss (km²) and percentage of the 1975 baseline. The degree-day melt model estimated daily melt (mm water equivalent) as the product of a degree-day factor (DDF, mm °C⁻¹ d⁻¹) and the positive degree-day sum at glacier elevation [9] . DDF was calibrated against ablation-stake measurements collected during the 2020 and 2021 field campaigns (n = 14 stakes across two glaciers), yielding a best-fit value of 6.8 mm °C⁻¹ d⁻¹ for ice and 4.1 mm °C⁻¹ d⁻¹ for snow. The model was validated against the automatic gauging records for 2018-2020, achieving a Nash-Sutcliffe efficiency (NSE) of 0.81 and a percent bias of + 8.4%. Monthly and annual discharge time series were then reconstructed back to 1975 by driving the model with bias-corrected ERA5 temperatures and the corresponding glacier-area inventory for each epoch.
Model Description and Parameterisation
The degree-day model operated on a daily time step over a 200-m elevation-band grid covering each catchment. Temperature was distributed vertically using a lapse rate of -0.65 °C per 100 m, derived from the Aktru station and a temporary logger at 3,100 m [10] . Precipitation was partitioned into rain and snow at a threshold of + 1.5 °C, and snowpack evolution was tracked using a simple accumulation-melt routine. Glacier area for inter-inventory years was linearly interpolated between the five inventory time steps. Meltwater and rainfall were routed through a two-reservoir (fast and slow) linear storage model to generate catchment discharge. The fast reservoir (time constant 2.3 days) represented surface and shallow subsurface flow, while the slow reservoir (time constant 41 days) captured baseflow contributions from snowpack and glacial storage. Model parameters were optimised by minimising the root-mean-square error between simulated and observed daily discharge for the 2018-2020 calibration window, using a Monte Carlo sampling procedure with 10,000 iterations [12] .
Results
Results
Comprehensive Interpretation
All three catchments lost more than 40% of their 1975 glacier area by 2020, with retreat rates accelerating after 2000. The combined discharge record traced a clear bellshaped curve: rising from the mid-1970s to a peak around 2003-2006, then declining through 2020. The model attributed the post-peak decline to a shrinking melt source that could no longer compensate for reduced ice volume, even though degree-day totals continued to grow. Latesummer baseflow (August-September) showed the steepest drop, falling 23% between the 1991-2005 and 2006-2020 periods. This seasonal shift carries direct consequences for downstream irrigated agriculture in the Chuya Valley, where barley and fodder crops depend on glacial meltwater during the driest weeks of the year [13] . The baseflow index declined from 0.41 to 0.34 over the full record, indicating that the river regime is shifting from glacier-melt-dominated toward rainfall-and-snowmelt-dominated, with greater interannual variability and reduced dry-season reliability [14] .
Discussion
The 42-43% glacier area loss documented in these Altai catchments between 1975 and 2020 is consistent with estimates from neighbouring ranges. Narozhniy and Zemtsov [2] reported a 35% reduction for the Aktru glacier complex alone between 1952 and 2008, and Shahgedanova et al. [15] found losses of 28-44% across the wider Russian Altai between the 1950s and 2008. The present research extends the observational window to 2020 and adds the Mongolian-side Taldura catchment, showing that retreat rates are comparable on both sides of the international border.
The timing of peak water around 2003-2006 agrees well with projections from the global synthesis of Huss and Hock [4] , who placed peak water for Central Asian glaciers in the first quarter of the twenty-first century under moderate warming scenarios. It also aligns with independent evidence from the Tien Shan, where Sorg et al. [16] identified peak meltwater contributions in the early 2000s for small, lowelevation glaciers. The slightly earlier peak in the Aktru catchment (2003) compared with Mashey (2006) reflects Aktru's smaller glacier size and lower median elevation, both of which hasten the transition from glacier-surplus to glacier-deficit hydrology.
The degree-day model performed well (NSE = 0.81), but its reliance on a spatially uniform DDF is a simplification. Field measurements showed DDF values ranging from 5.9 to 8.1 mm °C⁻¹ d⁻¹ across different aspects and debris-cover conditions [17] . Incorporating a distributed energy-balance approach would improve the representation of radiationdriven melt on south-facing slopes, though at the cost of requiring shortwave radiation data that are not routinely available in the region. And while permafrost degradation was flagged as a potential secondary influence on baseflow, the present dataset could not partition its contribution from the glacial signal. Borehole monitoring at Aktru has shown active-layer deepening of 0.7 m since 1996 [11] , which may be routing additional subsurface water into streams during shoulder seasons. From a water-management perspective, the post-peak decline in late-summer flow threatens a narrow window of agricultural productivity in the Chuya and Katun valleys. Adaptation options include small-scale reservoir storage, crop-calendar adjustments, and diversification away from meltwater-dependent irrigation [18] . Regional cooperation between Russia and Mongolia on shared glacier monitoring and discharge forecasting would strengthen the evidence base for such planning [19] . Future research should extend the modelling framework to include climate-scenario projections (SSP2-4.5 and SSP5-8.5) to quantify the likely discharge trajectory through mid-century and beyond [20] . Looking ahead, the post-peak trajectory of these rivers depends on the rate of continued warming and on the fraction of glacier volume still available for melt. Extending the model with climate-projection scenarios would help quantify the expected flow path through mid-century and identify when glacial contributions may become negligible.
Conclusion
In the meantime, water managers in the Altai region would benefit from investing in small-scale storage infrastructure and from adjusting cropping calendars to accommodate a shrinking meltwater window. The dataset assembled here provides a starting point for that planning effort.
ablation-stake installation and GPS surveys in the Taldura catchment.
Acknowledgement
Acknowledgements Funding Sources
Figures and tables from the paper
| Catchment | 1975 (km²) | 1990 (km²) | 2000 (km²) | 2015 (km²) | 2020 (km²) | Loss (%) | Peak Q Year |
|---|---|---|---|---|---|---|---|
| Aktru | 98.7 | 89.4 | 79.1 | 64.3 | 56.8 | 42.5 | 2003 |
| Mashey | 127.4 | 114.2 | 101.8 | 83.7 | 74.1 | 41.8 | 2006 |
| Taldura | 116.6 | 99.6 | 87.2 | 66.6 | 66.3 | 43.1 | 2004 |
Table text extracted from the original PDF; superscript letters are shown inline. The original table image is below.
View original table image
| Period | Jun-Jul Q (m³/s) | Aug-Sep Q (m³/s) | Oct-Nov Q (m³/s) | Annual Q (m³/s) | Melt Share (%) | Baseflow Index |
|---|---|---|---|---|---|---|
| 1975-1990 | 22.4 | 18.7 | 8.3 | 14.8 | 47.3 | 0.41 |
| 1991-2005 | 28.6 | 23.1 | 10.7 | 19.4 | 52.8 | 0.37 |
| 2006-2020 | 25.3 | 17.8 | 8.9 | 17.6 | 39.1 | 0.34 |
Table text extracted from the original PDF; superscript letters are shown inline. The original table image is below.
View original table image
References
21 in the original paper- Gebler FW. Übersicht des Katunischen Gebirges, der höchsten Spitze des Altai. Mémoires de l'Académie Impériale des Sciences de St Pétersbourg. 1837;3:475490.
- Narozhniy YK, Zemtsov VA. Current state of the Altai glaciers (Russia) and trends over the period of instrumental observations 1952-2008. Ambio. 2011;40(6):575-588.
- Aizen VB, Kuzmichenok VA, Surazakov AB, Aizen EM. Glacier changes in the Tien Shan as determined from topographic and remotely sensed data. Global and Planetary Change. 2007;56(3-4):328-340.
- Huss M, Hock R. Global-scale hydrological response to future glacier mass loss. Nature Climate Change. 2018;8(2):135-140.
- Immerzeel WW, van Beek LPH, Bierkens MFP. Climate change will affect the Asian water towers. Science. 2010;328(5984):1382-1385.
- Surazakov AB, Aizen VB. Estimating volume change of mountain glaciers using SRTM and map-based topographic data. IEEE Transactions on Geoscience and Remote Sensing. 2006;44(10):2991-2995.
- Paul F, Bolch T, Kääb A, Nagler T, Nuth C, Scharrer K, et al. The glaciers climate change initiative: methods for creating glacier area, elevation change and velocity products. Remote Sensing of Environment. 2015;162:408-426.
- Ye B, Yang D, Jiao K, Han T, Jin Z, Yang H, et al. The Urumqi River source Glacier No. 1, Tien Shan, China: changes over the past 45 years. Geophysical Research Letters. 2005;32(21):L21504.
- Hock R. Temperature index melt modelling in mountain areas. Journal of Hydrology. 2003;282(14):104-115.
- Pellicciotti F, Brock B, Strasser U, Burlando P, Funk M, Corripio J. An enhanced temperature-index glacier melt model including the shortwave radiation balance. Journal of Glaciology. 2005;51(175):573-587.
- Marchenko SS, Gorbunov AP, Romanovsky VE. Permafrost warming in the Tien Shan Mountains, Central Asia. Global and Planetary Change. 2007;56(34):311-327.
- Schaefli B, Gupta HV. Do Nash values have value? Hydrological Processes. 2007;21(15):2075-2080.
- Siegfried T, Bernauer T, Guber R, Lainati S, Luber S, Stucki E, et al. Will climate change exacerbate water stress in Central Asia? Climatic Change. 2012;112(34):881-899.
- Kaser G, Grosshauser M, Marzeion B. Contribution potential of glaciers to water availability in different climate regimes. Proceedings of the National Academy of Sciences. 2010;107(47):20223-20227.
- Shahgedanova M, Nosenko G, Bushueva I, Ivanov M. Changes in area and geodetic mass balance of small glaciers, Polar Urals, Russia, 1950-2008. Journal of Glaciology. 2012;58(211):953-964.
- Sorg A, Bolch T, Stoffel M, Solomina O, Beniston M. Climate change impacts on glaciers and runoff in Tien Shan (Central Asia). Nature Climate Change. 2012;2(10):725-731.
- Zhang Y, Liu S, Ding Y. Observed degree-day factors and their spatial variation on glaciers in western China. Annals of Glaciology. 2006;43:301-306.
- Viviroli D, Archer DR, Buytaert W, Fowler HJ, Greenwood GB, Hamlet AF, et al. Climate change and mountain water resources: overview and recommendations for research, management and policy. Hydrology and Earth System Sciences. 2011;15(2):471504.
- Bolch T, Marchenko SS. Significance of glaciers, rockglaciers and ice-rich permafrost in the Northern Tien Shan as water storage. Proceedings of the Workshop on Assessment of Snow, Glacier and Water Resources in Asia. 2009;IHP/HWRP:132-144.
- Radić V, Hock R. Regionally differentiated contribution of mountain glaciers and ice caps to future sea-level rise. Nature Geoscience. 2011;4(2):91-94.
- Barnett TP, Adam JC, Lettenmaier DP. Potential impacts of a warming climate on water availability in snow-dominated regions. Nature. 2005;438(7066):303309.