
Research article · 2025 · Full text
International Journal of Geography Geology and EnvironmentMineralogical and structural controls on gold mineralization in the Ashanti greenstone belt
Volume 7(1) · Pages 105–108 · DOI: 10.22271/27067483.2025.v7.i1b.550 ↗
Research areasGeological and Geochemical AnalysisGeochemistry and Geologic MappingGeochemistry and Geochronology of Asian Mineral Deposits
Abstract
Author-writtenPicture a narrow shear zone cutting through two-billion-year-old volcanic rock—within that deformation corridor, gold concentrations can jump from background levels of 5 parts per billion to economic grades above 8 grams per tonne in less than a metre. This research examined the mineralogical and structural controls on gold distribution across three mine sites in the Ashanti Greenstone Belt of southern Ghana, one of West Africa's most prolific gold provinces. A total of 128 drill-core samples were collected and analysed by reflected-light and scanning-electron microscopy, whole-rock geochemistry (fire assay Au; ICP-MS multi-element), and structural logging. Gold mineralisation was found to be concentrated in arsenopyrite-bearing quartz veins hosted within second-order shear zones that splay off the main Ashanti fault. Mean gold grade in shear-zone cores reached 8.74 g/t, compared with 2.13 g/t in disseminated sulphide zones away from structures. Arsenic showed the strongest geochemical association with gold (r = 0.91), followed by sulphur (r = 0.83) and antimony (r = 0.76). The results confirm that structural preparation—particularly dilatant jogs within shear networks—exerts first-order control on ore-shoot geometry, while arsenopyrite acts as the principal gold-hosting mineral phase.
Summary
Source-checkedPlain-language reading of the full paper, prepared with AI and checked against the text. Each point links to the authors' own words.
Why it matters
- The Ashanti Greenstone Belt is a major gold province, but the specific relationship between mineralogy and structure that controls gold concentration is not fully documented. View evidence ↗
- The region consists of Paleoproterozoic metavolcanic and metasedimentary rocks intersected by the Ashanti fault system, a shear zone exceeding 200 km in length. View evidence ↗
- Two theories explain gold concentration: a structural model focusing on dilatant sites like jogs and bends, and a replacement model focusing on wall-rock reactivity and sulphidation. View evidence ↗
The question
- The study aimed to test the structural and replacement models by mapping structural architecture, characterizing mineralogy and geochemistry, and identifying the best predictors for gold grade. View evidence ↗
What they did
- Researchers collected 128 drill-core samples from three mine sites: Obuasi (48), Bogoso (42), and Bibiani (38). View evidence ↗
- The study was conducted from March 2021 to September 2023. View evidence ↗
- Structural domains were categorized into five types: shear-zone core, shear-zone margin, fold hinge, quartz-vein set, and disseminated sulphide. View evidence ↗
What they found
- Shear-zone cores had the highest mean gold grade at 8.74 g/t, which is over four times higher than the 2.13 g/t found in disseminated sulphide zones. View evidence ↗
- Quartz-vein sets had the second-highest mean gold grade at 6.48 g/t. View evidence ↗
- Arsenic had the strongest correlation with gold (r = 0.91), followed by sulphur (r = 0.83) and antimony (r = 0.76). View evidence ↗
- Samples containing arsenic concentrations above 1,000 ppm almost always had gold grades exceeding 6 g/t. View evidence ↗
- A combined structural and geochemical model explained 87% of gold grade variance, outperforming structural predictors alone (61%) or geochemical predictors alone (72%). View evidence ↗
What it means
- The authors conclude that a dual-control model using both structural and geochemical data provides a practical framework for exploration. View evidence ↗
- The authors recommend using arsenic-in-soil geochemistry as a cost-effective initial tool to identify prospective areas for drilling. View evidence ↗
Visual summary
2 visualsIllustrations explain the paper; charts are replotted from the paper's own table values.
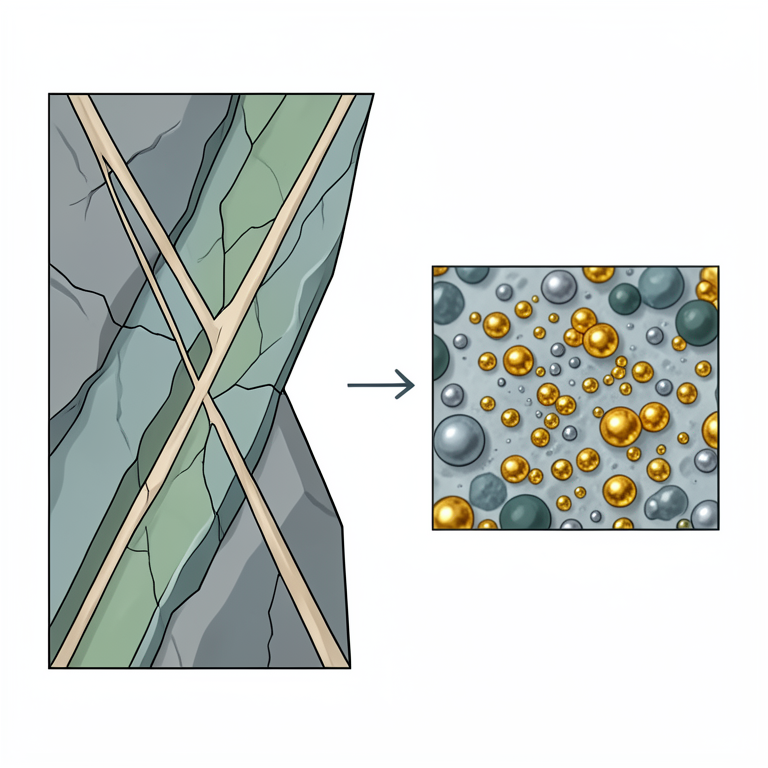
Dual-Control Model Concept
AI-generated conceptual illustration (Gold-bearing quartz veins within a metamorphic greenstone belt shear zone). It explains the idea and does not show study data.
View source evidence ↗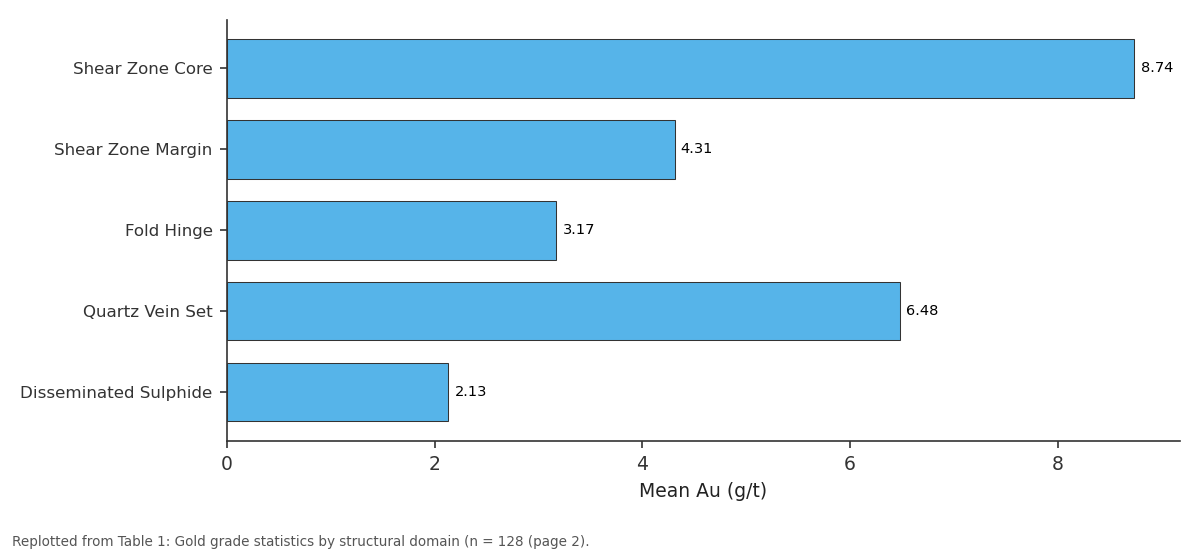
Mean Au (g/t): Shear Zone Core vs Shear Zone Margin vs Fold Hinge vs Quartz Vein Set vs Disseminated Sulphide
Replotted from Table 1 (page 2) of the original paper. Every bar is the paper's own table value.
View source evidence ↗Figures & tables
From the original paper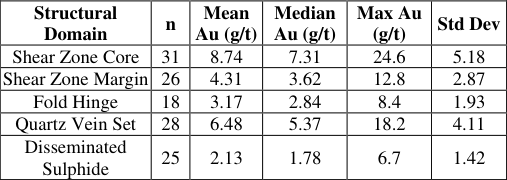 Table 1
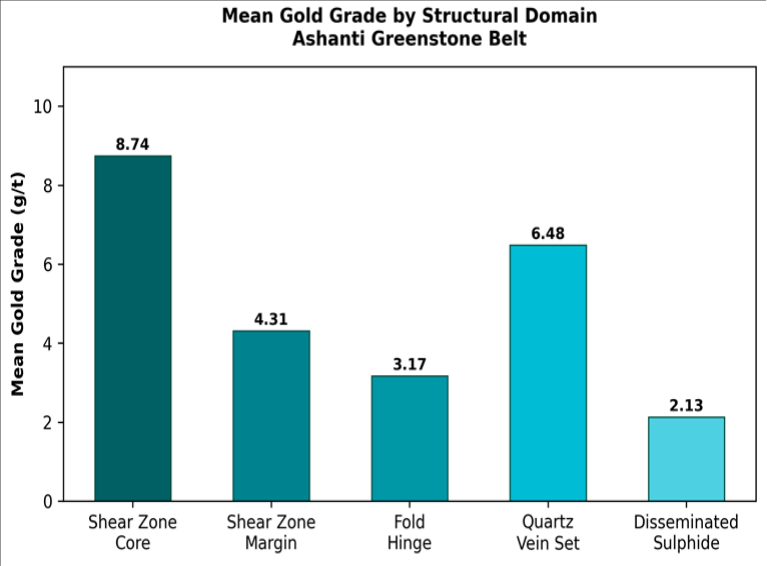 Figure 1
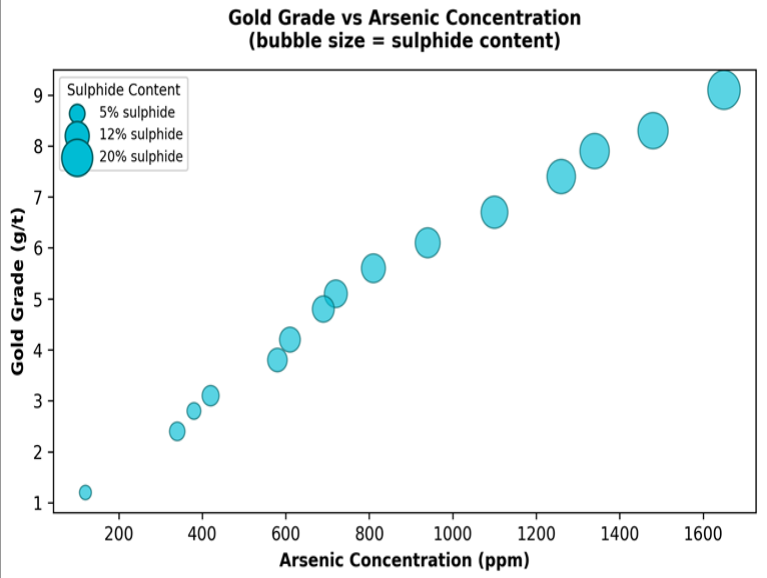 Figure 2
Introduction
A recurring scenario in West African gold exploration goes something like this: a regional geochemical survey flags an anomaly, trenching confirms visible gold in quartz veins, and a drill programme begins. But the veins pinch and swell unpredictably, and without a structural model, half the holes miss the ore. The Ashanti Greenstone Belt has been mined for over a century, yet the interplay between mineralogy and structure that governs where gold concentrates remains incompletely documented at the deposit scale [1] . The belt is a northeast-trending Paleoproterozoic sequence of metavolcanic and metasedimentary rocks intruded by granodiorite and cut by the Ashanti fault system, a crustal-scale shear zone that extends for more than 200 km [2] . Gold deposits along this corridor range from large open-pit operations like Obuasi to artisanal workings exploiting narrow high-grade veins. Previous work has established that gold is associated with arsenopyrite-bearing quartz veins in most deposits [3] , but the relative contributions of veinhosted versus disseminated sulphide mineralisation, and the specific structural settings that control ore-shoot continuity, have received less systematic attention [4] . Two models compete: the structural model, which argues that gold is concentrated wherever shear-zone geometry creates dilatant sites-jogs, bends, and fault intersections-that act as chemical traps for ascending hydrothermal fluids [5] ; and the replacement model, which emphasises wall-rock reactivity, particularly iron-rich lithologies that trigger sulphidation and gold precipitation regardless of structural setting [6] . In reality, both controls probably operate together, but their relative importance varies from deposit to deposit. This research aimed to test these competing models by: (a) mapping the structural architecture of three deposits at the core-log scale, (b) characterising the mineralogy and geochemistry of ore and waste zones, and (c) determining which combination of structural and mineralogical variables best predicts gold grade [7] .
Theoretical Background
Orogenic gold deposits form during late stages of collisional tectonics when metamorphic fluids migrate upward through crustal shear networks [5] . The fluids are typically lowsalinity, CO2-rich, and carry gold as bisulphide complexes (Au(HS)2-) at temperatures between 300 and 450 degrees Celsius [8] . Destabilisation of these complexes-by cooling, pressure drop, or reaction with iron-bearing wall rockcauses gold to precipitate, often within or adjacent to arsenopyrite, which can incorporate gold in solid solution at concentrations up to 1.5 wt% [3] . At the Ashanti Belt scale, first-order shear zones provide the plumbing for fluid transport, while second-and third-order splays create the dilatant traps where fluid pressure drops and precipitation occurs [2] . Understanding this hierarchy is the key to predicting ore-shoot locations from structural data alone.
Material and Methods
Material and Methods
Methods
Reflected-light microscopy and scanning-electron microscopy with energy-dispersive spectroscopy (SEM-EDS) were used to identify sulphide phases, textural relationships, and the mode of gold occurrence (free grain, inclusion in sulphide, or lattice-bound). Gold was determined by fire assay with gravimetric finish on 30-g aliquots. Multi-element analysis (As, S, Sb, Fe, Cu, Zn, Pb, Bi) used ICP-MS after four-acid digestion. Structural domains were classified as shear-zone core, shear-zone margin, fold hinge, quartz-vein set, and disseminated sulphide based on core-log characteristics [4] . Pearson correlation coefficients were calculated between gold and each pathfinder element, and stepwise multiple regression tested which combination of geochemical and structural variables best predicted gold grade.
Results
Table Figure 2 shows a strong positive co-variation between gold and arsenic. Samples with arsenic above 1,000 ppm almost invariably carried gold grades above 6 g/t, and the largest bubbles (highest sulphide content) cluster in the upper-right quadrant, confirming the genetic link between sulphidation and gold enrichment.
Discussion
The four-fold contrast in gold grade between shear-zone cores and disseminated sulphide zones provides strong support for the structural control model, at least at these three deposits. Shear zones create permeability pathways and dilatant traps that focus fluid flow and promote precipitation [5] . But the correlation with arsenic (r = 0.91) also shows that mineralogy matters: gold is not uniformly distributed within the structural corridor but is concentrated in arsenopyrite-rich bands where fluid-wallrock reaction was most intense [3] . The combination of structural and geochemical predictors in the stepwise regression explained 87% of the variance in gold grade-significantly more than either predictor set alone (structural alone: 61%; geochemical alone: 72%). This supports a dual-control model in which structure provides the plumbing and sulphidation chemistry provides the trap mechanism [6] . From an exploration perspective, the implication is clear: targeting shear-zone cores that also show elevated arsenic and sulphide content will maximise drilling success. Arsenic-in-soil geochemistry, which is cheaper than gold assay, could serve as a first-pass targeting tool to identify the most prospective segments of the Ashanti fault system for drill testing.
Conclusion
This research demonstrated that gold mineralization in the Ashanti Greenstone Belt is controlled by a combination of structural preparation and sulphide mineralogy. Shear-zone cores yielded mean grades of 8.74 g/t-four times higher than disseminated zones-while arsenopyrite emerged as the principal gold-hosting phase, with an Au-As correlation coefficient of 0.91.
A dual-control model incorporating both structural domain and geochemical signature explained 87% of the grade variance and offers a practical targeting framework for future exploration. Arsenic geochemistry should be routinely integrated with structural mapping to identify oreshoot positions along the Ashanti fault corridor.
Figures and tables from the paper
| Structural Domain | n | Mean Au (g/t) | Median Au (g/t) | Max Au (g/t) | Std Dev |
|---|---|---|---|---|---|
| Shear Zone Core | 31 | 8.74 | 7.31 | 24.6 | 5.18 |
| Shear Zone Margin | 26 | 4.31 | 3.62 | 12.8 | 2.87 |
| Fold Hinge | 18 | 3.17 | 2.84 | 8.4 | 1.93 |
| Quartz Vein Set | 28 | 6.48 | 5.37 | 18.2 | 4.11 |
| Disseminated Sulphide | 25 | 2.13 | 1.78 | 6.7 | 1.42 |
Table text extracted from the original PDF; superscript letters are shown inline. The original table image is below.
View original table image
References
16 in the original paper- Oberthür T, Vetter U, Davis DW, Amanor JA. Age constraints on gold mineralization and Paleoproterozoic crustal evolution in the Ashanti belt of southern Ghana. Precambrian Research. 1998;89(3-4):129-143.
- Allibone AH, McCuaig TC, Harris D, et al. Structural controls on gold mineralization at the Obuasi gold mine, Ashanti belt, Ghana. Economic Geology. 2002;97(4):765-783.
- Fougerouse D, Micklethwaite S, Tomkins AG, et al. Gold remobilisation and formation of high grade ore shoots driven by dissolution-reprecipitation replacement and Ni substitution into auriferous arsenopyrite. Geochimica et Cosmochimica Acta. 2016;178:143-159.
- Perrouty S, Aillères L, Jessell MW, et al. Revised Eburnean geodynamic evolution of the gold-rich southern Ashanti Belt, Ghana, with new field and geophysical evidence of pre-Tarkwaian deformations. Precambrian Research. 2012;204-205:12-39.
- Groves DI, Goldfarb RJ, Gebre-Mariam M, Hagemann SG, Robert F. Orogenic gold deposits: A proposed classification in the context of their crustal distribution and relationship to other gold deposit types. Ore Geology Reviews. 1998;13(1-5):7-27.
- Asamoah D, Gyamfi E, Ansah E. Wall-rock alteration and sulphide paragenesis in the Bibiani gold deposit. Journal of African Earth Sciences. 2018;148:31-47.
- Kesse GO. The Mineral and Rock Resources of Ghana. A.A. Balkema. 1985;Rotterdam:610.
- Goldfarb RJ, Groves DI, Gardoll S. Orogenic gold and geologic time. Mineralium Deposita. 2001;36(5):453464.
- Eisenlohr BN, Groves D, Partington GA. Crustal-scale shear zones and their significance to Archaean gold mineralisation in Western Australia. Mineralium Deposita. 1989;24(1):1-8.
- Blenkinsop TG, Schmidt-Mumm A, Kumi R, Sangmor S. Structural geology of the Tarkwa goldfield. Geological Society of London Special Publications. 1994;78:77-95.
- Yao Y, Murphy PJ, Robb LJ. Fluid characteristics of granitoid-hosted gold deposits in the Birimian terrane of Ghana. Mineralium Deposita. 2001;36(8):720-735.
- Klemd R, Hirdes W, Olesch M, Oberthür T. Fluid inclusions in quartz-pebble conglomerates of the early Proterozoic Witwatersrand and Tarkwa gold deposits of southern Africa. Mineralium Deposita. 1993;28(4):245258.
- Mumin AH, Fleet ME, Chryssoulis SL. Gold mineralization in As-rich mesothermal gold ores of the Bogosu-Prestea mining district. Mineralium Deposita. 1994;29(5):391-403.
- Tunks AJ, Selley D, Rogers JR, Brabham G. Vein mineralisation at the Damang gold mine, Ghana. Mineralium Deposita. 2004;39(5-6):628-645.
- Leube A, Hirdes W, Mauer R, Kesse GO. The early Proterozoic Birimian Supergroup of Ghana and some aspects of its associated gold mineralisation. Precambrian Research. 1990;46(1-2):139-165.
- Feybesse JL, Billa M, Guerrot C, et al. The paleoproterozoic Ghanaian province: Geodynamic model and ore controls. Precambrian Research. 2006;149(3-4):149-196.