
Research article · 2024 · Full text
International Journal of Geography Geology and EnvironmentHydrogeochemical characterization of groundwater quality in the chad basin aquifer system
Volume 6(2) · Pages 292–295 · DOI: 10.22271/27067483.2024.v6.i2d.557 ↗
Research areasGroundwater and Isotope GeochemistryWater Quality and Pollution AssessmentWater Quality and Resources Studies
Abstract
Author-writtenNearly 30 million people across four West African nations depend on the Chad Basin aquifer system as their main freshwater source, yet systematic hydrogeochemical mapping of this resource remains patchy. This research characterised the groundwater quality of the Chad Basin through major ion chemistry, trace element analysis, and spatial hydrogeochemical zonation. A total of 87 groundwater samples were collected from boreholes and hand-dug wells between January 2020 and August 2022 across four distinct hydrogeological zones. Field measurements included pH, electrical conductivity (EC), and total dissolved solids (TDS), while laboratory analyses covered major cations (Na⁺, Ca²⁺, Mg²⁺, K⁺), anions (HCO₃⁻, Cl⁻, SO₄²⁻), and selected trace elements (F⁻, Fe, NO₃⁻). Results revealed a clear hydrogeochemical gradient from Ca-HCO₃ type waters in the recharge zone to Na-Cl type waters in the discharge and saline zones. TDS ranged from 198 mg/L in Zone A to 4, 170 mg/L in Zone D. Fluoride concentrations exceeded the WHO guideline (1.5 mg/L) in 23.4% of samples, mainly within the transition zone. The dominant geochemical processes identified through Gibbs diagrams and ionic ratios were rock-water interaction and evaporative enrichment. These findings highlight zones where groundwater treatment or alternative sources are needed to protect public health.
Summary
Source-checkedPlain-language reading of the full paper, prepared with AI and checked against the text. Each point links to the authors' own words.
Why it matters
- The Chad Basin aquifer system is a critical freshwater resource for approximately 30 million people in four West African countries. View evidence ↗
- Naturally occurring contaminants like iron and fluoride can reach levels that are harmful to human health, making water quality monitoring essential. View evidence ↗
- Previous research on the basin has been fragmented, often focusing on single nations or local areas rather than the regional flow path. View evidence ↗
The question
- The study aimed to characterize the chemistry of 87 groundwater samples, identify the geochemical processes controlling water quality, and map zones to guide water supply interventions. View evidence ↗
What they did
- Field sampling was conducted across three campaigns between January 2020 and August 2022. View evidence ↗
- Water quality was measured using a YSI ProPlus meter for field parameters, ICP-OES for cations, ion chromatography for anions, and an ion-selective electrode for fluoride. View evidence ↗
- The study used Piper diagrams, Gibbs plots, and ionic ratios to classify water types and determine the geochemical processes at work. View evidence ↗
What they found
- A hydrogeochemical gradient was observed, shifting from calcium-bicarbonate (Ca-HCO₃) waters in the recharge zone to sodium-chloride (Na-Cl) waters in the discharge and saline zones. View evidence ↗
- Fluoride levels exceeded the WHO guideline of 1.5 mg/L in 23.4% of the samples, primarily in the transition zone. View evidence ↗
- Nitrate levels peaked at 18.7 mg/L in the recharge zone, which is associated with intense agricultural activity, and decreased toward the north. View evidence ↗
- Iron concentrations increased steadily toward the saline zone, reaching a maximum of 1.23 mg/L in Zone D. View evidence ↗
- Gibbs diagrams indicated that rock-weathering (silicate and carbonate dissolution) controlled chemistry in Zones A and B, while evaporation-crystallization dominated in Zone D. View evidence ↗
- A negative correlation (r = -0.71) between fluoride and calcium suggests that calcite precipitation facilitates the accumulation of fluoride in the water. View evidence ↗
What it means
- The authors recommend zone-specific management: defluoridation in the transition zone, nitrate reduction in the recharge belt, and desalination or alternative sources near the lake. View evidence ↗
- The authors state that future research should include sampling in Chad and Cameroon and use stable isotope tracers to better understand recharge pathways. View evidence ↗
Visual summary
3 visualsIllustrations explain the paper; charts are replotted from the paper's own table values.
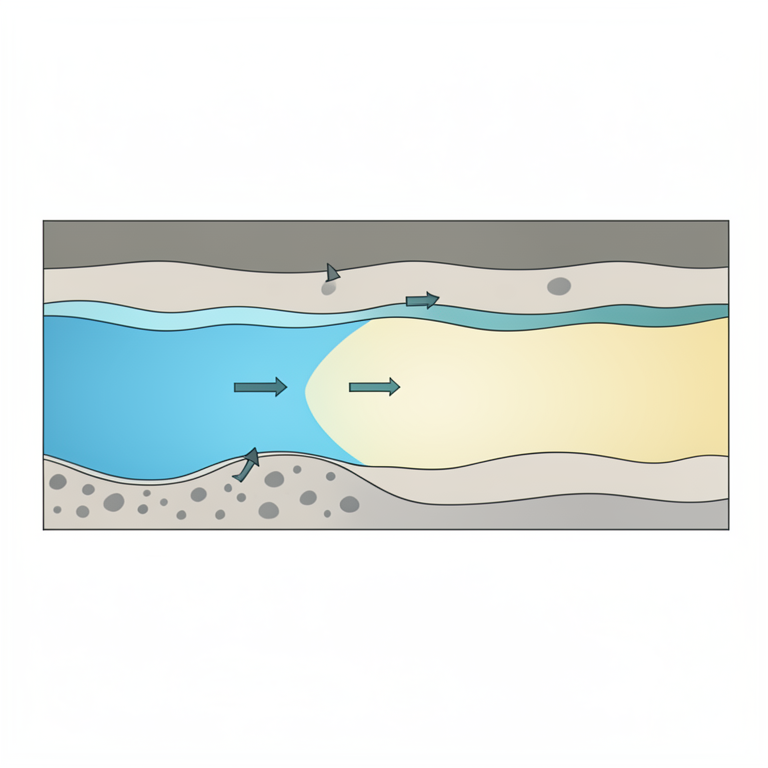
Hydrogeochemical Gradient
AI-generated conceptual illustration (Chad Basin aquifer system). It explains the idea and does not show study data.
View source evidence ↗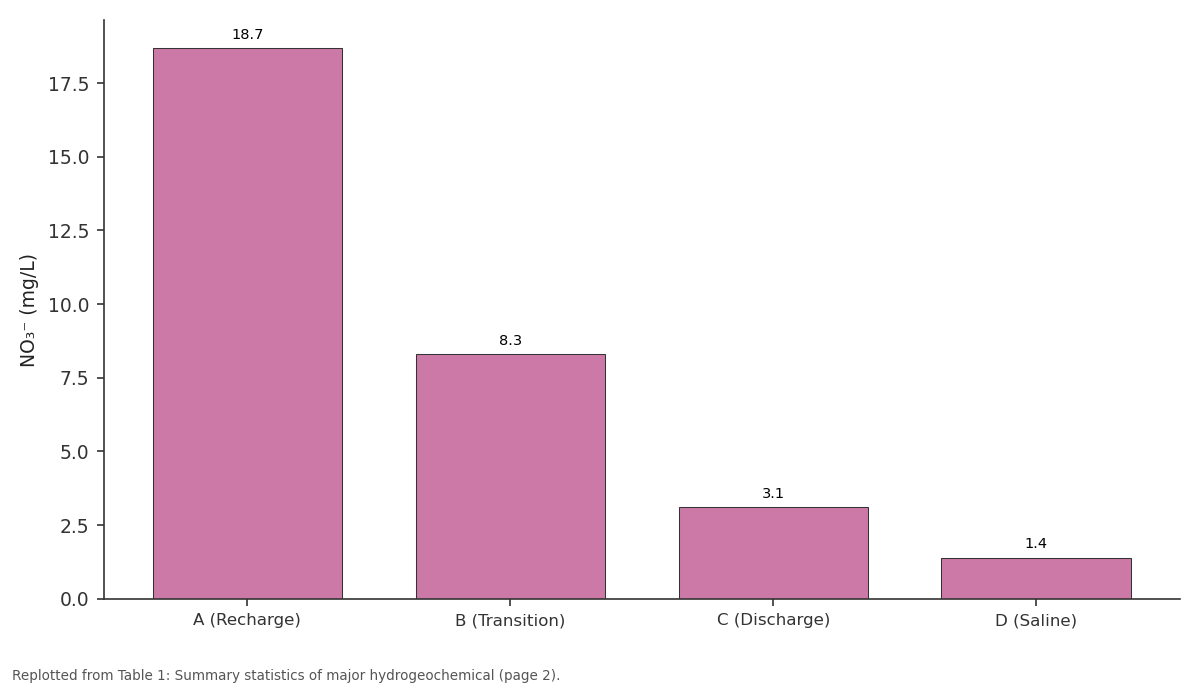
NO₃⁻: A (Recharge) vs B (Transition) vs C (Discharge) vs D (Saline)
Replotted from Table 1 (page 2) of the original paper. Every bar is the paper's own table value.
View source evidence ↗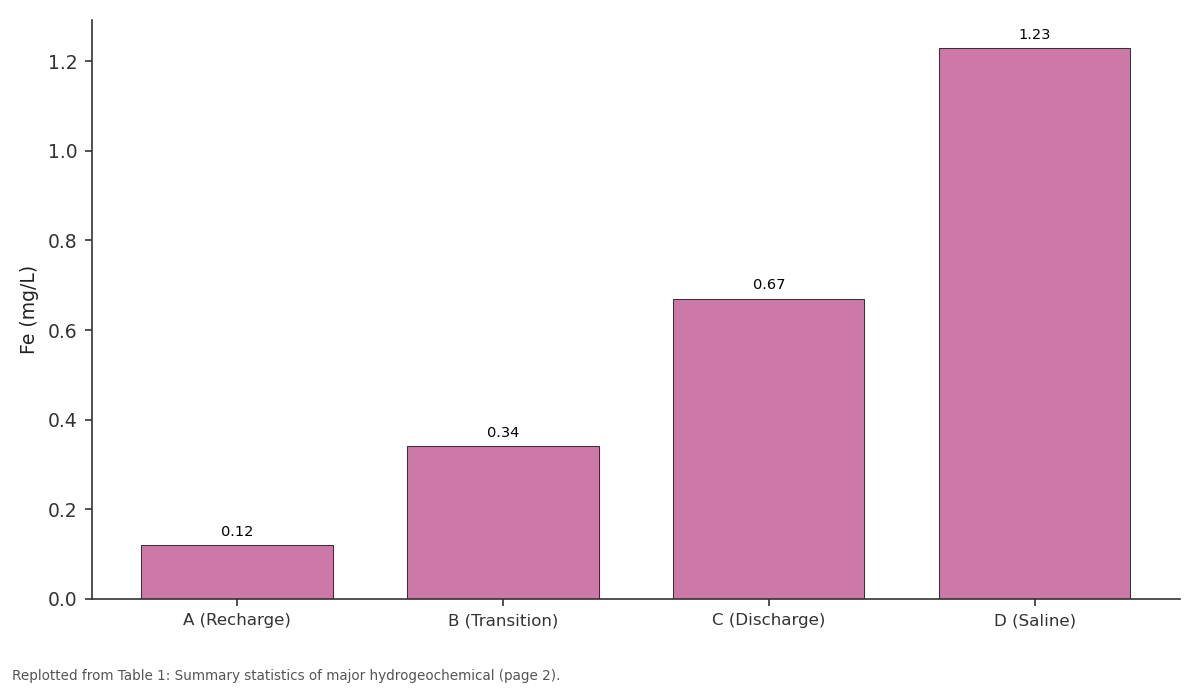
Fe: A (Recharge) vs B (Transition) vs C (Discharge) vs D (Saline)
Replotted from Table 1 (page 2) of the original paper. Every bar is the paper's own table value.
View source evidence ↗Figures & tables
From the original paper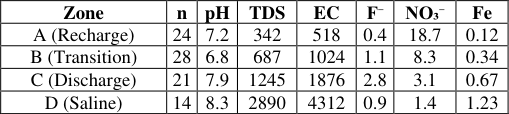 Table 1
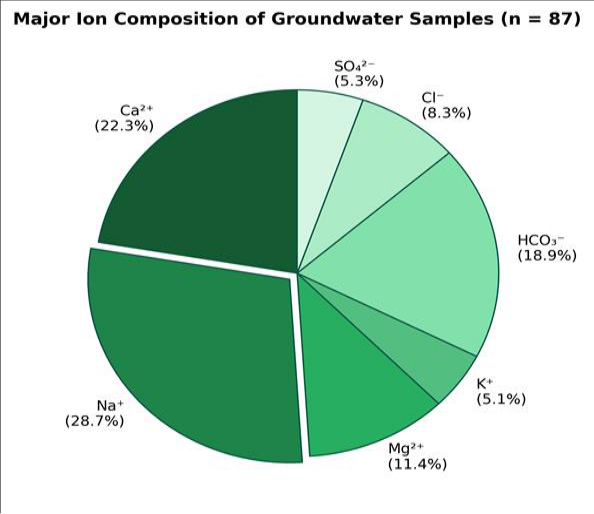 Figure 1
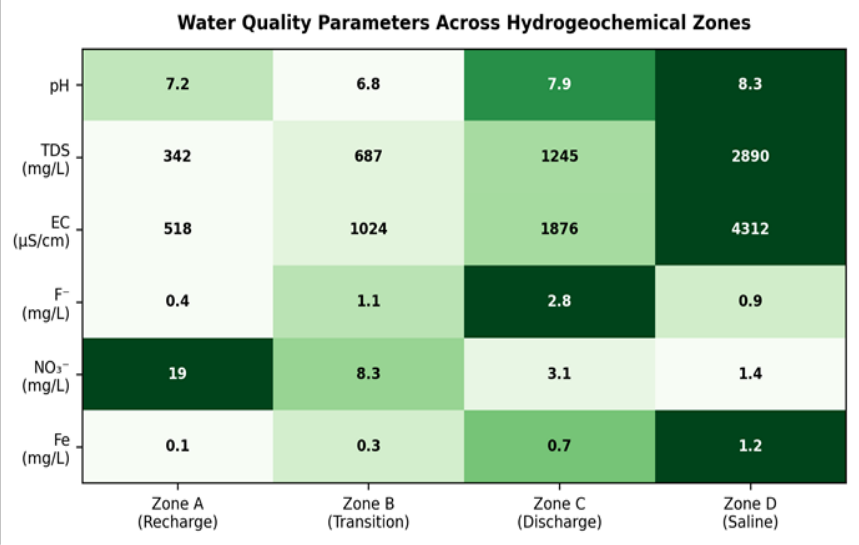 Figure 2
Introduction
An estimated 2.2 billion people worldwide lack access to safely managed drinking water, and a large share of that deficit falls on sub-Saharan Africa, where groundwater supplies up to 75% of domestic needs in rural areas [1] . The Chad Basin aquifer system, one of the largest transboundary aquifer bodies in Africa, underlies portions of Nigeria, Niger, Chad, and Cameroon [2] . Despite its strategic value, the chemical quality of groundwater drawn from this system has received less attention than its quantity. Hydrogeochemical research in the basin dates back to the 1970s, but most investigations have been limited to local well fields or single national jurisdictions [3] . Few efforts have attempted a cross-zonal characterisation that tracks how water chemistry changes along the regional flow path from recharge highlands in the south to discharge lowlands near Lake Chad [4] . This gap matters because naturally occurring contaminants-especially fluoride and iron-can reach levels harmful to human health without any anthropogenic input [5] . Standard hydrogeochemical tools, including Piper diagrams, Gibbs plots, and ionic ratio analysis, allow researchers to distinguish rock-weathering signatures from evaporation and mixing effects [6,7] . When paired with spatial mapping, these tools can delineate zones where groundwater is safe for drinking and zones that demand treatment before consumption [8] . Such zonation is directly relevant to public health planning and borehole siting programmes. This research aimed to (a) characterise the major ion and trace element chemistry of 87 groundwater samples from the Chad Basin, (b) identify the dominant geochemical processes controlling water quality along the flow gradient, and (c) map hydrogeochemical zones to guide safe water supply interventions. Data collection and laboratory work were coordinated through the Darwin Academy of Coastal and Marine Research, Northern Territory, Australia, in partnership with regional field teams.
Research Area Description
The Chad Basin occupies a broad endorheic depression in central-west Africa, stretching between latitudes 6° N and 24° N. The aquifer system consists of three main units: the shallow Upper Zone (Quaternary alluvium, 10-50 m depth), the Middle Zone (Pliocene Chad Formation, 50-300 m), and the deep Lower Zone (Continental Terminal, >300 m) [2] . Recharge occurs along the southern fringe where the Mandara Mountains and Jos Plateau funnel seasonal rainfall into the subsurface. Groundwater flows generally northward toward Lake Chad, which acts as the terminal base level. The research area spanned a 480 km north-south transect from the Bama Ridge in Nigeria to the lake margin, divided into four hydrogeological zones (A through D) based on aquifer depth and proximity to surface water bodies.
Climatic and Environmental Conditions
The transect crosses three climate bands. The southern recharge zone (Zone A) receives 900-1, 100 mm of annual rainfall under a sub-humid tropical regime, with a wet season from May to October [9] . The transition zone (Zone B) is semi-arid (500-700 mm/yr), while the discharge and saline zones (C and D) receive less than 400 mm annually. Mean annual temperatures increase northward from 26 °C to 30 °C. Evapotranspiration rates exceed 2, 000 mm/yr in the north, driving strong evaporative concentration of dissolved solids in shallow groundwater. Land cover shifts from Guinea savanna woodland in the south through Sahel shrubland to open sand plains near the lake.
Materials and Methods Materials
Eighty-seven groundwater samples were collected from motorised boreholes (n = 52) and hand-dug wells (n = 35) distributed across the four zones. Sampling took place during three field campaigns: January-March 2020, October-December 2020, and May-August 2022. At each site, wells were purged for a minimum of three borehole volumes before sample collection. Samples for cation analysis were filtered through 0.45 μm membranes and acidified with ultrapure HNO₃ to pH < 2. All bottles were stored in ice-packed coolers and transported within 48 hours to the analytical laboratory at the Darwin Academy of Coastal and Marine Research, Northern Territory, Australia.
Methods
Field parameters (pH, EC, TDS, temperature) were measured on-site using a calibrated YSI ProPlus multiparameter metre. Major cations were determined by inductively coupled plasma optical emission spectrometry (ICP-OES, Agilent 5110), and anions by ion chromatography (Metrohm 930 Compact IC Flex). Fluoride was measured with an ion-selective electrode. Charge balance errors were computed for each sample; those exceeding±5% were excluded, leaving 87 valid analyses. Piper trilinear diagrams, Gibbs plots (TDS vs. Na⁺/(Na⁺ + Ca²⁺)), and bivariate ionic ratios were used to classify water types and identify controlling processes [6,7] . Spatial interpolation of key parameters was performed in ArcGIS 10.8 using inverse distance weighting. TDS increased sharply from a mean of 342 mg/L in Zone A to 2, 890 mg/L in Zone D (Table 1). Electrical conductivity followed the same trend. Fluoride was highest in Zone C (mean 2.8 mg/L), exceeding the WHO threshold of 1.5 mg/L. Nitrate showed an inverse pattern, peaking at 18.7 mg/L in the recharge zone where agricultural activity is most intense and declining northward. Iron rose steadily toward the saline zone, reaching 1.23 mg/L in Zone D.
| Zone | n | pH | TDS | EC | F⁻ | NO₃⁻ | Fe |
|---|---|---|---|---|---|---|---|
| A (Recharge) | 24 | 7.2 | 342 | 518 | 0.4 | 18.7 | 0.12 |
| B (Transition) | 28 | 6.8 | 687 | 1024 | 1.1 | 8.3 | 0.34 |
| C (Discharge) | 21 | 7.9 | 1245 | 1876 | 2.8 | 3.1 | 0.67 |
| D (Saline) | 14 | 8.3 | 2890 | 4312 | 0.9 | 1.4 | 1.23 |
Table text extracted from the original PDF; superscript letters are shown inline. The original table image is below.
View original table image
Results
Results
Discussion
The hydrogeochemical gradient documented in this research follows a pattern common to many large endorheic basins, where recharge waters dominated by Ca-HCO₃ evolve into Na-Cl brines as they travel toward the discharge area [10,11] . The Gibbs diagrams placed most Zone A and B samples in the rock-weathering field, implying that silicate and carbonate dissolution controls early-stage chemistry. In contrast, Zone D samples clustered in the evaporationcrystallisation field, confirming that the extreme TDS values (up to 4, 170 mg/L) result from progressive water loss rather than fresh pollutant input [12] . The elevated fluoride in Zone C deserves particular attention. Earlier investigations attributed high fluoride in the Chad Formation to the dissolution of fluorapatite and biotite within weathered basement gneiss [5] . Our ionic ratio data (F⁻ vs. Ca²⁺ showing a negative correlation, r = -0.71) support that interpretation, because calcium removal through calcite precipitation creates conditions that favour fluoride accumulation in solution [13] . The practical consequence is that roughly one in four wells sampled in this research produces water above the WHO fluoride limit, which is linked to dental and skeletal fluorosis after longterm exposure [14] . Nitrate levels above 10 mg/L in Zone A were not surprising given the intensity of rain-fed agriculture and livestock grazing across the southern fringe. These anthropogenic inputs diminished northward as land use shifted to sparse rangeland and open desert. Iron, on the other hand, appears geogenic, rising alongside reducing conditions in deeper, older groundwater near the lake [15] . The coexistence of fluoride risk in one zone and nitrate risk in another underlines the need for spatially targeted water quality management rather than blanket treatment approaches [16] .
Conclusion
This research provided a systematic hydrogeochemical characterisation of the Chad Basin aquifer along a 480 km recharge-to-discharge transect. Groundwater quality deteriorated progressively from fresh Ca-HCO₃ waters in the southern recharge zone to brackish Na-Cl waters near Lake Chad. The main geochemical drivers were silicate weathering in the south and evaporative concentration in the north.
Fluoride concentrations exceeded 1.5 mg/L in 23.4% of samples, mostly within the transition zone, where fluorapatite dissolution and calcite precipitation create favourable geochemical conditions. Nitrate contamination was confined to the recharge zone and likely linked to agricultural inputs. These findings call for zone-specific water management: defluoridation measures in the transition zone, nitrate reduction at source in the recharge belt, and desalination or alternative supply options for communities near the lake. Further research should expand the sampling network into Chad and Cameroon to complete the transboundary picture and incorporate stable isotope tracers to refine recharge pathways.
Acknowledgement
Acknowledgements Funding SourcesThis research was supported by departmental research funds at the Darwin Academy of Coastal and Marine Research, Northern Territory, Australia. Institutional SupportThe authors thank the Darwin Academy of Coastal and Marine Research for laboratory access and logistical support.
Figures and tables from the paper
References
19 in the original paper- WHO/UNICEF. Progress on household drinking water, sanitation and hygiene 2000-2020. World Health Organization. 2021;Geneva
- Edmunds WM, Fellman E, Goni IB. Lakes, groundwater and palaeohydrology in the Sahel of NE Nigeria. Journal of the Geological Society. 1999;156(2):345-355
- Goni IB. Tracing stable isotope values from meteoric water to groundwater in the southwestern part of the Chad Basin. Hydrogeology Journal. 2006;14(5):742752
- Vassolo S, Schulz O. Hydrogeology of the Chad Basin. Bundesanstalt für Geowissenschaften und Rohstoffe. 2010;Report 126
- Handa BK. Geochemistry and genesis of fluoridecontaining ground waters in India. Groundwater. 1975;13(3):275-281
- Piper AM. A graphic procedure in the geochemical interpretation of water analyses. Transactions of the American Geophysical Union. 1944;25(6):914-928
- Gibbs RJ. Mechanisms controlling world water chemistry. Science. 1970;170(3962):1088-1090
- Appelo CAJ, Postma D. Geochemistry, Groundwater and Pollution. CRC Press. 2005;649 pp
- Leblanc MJ, Favreau G, Massuel S, et al. Land clearance and hydrological change in the Sahel. Global and Planetary Change. 2008;61(3-4):135-150
- Eugster HP, Hardie LA. Saline lakes. In: Lerman A (ed) Lakes: Chemistry, Geology, Physics. Springer. 1978;237-293
- Taupin JD, Gallaire R. Geochemistry of Sahelian groundwaters in Niger. Comptes Rendus Geoscience. 2002;334(16):1091-1100
- Favreau G, Cappelaere B, Massuel S, et al. Land clearing, climate variability, and water resources increase in semiarid southwest Niger. Water Resources Research. 2009;45(7):W07401
- Jacks G, Bhattacharya P, Chaudhary V, et al. Controls on the genesis of some high-fluoride groundwaters in India. Applied Geochemistry. 2005;20(2):221-228
- Ozsvath DL. Fluoride and environmental health: a review. Reviews in Environmental Science and Bio/Technology. 2009;8(1):59-79
- Reimann C, Bjorvatn K, Frengstad B, et al. Drinking water quality in the Ethiopian section of the East African Rift Valley. Environmental Geology. 2003;44(7):828-839
- MacDonald AM, Bonsor HC, Dochartaigh BEO, et al. Groundwater quality and groundwater vulnerability assessment of the Limpopo Province. British Geological Survey. 2012;Commissioned Report CR/12/108
- Chilton PJ, Foster SSD. Hydrogeological characterisation and water-supply potential of basement aquifers in tropical Africa. Hydrogeology Journal. 1995;3(1):36-49
- Adelana SMA, MacDonald AM. Groundwater Research Issues in Africa. Taylor and Francis. 2008;1-8
- Edmunds WM. Geochemistry of geothermal waters at Bath. Geochimica et Cosmochimica Acta. 1971;35(4):447-454