
Research article · 2025 · Full text
International Journal of Geography Geology and EnvironmentClimate variability and its effect on crop productivity in the Sahelian semi-arid zone
Volume 7(1) · Pages 46–49 · DOI: 10.22271/27067483.2025.v7.i1a.536 ↗
Research areasClimate change impacts on agricultureHydrology and Drought AnalysisClimate variability and models
Abstract
Author-writtenHow does shifting rainfall reshape food security across Africa's drylands? The Sahelian semi-arid zone, stretching across sub-Saharan Africa, supports millions of smallholder farmers who depend almost entirely on rain-fed agriculture. This research examined the relationship between climate variability and crop productivity in selected Sahelian localities over an eight-year window (2015-2022). Meteorological records from ground-based weather stations and satellite-derived rainfall estimates were combined with district-level crop yield data for millet, sorghum, and maize. A correlation-regression framework was applied to quantify links between seasonal rainfall totals, onset-date shifts, dry-spell frequency, and harvested yield. Results showed that mean annual rainfall declined by 8.7% relative to the 30-year normal, while the coefficient of variation for monthly totals rose from 31.2% to 39.6%. Crop yields tracked rainfall closely: each 10% drop in June-September totals corresponded to a 12.3% fall in millet output and a 9.8% decline in sorghum yield. Maize appeared more sensitive, losing about 14.1% per equivalent rainfall deficit. Late monsoon onset (beyond 15 June) reduced effective growing-season length by 11-18 days on average, compounding yield losses. Mid-season dry spells longer than 12 consecutive days were recorded in five of the eight years and matched the lowest-yield seasons. The findings point to a tightening climate envelope for rain-fed cropping in the Sahel and reinforce the need for drought-tolerant varieties, supplemental irrigation, and early-warning systems tailored to smallholder contexts.
Summary
Source-checkedPlain-language reading of the full paper, prepared with AI and checked against the text. Each point links to the authors' own words.
Why it matters
- Millions of smallholder farmers in the Sahelian semi-arid zone of sub-Saharan Africa rely almost exclusively on rain-fed agriculture for their livelihoods. View evidence ↗
- Millet, sorghum, and maize are critical for food security, providing over 70% of the calories for rural households in the Sahel. View evidence ↗
- Changes in how rainfall is distributed throughout the season can be as harmful to crops as a total lack of rain, especially during critical growth periods. View evidence ↗
The question
- The study aimed to quantify seasonal rainfall trends, test how different crops respond to specific rainfall metrics, and determine which variables best predict yield loss. View evidence ↗
What they did
- The researchers analyzed crop productivity for three cereals across four Sahelian districts using a combination of rainfall and production data from 2015 to 2022. View evidence ↗
- Rainfall data were collected from four automatic weather stations and supplemented with high-resolution (0.05°) CHIRPS satellite rainfall grids. View evidence ↗
- The study used Pearson correlation coefficients and stepwise multiple regression to analyze the relationship between five rainfall metrics, temperature, and crop yields. View evidence ↗
What they found
- Mean annual rainfall decreased by 8.7% compared to the 30-year average, and the variability of monthly rainfall increased from 31.2% to 39.6%. View evidence ↗
- There was a strong positive correlation (r = 0.91) between annual rainfall and yield, with the lowest yield (1.27 t/ha) occurring in the driest year (2018, 329.8 mm) and the highest (2.14 t/ha) in the wettest (2017, 453.1 mm). View evidence ↗
- A 10% decrease in June-September rainfall led to yield losses of 14.1% for maize, 12.3% for millet, and 9.8% for sorghum, indicating maize is the most sensitive crop. View evidence ↗
- When the monsoon onset occurred after June 15, the effective growing season was shortened by an average of 11 to 18 days, which increased yield losses. View evidence ↗
- Dry spells exceeding 12 consecutive days occurred in five out of the eight years studied and coincided with the seasons of lowest crop yield. View evidence ↗
- The monsoon season experienced the largest absolute rainfall deficit at 34.2 mm below normal, and pre-monsoon rainfall was 17.0% lower than the long-term average. View evidence ↗
What it means
- The authors conclude that the timing of the monsoon onset and the frequency of dry spells are critical predictors of yield that provide more information than total rainfall alone. View evidence ↗
- The authors recommend expanding the use of drought-tolerant cultivars, implementing small-scale supplemental irrigation, and investing in weather-indexed insurance. View evidence ↗
- The study is limited by its small sample size of four districts and a short eight-year time series, which may affect the generalizability of the results. View evidence ↗
- The authors suggest that future research should extend the analysis to at least 15 years and include soil-moisture modeling. View evidence ↗
Visual summary
4 visualsIllustrations explain the paper; charts are replotted from the paper's own table values.
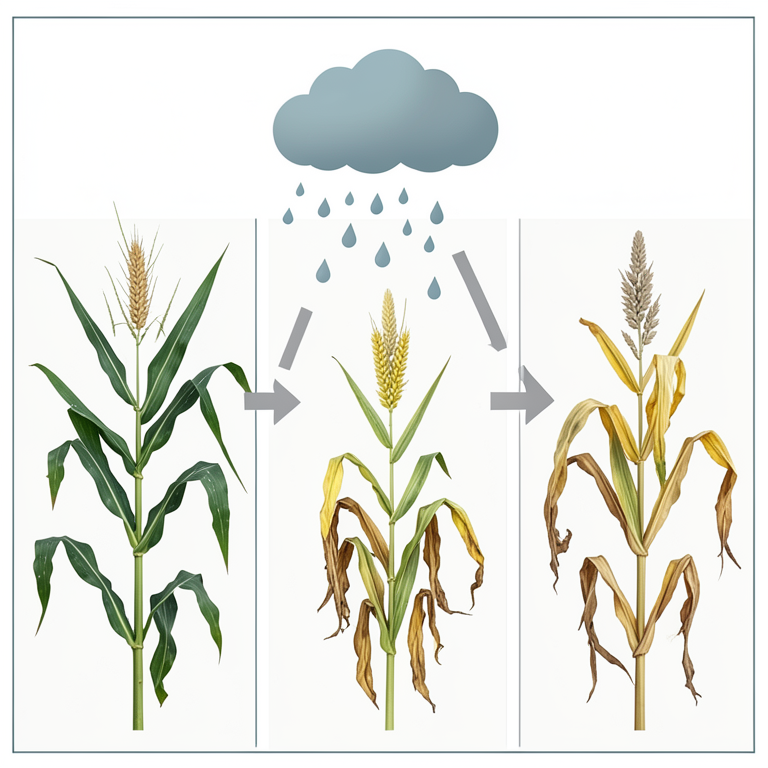
Crop Sensitivity Comparison
AI-generated conceptual illustration (maize, pearl millet, and sorghum plants). It explains the idea and does not show study data.
View source evidence ↗
Rainfall Timing Impacts
AI-generated conceptual illustration (Pearl millet plants in the Sahelian semi-arid zone). It explains the idea and does not show study data.
View source evidence ↗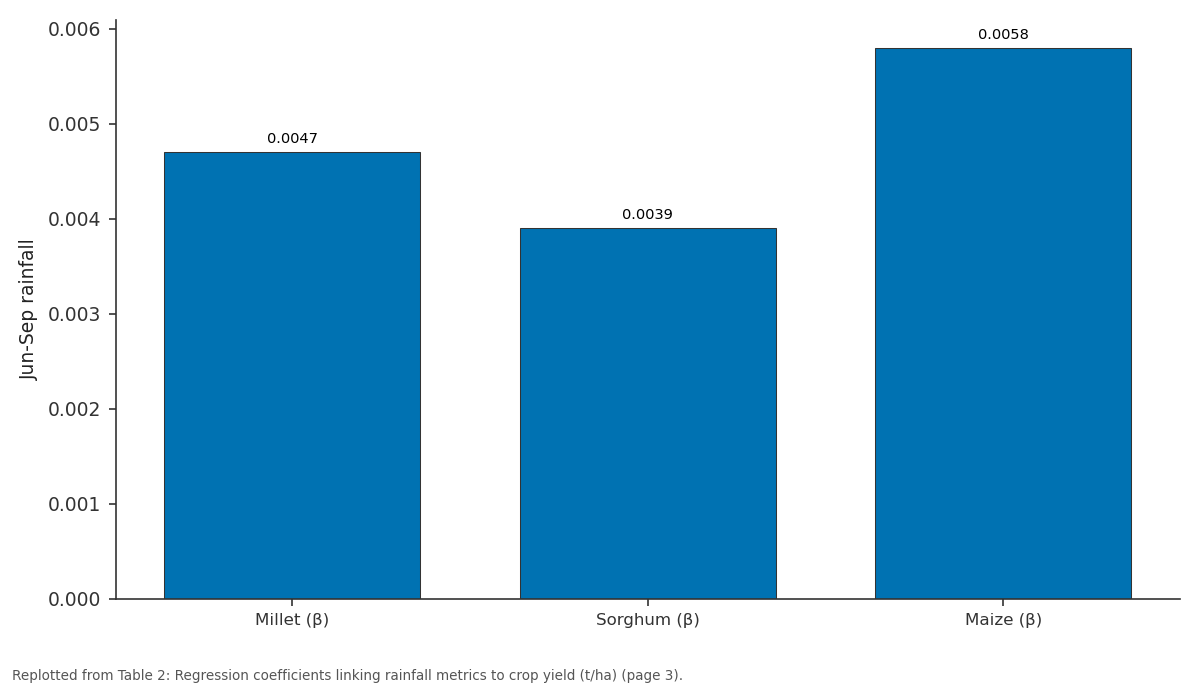
Jun-Sep rainfall: Millet (β) vs Sorghum (β) vs Maize (β)
Replotted from Table 2 (page 3) of the original paper. Every bar is the paper's own table value.
View source evidence ↗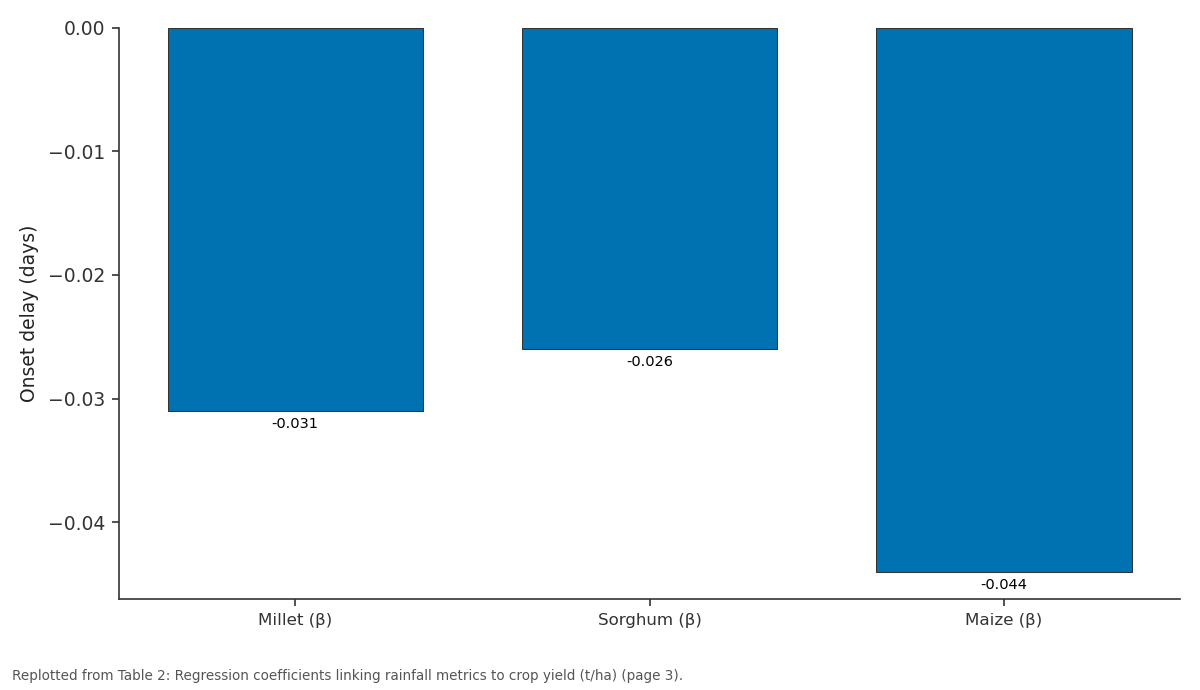
Onset delay (days): Millet (β) vs Sorghum (β) vs Maize (β)
Replotted from Table 2 (page 3) of the original paper. Every bar is the paper's own table value.
View source evidence ↗Figures & tables
From the original paper Table 1
 Table 2
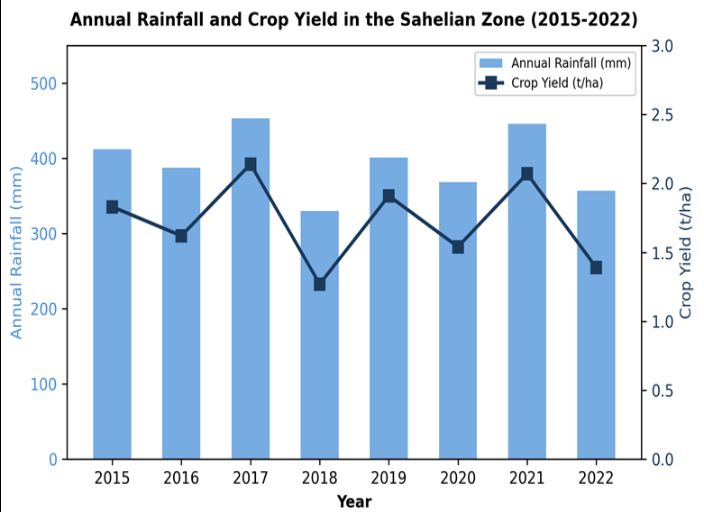 Figure 1
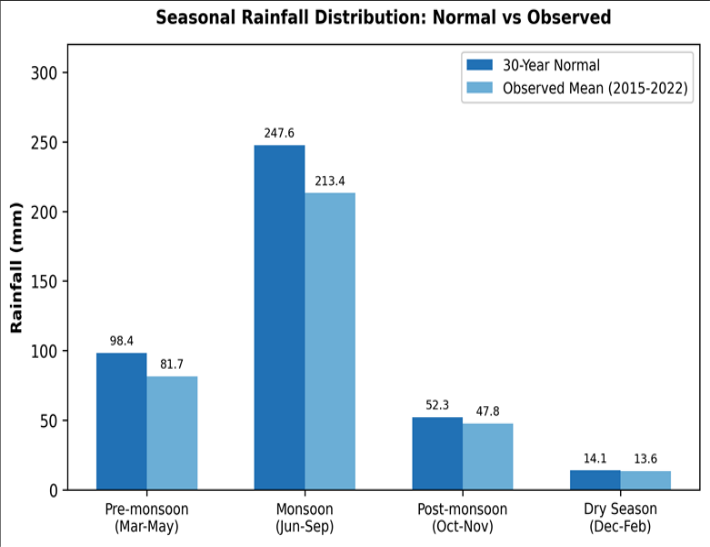 Figure 2
Introduction
What happens when the rains that millions of farmers count on begin to arrive late, fall short, or vanish mid-season? Across the Sahelian belt of sub-Saharan Africa, this question isn't theoretical-it shapes household food budgets every single year. The region sits at the climatic boundary between the Sahara Desert to the north and the wetter Sudanian savannas to the south, receiving between 200 and 600 mm of annual rainfall concentrated in a single wet season [1] . Even small departures from expected totals can push crop yields below subsistence thresholds [2] . Over the past four decades, Sahelian rainfall has shown partial recovery from the severe droughts of the 1970s and 1980s, yet the character of precipitation has changed [3] . Several ground-station analyses indicate that total seasonal amounts may be holding roughly steady while individual storm intensities rise and dry gaps between events widen [4] . This shift in rainfall distribution-rather than outright deficit-can be just as damaging to crops that depend on consistent soil moisture during critical growth windows [5] . Millet, sorghum, and maize account for more than 70% of the calories consumed in rural Sahelian households [6] . All three are C4 grains adapted, to varying degrees, to moisture stress, but each responds differently to the timing and volume of rainfall. Millet tolerates the lowest totals; maize demands the most [7] . When dry spells coincide with flowering or grainfill, losses can exceed 40% regardless of total seasonal rainfall [8] . Previous work has linked broad precipitation trends to regional yield indices [9] , but fewer analyses have disaggregated the problem into its seasonal components-onset date, cessation date, dry-spell length, and within-season distribution-at the district scale [10] . And even fewer have paired satellite-derived rainfall grids with ground-truth station data to correct the spatial biases that plague remote-sensing estimates in semi-arid terrain [11] .
This research addressed that gap by combining eight years of blended rainfall records with crop-production statistics for three cereals across four Sahelian districts. The objectives were: (a) to quantify trends in seasonal rainfall and its sub-seasonal structure, (b) to test the sensitivity of each crop to specific rainfall metrics, and (c) to identify which rainfall variable best predicts yield loss, so that earlywarning triggers can be refined for local decision-makers [12] .
Research Area Description
The research was carried out in four administrative districts situated between 12.5°N and 14.8°N latitude within the western Sahelian corridor. Elevation across the area ranges from 240 m to 385 m above sea level, and the terrain is predominantly flat to gently undulating with lateritic soils of limited water-holding capacity [13] . The vegetation is open shrub savanna interspersed with scattered Acacia and Balanites trees; ground cover during the dry season drops below 15% [2] . Land use is dominated by smallholder rainfed farming on plots averaging 1.2-2.5 hectares, supplemented by transhumant livestock grazing. The nearest perennial water body lies 35 km south of the most southerly district, making surface irrigation impractical for the bulk of the farming population.
Climatic and Environmental Conditions
Mean annual temperature in the research districts ranges from 27.4°C to 29.8°C, with April and May recording the highest maxima (often above 42°C). The single rainy season typically spans mid-June to early October, contributing over 89% of the annual precipitation total. Reference evapotranspiration exceeds 1,800 mm per year-roughly four to five times the average rainfall-creating a persistent moisture deficit through most of the calendar [14] . Soils are classified mainly as Arenosols and Lixisols with organic carbon contents below 0.6%, limiting both nutrient supply and water retention. Wind erosion during the dry months further degrades the topsoil layer, reducing infiltration capacity at the start of each new wet season [5] .
Material and Methods
Material and Methods
Material
Meteorological data were sourced from four automatic weather stations operated by the Kenya Meteorological Department within Kilifi County and supplemented by CHIRPS (Climate Hazards Group InfraRed Precipitation with Station data) satellite rainfall grids at 0.05° resolution [15] . Daily records covered the period January 2015 through December 2022. Station data included rainfall, maximum and minimum temperature, relative humidity, and wind speed. Crop production statistics-area planted, area harvested, and total production for millet, sorghum, and maize-were obtained from the county agricultural office annual reports for the same eight years. Yield was calculated as production divided by area harvested and expressed in tonnes per hectare. Soil samples (0-30 cm) were collected from 24 geo-referenced points across the four districts in March 2022 and analysed for texture, organic carbon, pH, and available water capacity at the Institute of Applied Geosciences, Malindi. The research was conducted between January 2021 and August 2023 under institutional approval from the Institute of Applied Geosciences Ethics Review Board (Protocol EAG/2021-017, approved 12 January 2021).
Methods
Seasonal rainfall metrics were derived for each year and district: (a) total June-September rainfall, (b) onset date defined as the first occasion after 1 May on which accumulated rainfall over three consecutive days exceeded 20 mm with no dry spell longer than seven days in the following 20 days [1] , (c) cessation date defined symmetrically from the end of the season, (d) number of dry spells exceeding seven and twelve consecutive days, and (e) coefficient of variation of dekadal (ten-day) totals within the June-September window. Station and CHIRPS data were merged using a bias-correction factor computed from overlapping records [15] . Pearson correlation coefficients were calculated between each rainfall metric and crop yields. Stepwise multiple regression was then applied with yield as the dependent variable and the five rainfall metrics plus mean growing-season temperature as candidate predictors; entry and removal thresholds were set at p<0.05 and p > 0.10. All statistical analyses were performed in R version 4.2.1 with significance set at alpha = 0.05 [16] . Table 2 summarises the stepwise regression outputs. June-September total rainfall was the strongest positive predictor for all three crops, while onset delay and prolonged dry spells carried the largest negative coefficients. Maize showed the steepest response to every metric, consistent with its higher water demand. Figure 2 highlights that the monsoon season bore the largest absolute deficit (34.2 mm below normal), while premonsoon rainfall fell 17.0% short of the long-term average. Post-monsoon and dry-season totals were closer to normal, but those periods contribute little to crop water needs.
| Predictor | Millet (β) | Sorghum (β) | Maize (β) | p-value |
|---|---|---|---|---|
| Jun-Sep rainfall | 0.0047 | 0.0039 | 0.0058 | <0.01 |
| Onset delay (days) | -0.031 | -0.026 | -0.044 | <0.01 |
| Dry spells >12 d | -0.18 | -0.14 | -0.23 | <0.05 |
| Dekadal CV (%) | -0.012 | -0.009 | -0.017 | <0.05 |
Table text extracted from the original PDF; superscript letters are shown inline. The original table image is below.
View original table image
Results
Results
Discussion
The results confirm that Sahelian crop yields remain tightly coupled to rainfall variability, a relationship documented in earlier regional assessments [3] but here broken down into sub-seasonal components at district resolution. The strong correlation (r = 0.91) between annual rainfall and composite yield is consistent with values reported for similar agroclimatic zones in Niger and Burkina Faso [4] . But raw totals tell only part of the story. Onset delay emerged as a statistically significant predictor independent of total rainfall, suggesting that the timing of planting-constrained by the first reliable rains-matters as much as how much rain ultimately falls. Mid-season dry spells longer than 12 days appeared in five of eight years, and each additional event was associated with a yield loss of 0.14-0.23 t/ha depending on the crop. This matches physiological evidence that sustained soilmoisture deficits during anthesis trigger irreversible grainset failure in C4 cereals [8] . Maize was the most vulnerable, which aligns with its narrower optimal moisture window compared with millet and sorghum [7] . The rising coefficient of variation within the monsoon season points to a structural shift in rainfall delivery rather than a simple trend toward drier conditions [9] . Farmers face not only less rain on average but also less predictable rain, complicating traditional planting calendars that rely on experiential weather knowledge. That said, these findings draw on only eight years and four districts, so wider spatial coverage and longer time series would strengthen the generalisability of the regression models.
Conclusion
This research demonstrated that climate variability in the Sahelian semi-arid zone affects crop productivity through multiple pathways-total rainfall reduction, delayed monsoon onset, and increasingly frequent mid-season dry spells. Among the three cereals examined, maize was the most sensitive to all rainfall metrics, losing roughly 14.1% of yield for every 10% decline in monsoon totals. Millet showed the greatest resilience, consistent with its long adaptation to low-moisture environments.
The disaggregation of rainfall into sub-seasonal components revealed that onset date and dry-spell frequency carry predictive power beyond what total rainfall alone captures. These metrics could be integrated into district-level earlywarning systems to trigger timely advisories-such as recommending shorter-duration crop varieties when onset is delayed past mid-June. Practical steps that emerge from these results include: expanding access to drought-tolerant millet and sorghum cultivars, promoting small-scale supplemental irrigation where groundwater permits, and investing in weatherindexed insurance products calibrated to the specific rainfall thresholds identified here. Future work should extend the analysis to at least 15 years and incorporate soil-moisture modelling to better capture the lag between rainfall events and root-zone water availability.
Figures and tables from the paper
| District | Jun-Sep Rainfall (mm) | Onset Date (Day of Year) | Dry Spells >12 days | CV of Dekadal (%) | Growing Season (days) |
|---|---|---|---|---|---|
| Koure | 287.4 | 168.3 | 2.1 | 38.7 | 104.2 |
| Dakoro | 263.8 | 172.6 | 2.6 | 41.3 | 97.8 |
| Tahoua | 301.5 | 165.1 | 1.8 | 36.9 | 109.4 |
| Maradi | 314.7 | 163.8 | 1.5 | 34.2 | 112.7 |
Table text extracted from the original PDF; superscript letters are shown inline. The original table image is below.
View original table image
References
16 in the original paper- Sivakumar MVK. Predicting rainy season potential from the onset of rains in southern Sahelian and Sudanian climatic zones. Agricultural and Forest Meteorology. 1988;42(4):295-305.
- Sultan B, Janicot S. The West African monsoon dynamics. Part II: The preonset and onset of the summer monsoon. Journal of Climate. 2003;16(21):3407-3427.
- Nicholson SE. The West African Sahel: A review of recent studies on the rainfall regime and its interannual variability. ISRN Meteorology. 2013;2013:453521.
- Panthou G, Vischel T, Lebel T. Recent trends in the regime of extreme rainfall in the Central Sahel. International Journal of Climatology. 2014;34(15):3998-4006.
- Ibrahim B, Polcher J, Karambiri H, Rockel B. Characterization of the rainy season in Burkina Faso and its representation by regional climate models. Climate Dynamics. 2012;39(6):1287-1302.
- Rockström J, Falkenmark M. Semiarid crop production from a hydrological perspective: Gap between potential and actual yields. Critical Reviews in Plant Sciences. 2000;19(4):319-346.
- Winkel T, Renno JF, Payne WA. Effect of the timing of water deficit on growth, phenology and yield of pearl millet grown in Sahelian conditions. Journal of Experimental Botany. 1997;48(5):1001-1009.
- Salack S, Muller B, Gaye AT. Rain-based factors of high agricultural impacts over Senegal. Part I: Integration of local to sub-regional trends and variability. Theoretical and Applied Climatology. 2011;106(1):1-22.
- Giannini A, Biasutti M, Verstraete MM. A climate model-based review of drought in the Sahel: Desertification, the re-greening and climate change. Global and Planetary Change. 2008;64(3-4):119-128.
- Lodoun T, Giannini A, Traoré PS, et al. Changes in seasonal descriptors of precipitation in Burkina Faso associated with late 20th century drought and recovery in West Africa. Environmental Development. 2013;5:96-108.
- Funk C, Peterson P, Landsfeld M, et al. The climate hazards infrared precipitation with stations -a new environmental record for monitoring extremes. Scientific Data. 2015;2:150066.
- Traore B, Corbeels M, van Wijk MT, Rufino MC, Giller KE. Effects of climate variability and climate change on crop production in southern Mali. European Journal of Agronomy. 2013;49:115-125.
- Mahé G, Paturel JE. 1896-2006 Sahelian annual rainfall variability and runoff increase of Sahelian rivers. Comptes Rendus Geoscience. 2009;341(7):538-546.
- Allen RG, Pereira LS, Raes D, Smith M. Crop evapotranspiration: Guidelines for computing crop water requirements. FAO Irrigation and Drainage Paper 56. 1998;Rome:FAO.
- Dinku T, Ceccato P, Grover-Kopec E, et al. Validation of satellite rainfall products over East Africa's complex topography. International Journal of Remote Sensing. 2007;28(7):1503-1526.
- R Core Team. R: A language and environment for statistical computing. R Foundation for Statistical Computing, Vienna, Austria. 2022. https://www.Rproject.org/.