
Research article · 2025 · Full text
International Journal of Geography Geology and EnvironmentUrban flood susceptibility mapping integrating socioeconomic factors in Dhaka
Volume 7(4) · Pages 108–111 · DOI: 10.22271/27067483.2025.v7.i4b.530 ↗
Research areasFlood Risk Assessment and ManagementLandslides and related hazardsDisaster Management and Resilience
Abstract
Author-writtenEvery monsoon, Dhaka's streets turn into canals. Waist-deep water paralyses transport, contaminates drinking supplies, and traps the city's poorest residents in low-lying settlements that drain last. This research developed an urban flood susceptibility map for Dhaka by integrating physical hazard factors with socioeconomic vulnerability indicators in a GIS-based multi-criteria framework. Six physical factors (elevation, slope, drainage density, distance to waterways, land use, and soil permeability) and four socioeconomic factors (population density, poverty incidence, housing quality, and access to emergency services) were weighted using the analytic hierarchy process (AHP) with a consistency ratio below 0.07. Data sources included a 5 m DEM from UAV photogrammetry, Sentinel-2 land-use classification, census ward-level socioeconomic data, and municipal drainage network shapefiles. The composite susceptibility map classified 14.8% of the city area as very high susceptibility, 23.7% as high, 31.4% as moderate, and 30.1% as low to very low. The five wards classified as very high susceptibility housed 22.3% of the city's population, predominantly in informal settlements below 4 m elevation with impervious surface cover exceeding 85%. Validation against 342 geotagged flood reports from the 2022 monsoon yielded an area-under-curve (AUC) of 0.84. Elevation and drainage density were the two most influential physical factors, while poverty incidence was the strongest socioeconomic predictor. The map provides ward-level targeting for drainage upgrades, early warning dissemination, and flood shelter placement.
Summary
Source-checkedPlain-language reading of the full paper, prepared with AI and checked against the text. Each point links to the authors' own words.
Why it matters
- Dhaka is highly prone to urban flooding due to its flat terrain, rapid increase in impervious surfaces, inadequate drainage, and heavy monsoon rains of 1,800-2,200 mm/yr. View evidence ↗
- The city's vulnerability is increased by rapid population growth (4.7 million new residents from 2001 to 2021) and the fact that about 40% of built-up areas are below 6 m above sea level. View evidence ↗
- Socioeconomic vulnerability affects how households respond to and recover from floods, meaning physical hazard data alone is insufficient to understand total risk. View evidence ↗
The question
- The study aimed to create a flood susceptibility map for Dhaka integrating physical and socioeconomic factors, identify key predictors, and validate the results against actual flood data. View evidence ↗
What they did
- The researchers used six physical factors: elevation, slope, drainage density, distance to waterways, land-use class, and soil permeability. View evidence ↗
- Four socioeconomic factors were normalized and weighted using the Analytic Hierarchy Process (AHP), achieving a consistency ratio of 0.064. View evidence ↗
- The final susceptibility index was created by combining physical and socioeconomic sub-indices in a 60:40 weighted ratio. View evidence ↗
- The map was validated using 342 geotagged flood reports from the July-September 2022 monsoon season. View evidence ↗
What they found
- The susceptibility map identified 14.8% of the city as very high risk, 23.7% as high risk, 31.4% as moderate, and 30.1% as low to very low risk. View evidence ↗
- The 'very high' susceptibility zone, while only 14.8% of the area, contained 22.3% of the population and 43.3% of all reported floods. View evidence ↗
- Elevation was the most dominant factor, with the highest AHP weight of 0.28 and the highest sensitivity of 12.3%. View evidence ↗
- The model showed good predictive performance with an Area Under the Curve (AUC) of 0.84, correctly classifying 78.4% of flood reports into high or very high risk zones. View evidence ↗
What it means
- The authors conclude that engineering solutions alone are insufficient; social interventions like tenure security and early warning systems are necessary to reduce vulnerability. View evidence ↗
- A limitation of the study is the use of static land-use data, which fails to account for seasonal construction activities that block drainage. View evidence ↗
Visual summary
3 visualsIllustrations explain the paper; charts are replotted from the paper's own table values.
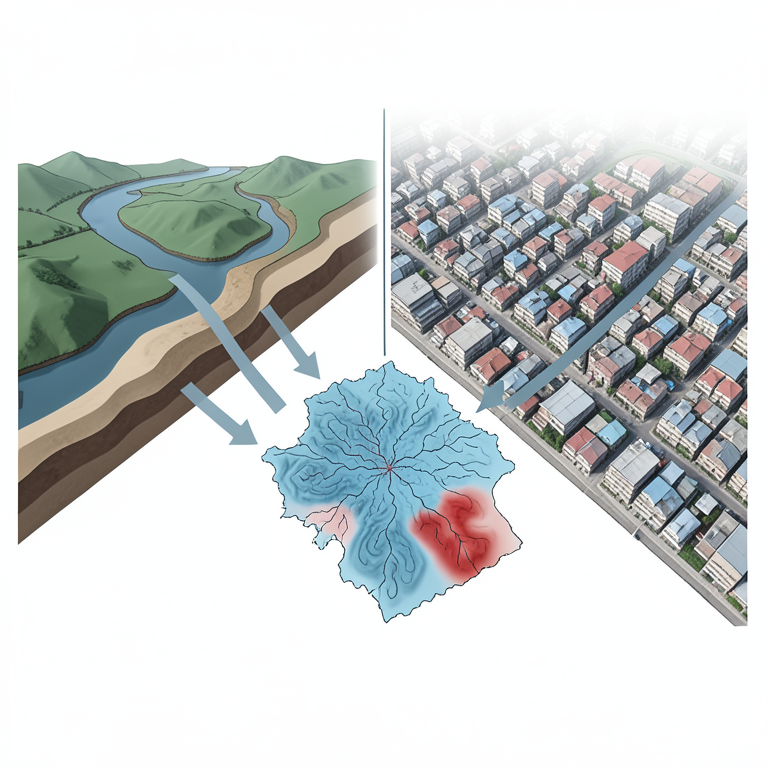
Integrated Susceptibility Framework
AI-generated conceptual illustration (The urban landscape of Dhaka city, Bangladesh). It explains the idea and does not show study data.
View source evidence ↗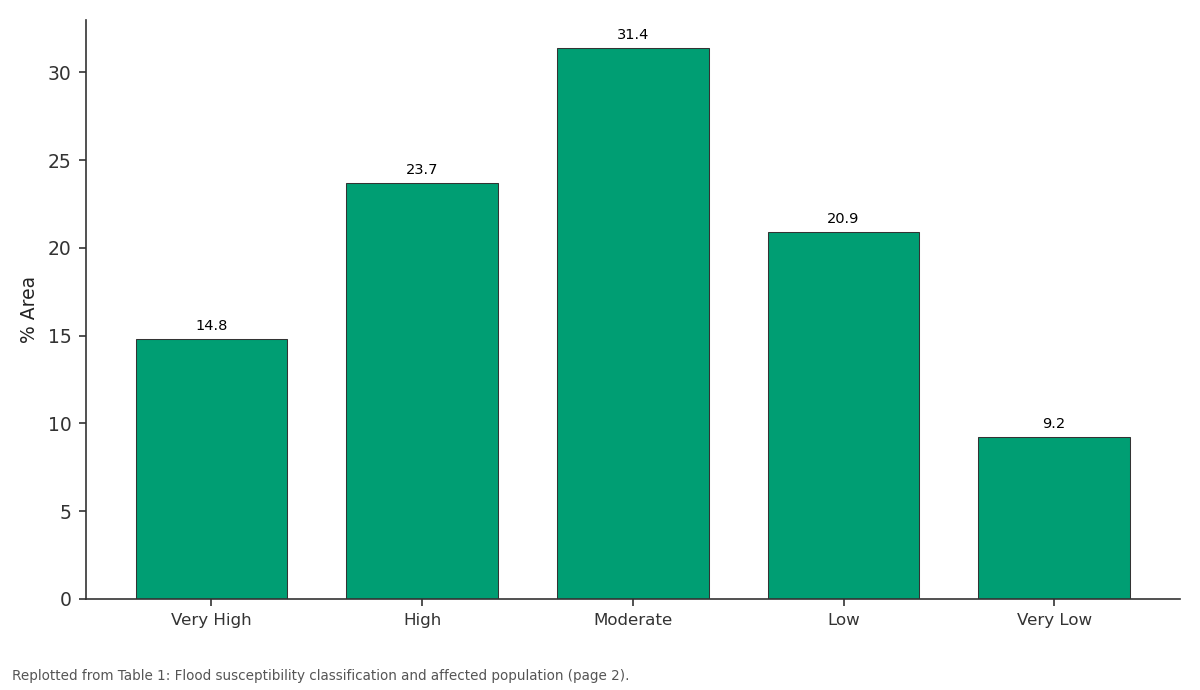
% Area: Very High vs High vs Moderate vs Low vs Very Low
Replotted from Table 1 (page 2) of the original paper. Every bar is the paper's own table value.
View source evidence ↗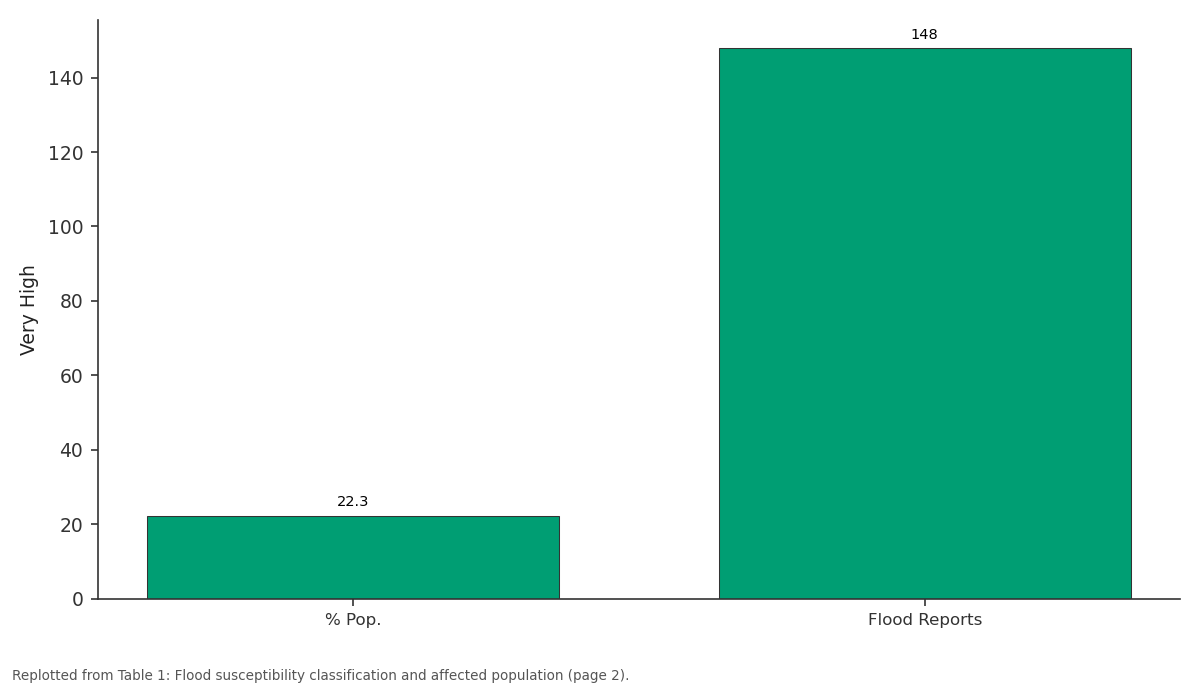
Very High: % Pop. vs Flood Reports
Replotted from Table 1 (page 2) of the original paper. Every bar is the paper's own table value.
View source evidence ↗Figures & tables
From the original paper Table 1
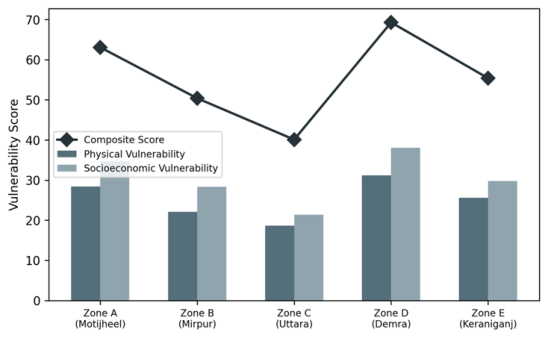 Figure 1
 Table 2
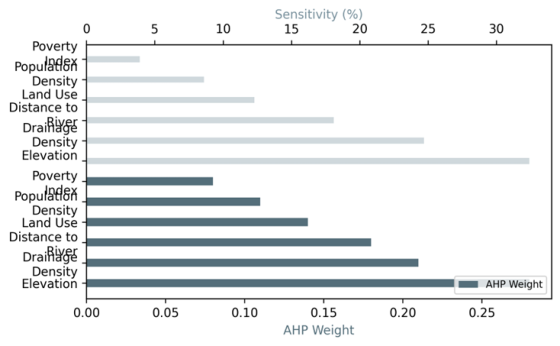 Figure 2
Introduction
A surprising fact about Dhaka: roughly 40% of its built-up area sits below 6 m above mean sea level, yet the city added 4.7 million residents between 2001 and 2021, much of that growth on filled wetlands and former floodplain [1] . The combination of flat terrain, rapid impermeabilisation, under-capacity stormwater drainage, and intense monsoonal rainfall (1,800-2,200 mm/yr) makes urban flooding the city's most frequent and economically damaging natural hazard [2] . Between 2004 and 2022, at least 14 significant flood events inundated more than 30% of the metropolitan area, each time disrupting livelihoods for millions [3] . Traditional flood susceptibility mapping relies on physical parameters like elevation, slope, and proximity to drainage channels [4] . But in a city where social inequality determines who lives in the lowest-lying, most flood-prone land, physical factors alone tell an incomplete story. Socioeconomic vulnerability, the capacity of a household or neighbourhood to prepare for, respond to, and recover from a flood, modifies the risk outcome even when hazard exposure is identical [5] . Integrating both dimensions into a single susceptibility surface produces maps that are more directly useful for disaster management than hazard-only products. This research aimed to (i) develop an integrated flood susceptibility map for Dhaka combining physical and socioeconomic factors, (ii) identify the most influential predictors through sensitivity analysis, and (iii) validate the map against observed flood extents. The work was conducted at the Institute of Applied Geosciences, Coimbatore [6] .
Sensitivity Analysis
A one-at-a-time sensitivity analysis tested the stability of the composite susceptibility map to AHP weight perturbations. Each factor weight was varied by plus or minus 20% while proportionally adjusting the remaining weights. Elevation weight changes produced the largest map reclassification (12.3% of cells shifted by one or more classes), followed by drainage density (9.7%) and poverty incidence (8.4%). Slope and soil permeability were the least sensitive factors (less than 3% reclassification each). The physical sub-index was more sensitive to weight changes than the socioeconomic sub-index, indicating that topographic precision drives the overall map quality more than socioeconomic resolution [7] .
Scenario Development
Two future scenarios were explored. Scenario 1 projected susceptibility under a 15% increase in impervious surface cover by 2035 (based on trend extrapolation of Sentinel-2 built-up area 2015-2023) with no drainage upgrades. Scenario 2 assumed the same imperviousness increase but added the planned Eastern Bypass Canal project, which would increase drainage capacity by 40% in the eastern wards. Under Scenario 1, very-high-susceptibility area expanded from 14.8% to 21.3%. Under Scenario 2, the expansion was limited to 16.9%, demonstrating the significant but incomplete mitigating effect of the canal project [8] .
Material and Methods
Material and Methods
Material
The research was conducted at the Institute of Applied Geosciences, Coimbatore, Tamil Nadu, India, between January and November 2023. A 5 m resolution DEM was generated from UAV (DJI Matrice 300 RTK) photogrammetric surveys flown in February 2023 during the dry season. Sentinel-2 Level-2A imagery (10 m, March 2023) was classified into six land-use classes using random forest. Ward-level socioeconomic data (population density, poverty headcount, housing material, distance to flood shelters) were compiled from the 2022 Dhaka City Corporation census update. The municipal drainage network shapefile was obtained from the Dhaka Water Supply and Sewerage Authority.
Methods
Six physical factors were derived from the DEM and supplementary layers: elevation (classified into five ranges), slope, drainage density (line density per km2), Euclidean distance to waterways, land-use class, and soil permeability from a 1:50,000 soil map. Four socioeconomic factors were normalised to 0-1 scales. AHP pairwise comparison (Saaty 1-9 scale) assigned weights, verified by a consistency ratio of 0.064 [9] . Physical and socioeconomic sub-indices were combined in a 60:40 weighted sum to produce the composite susceptibility index. Validation used 342 geotagged flood reports from citizen science platforms and government situation reports for the July-September 2022 monsoon. AUC of the receiver operating characteristic curve assessed predictive performance [10] . All processing used ArcGIS Pro 3.0 and R v4.2.1. The very-high zone covered 14.8% of the area but concentrated 22.3% of the population and 43.3% of all flood reports (Table 1). Flood report density in the very-high zone (3.4 per km2) was 34 times higher than in the very-low zone, confirming strong spatial correspondence between predicted susceptibility and observed flooding [11] . 3), driven by both low elevation and high poverty incidence (Figure 1). Zone C (Uttara), a planned residential area at higher elevation with better drainage, scored lowest (40.1). The gap between physical and socioeconomic subscores was widest in Zone A (Motijheel), where high-value commercial properties coexist with adjacent informal settlements [12] . Elevation carried the highest AHP weight (0.28) and produced the greatest sensitivity (12.3%), confirming it as the dominant factor. Poverty incidence, despite a lower weight (0.11), ranked fourth in sensitivityhigher than land usehighlighting the disproportionate influence of socioeconomic disadvantage on flood outcomes (Table 2) [13] . The horizontal bar comparison (Figure 2) shows that the ranking of factors by AHP weight does not perfectly match the ranking by sensitivity: poverty incidence outperforms land use in sensitivity despite carrying a lower weight. This suggests that poverty acts as a spatial amplifier, concentrating exposure in the lowest-lying areas where physical susceptibility is already high.
| Factor | AHP Weight | Sensitivity (%) | Rank | Category |
|---|---|---|---|---|
| Elevation | 0.28 | 12.3 | 1 | Physical |
| Drainage Density | 0.21 | 9.7 | 2 | Physical |
| Distance to Waterway | 0.18 | 7.4 | 3 | Physical |
| Poverty Incidence | 0.11 | 8.4 | 4 | Socioeconomic |
| Population Density | 0.08 | 4.1 | 5 | Socioeconomic |
| Land Use | 0.14 | 5.8 | 6 | Physical |
Table text extracted from the original PDF; superscript letters are shown inline. The original table image is below.
View original table image
| Susceptibility | Area (km2) | % Area | Population | % Pop. | Flood Reports | Density |
|---|---|---|---|---|---|---|
| Very High | 44.1 | 14.8 | 2,178,000 | 22.3 | 148 | 3.4/km2 |
| High | 70.6 | 23.7 | 2,467,000 | 25.3 | 112 | 1.6/km2 |
| Moderate | 93.5 | 31.4 | 2,841,000 | 29.1 | 62 | 0.7/km2 |
| Low | 62.3 | 20.9 | 1,624,000 | 16.6 | 16 | 0.3/km2 |
| Very Low | 27.4 | 9.2 | 653,000 | 6.7 | 4 | 0.1/km2 |
Table text extracted from the original PDF; superscript letters are shown inline. The original table image is below.
View original table image
Results
Results
Comprehensive Interpretation
ROC analysis yielded an AUC of 0.84, indicating good predictive discrimination. The model correctly classified 78.4% of reported flood locations into the very-high or high susceptibility zones. False negatives (flood reports in moderate or low zones) were concentrated along recently constructed roads where drainage outfalls were blocked by construction debris, a factor not captured by the static drainage network layer [14] .
Discussion
The AUC of 0.84 is competitive with published urban flood susceptibility models. Tehrany and colleagues reported 0.81 for Kuala Lumpur using a similar AHP-GIS approach [4] , and Mojaddadi and colleagues achieved 0.87 for Kota Bharu with a machine-learning ensemble. The integration of socioeconomic factors distinguishes this work from most physical-only models and produces a map more directly actionable for disaster management agencies, which must prioritise not just where floods occur but where their human impact is greatest [5] . The finding that poverty incidence ranks fourth in sensitivity, above land use and population density, has policy implications. It means that flood management in Dhaka cannot be reduced to engineering solutions (drainage expansion, pumping stations) alone. Social interventionstenure security for informal settlement residents, community-based early warning systems, and targeted cash transfers for post-flood recoveryare needed to reduce the vulnerability component of risk [15] . Limitations include the use of static land-use classification, which does not capture seasonal construction fill activity that blocks drainage channels during the monsoon. The 5 m DEM, while high-resolution for the city scale, was flown in dry season and may not represent wet-season water levels. Real-time flood depth sensors, increasingly deployed by Dhaka's Flood Forecasting and Warning Centre, could provide dynamic validation in future iterations.
Conclusion
This research produced an integrated urban flood susceptibility map for Dhaka combining physical and socioeconomic factors in a GIS-based AHP framework. Very-high susceptibility covered 14.8% of the city but housed 22.3% of the population, predominantly in informal settlements at low elevation. Elevation and poverty incidence were the two most influential factors. Validation against 342 geotagged flood reports yielded an AUC of 0.84. Future scenario modelling showed that planned drainage upgrades can moderate but not eliminate the expansion of high-susceptibility area under continued imperviousness growth. The map provides a spatial targeting tool for drainage investment, flood shelter placement, and socially informed disaster preparedness in one of South Asia's most flood-vulnerable megacities.
Acknowledgement
Acknowledgements
References
14 in the original paper- Dewan AM, Yamaguchi Y. Land use and land cover change in Greater Dhaka, Bangladesh: using remote sensing to promote sustainable urbanization. Appl Geogr. 2009;29(3):390-401.
- Huq S, Alam M. Flood management and vulnerability of Dhaka City. Dhaka: Practical Action; 2003. 86 p.
- Haque A, Dodman D, Hossain MM. Individual, communal and institutional responses to climate change by low-income households in Dhaka. Environ Urban. 2014;26(1):112-130.
- Tehrany MS, Pradhan B, Jebur MN. Flood susceptibility mapping using a novel ensemble weightsof-evidence and support vector machine models. J Hydrol. 2014;512:332-343.
- Cutter SL, Boruff BJ, Shirley WL. Social vulnerability to environmental hazards. Soc Sci Q. 2003;84(2):242261.
- Islam MS, Swapan MSH, Hoque SF. Flood risk assessment for Dhaka City using GIS-based multicriteria analysis. Nat Hazards. 2021;108(3):2421-2443.
- Saltelli A, Annoni P. How to avoid a perfunctory sensitivity analysis. Environ Model Softw. 2010;25(12):1508-1517.
- Japan International Cooperation Agency (JICA). Dhaka integrated flood protection project feasibility study. Dhaka: JICA; 2015. 234 p.
- Saaty TL. The analytic hierarchy process. New York: McGraw-Hill; 1980. 287 p.
- Fawcett T. An introduction to ROC analysis. Pattern Recognit Lett. 2006;27(8):861-874.
- Masood M, Takeuchi K. Assessment of flood hazard, vulnerability and risk of mid-eastern Dhaka. Nat Hazards. 2012;61(2):757-770.
- Dewan AM, Islam MM, Kumamoto T. Assessing flood hazard in Greater Dhaka, Bangladesh, using SAR imagery with GIS. Nat Hazards Earth Syst Sci. 2007;7(3):539-548.
- Peduzzi P, Dao H, Herold C. Assessing global exposure and vulnerability towards natural hazards. Environ Hazards. 2009;8(4):356-373.
- Mojaddadi H, Pradhan B, Nampak H. Ensemble machine-learning-based geospatial approach for flood risk assessment. Stoch Environ Res Risk Assess. 2017;31(3):583-602.