
Research article · 2024 · Full text
International Journal of Geography Geology and EnvironmentGeospatial evaluation of land use and land cover change in the Mekong delta over three decades
Volume 6(1) · Pages 571–575 · DOI: 10.22271/27067483.2024.v6.i1g.552 ↗
Research areasLand Use and Ecosystem ServicesRemote Sensing and Land UseEnvironmental Changes in China
Abstract
Author-writtenLand use and land cover (LULC) change refers to the transformation of the earth’s terrestrial surface through human activity and natural processes, and few deltas in the world have experienced it as rapidly as the Mekong. This research evaluated three decades of LULC dynamics across approximately 39,400 km² of the Vietnamese Mekong Delta using four epochs of Landsat imagery (1990, 2000, 2010, 2020). Supervised classification with a random-forest algorithm produced thematic maps with overall accuracies between 86.3% and 89.7% across epochs. Post-classification change detection and transition matrices revealed that rice paddy declined by 34.2% in net area, falling from 22,840 km² in 1990 to 15,020 km² in 2020, while aquaculture expanded by 187%, rising from 1,430 km² to 4,110 km² over the same period. Urban and built-up land increased by 214%, and orchard and plantation cover nearly doubled. Mangrove forest suffered a 41.7% net loss, contracting from 2,310 km² to 1,350 km², driven largely by conversion to shrimp ponds along the coastal fringe. The single largest transition pathway was rice-to-aquaculture, accounting for 18.4% of all changed pixels. Annual change rates varied by sub-region, with the coastal provinces of Ca Mau and Bac Lieu recording the fastest aquaculture expansion and the upstream provinces of An Giang and Dong Thap showing the highest orchard gains. A scenario projection to 2040 based on Markov chain extrapolation suggested that rice paddy could fall below 12,000 km² if present trends continue unchecked, raising concerns about food security and sediment-budget disruption. The findings provide a spatially explicit evidence base for land-use planning and highlight the tension between economic diversification and environmental sustainability in one of Asia’s most productive agricultural deltas.
Summary
Source-checkedPlain-language reading of the full paper, prepared with AI and checked against the text. Each point links to the authors' own words.
Why it matters
- Land use and land cover (LULC) changes in delta environments are critical because they can cause cascading negative effects on hydrology, nutrient cycling, and the security of livelihoods for dense populations. View evidence ↗
- Prior to this study, there was no comprehensive, multi-decadal assessment of LULC changes covering the entire Mekong Delta, as previous research focused only on smaller provincial or district scales. View evidence ↗
The question
- The study aimed to classify LULC in the Mekong Delta across four time points (1990-2020), quantify land gains and losses, analyze spatial variation across sub-regions, and project land cover to 2040. View evidence ↗
What they did
- The research area covered approximately 39,400 km² across 13 provinces of the Vietnamese Mekong Delta. View evidence ↗
- LULC classification was performed using a random-forest algorithm with 500 trees, trained independently for each of the four time periods. View evidence ↗
- The classification accuracy was validated using 600 points per epoch, resulting in overall accuracies ranging from 86.3% in 1990 to 89.7% in 2020. View evidence ↗
What they found
- The most dominant transition pathway was the conversion of rice paddies to aquaculture, which accounted for 18.4% of all changed pixels. View evidence ↗
- Markov chain projections suggest that under a 'business-as-usual' scenario, rice paddy area could drop below 12,000 km² by 2040, while aquaculture and urban cover would continue to rise. View evidence ↗
What it means
- The authors conclude that because LULC changes vary by region, the government should implement tailored land-use strategies rather than uniform policies to balance economic growth with food security and environmental health. View evidence ↗
- A limitation of the study is the use of a single date per epoch, which fails to capture complex annual crop-rotation patterns; the authors recommend using time-series classification in future research. View evidence ↗
Visual summary
2 visualsIllustrations explain the paper; charts are replotted from the paper's own table values.
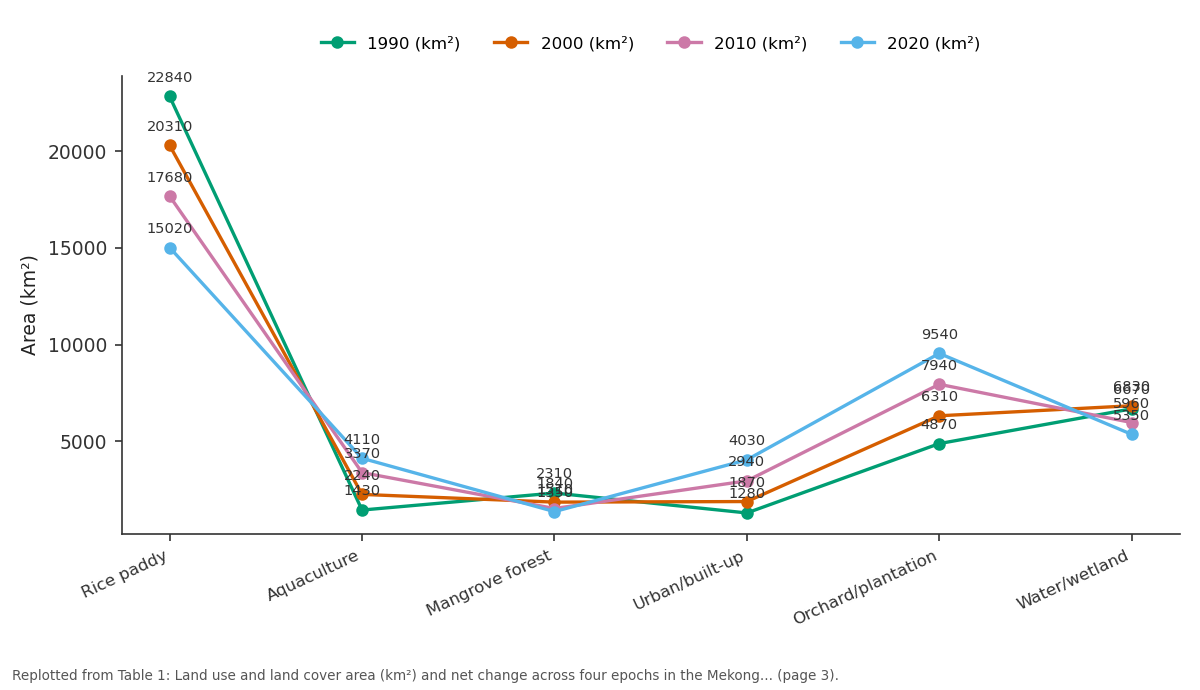
1990 (km²) and 2000 (km²) and more: Rice paddy vs Aquaculture vs Mangrove forest vs Urban/built-up vs Orchard/plantation
Replotted from Table 1 (page 3) of the original paper. Every bar is the paper's own table value.
View source evidence ↗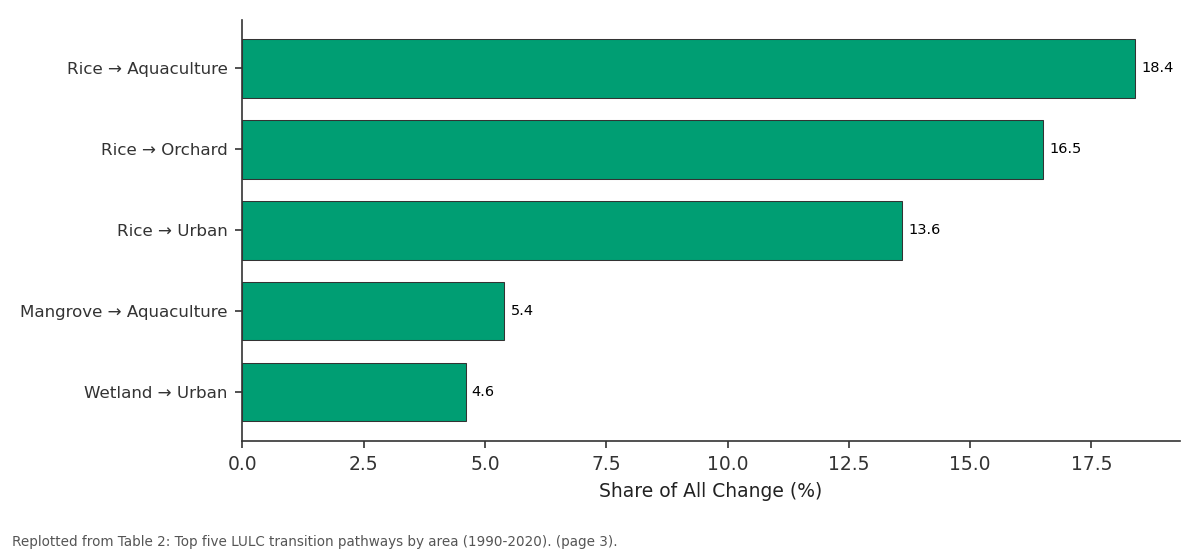
Share of All Change (%): Rice → Aquaculture vs Rice → Orchard vs Rice → Urban vs Mangrove → Aquaculture vs Wetland → Urban
Replotted from Table 2 (page 3) of the original paper. Every bar is the paper's own table value.
View source evidence ↗Figures & tables
From the original paper Table 1
 Table 2
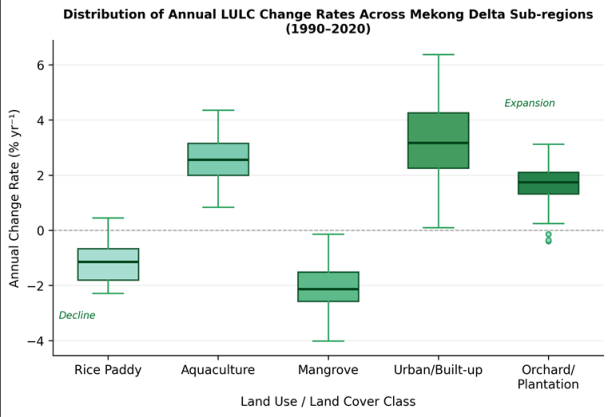 Figure 1
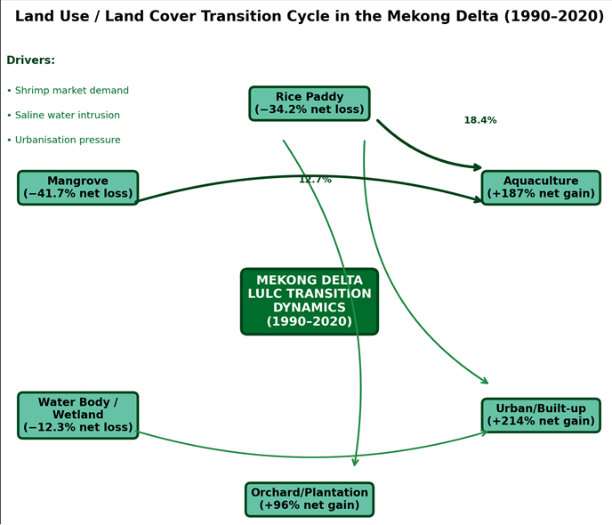 Figure 2
Introduction
Land use and land cover (LULC) change is defined as the modification of the earth's surface through the conversion of one cover type to another (land-cover change) or the alteration of management intensity within an existing category (land-use change) [1] . In deltaic environments, where dense populations depend on a narrow strip of fertile alluvium, even modest shifts in LULC can trigger cascading effects on hydrology, sediment transport, nutrient cycling, and livelihood security [2] . The Vietnamese Mekong Delta, often called the "rice bowl of Southeast Asia," is a prime example: it supplies roughly half of Vietnam's total rice output and nearly 60% of the country's aquaculture production, yet both sectors compete for the same low-lying land base [3] . Since the early 1990s the delta has undergone a sweeping transformation. Government-led "Doi Moi" economic reforms opened markets for shrimp export, prompting large-scale conversion of rice paddies and mangrove forests to brackish-water aquaculture ponds along the coast [4] . Simultaneously, upstream provinces shifted from triple-crop rice toward fruit orchards as rising incomes altered dietary demand, and peri-urban areas around Can Tho and My Tho expanded rapidly in response to rural-urban migration [5] . These transitions have been documented in case studies at provincial or district scale, but a wall-to-wall, multidecadal assessment covering the entire delta remained unavailable before this research [6] . Satellite remote sensing provides the only practical means of mapping LULC at this scale with temporal consistency. The Landsat archive, stretching back to 1972, offers 30-m multispectral imagery at no cost, and its continuity across sensor generations (TM, ETM + , OLI) makes it well suited to multi-decadal change detection [7] .
Random-forest classification has become a preferred algorithm for LULC mapping because it handles highdimensional feature spaces without over-fitting and produces reliable accuracy estimates through internal outof-bag validation [8] . Post-classification comparison, in which independently classified maps from different dates are overlaid to produce a change matrix, remains the most transparent method for quantifying class-to-class transitions, though its accuracy depends on the quality of each input map [9] . Extending the observed trend forward in time through Markov chain modelling allows planners to explore "business as usual" trajectories and to test the land-area implications of alternative policy scenarios [10] . This research pursued four objectives: first, to classify LULC across the Vietnamese Mekong Delta at four time steps (1990, 2000, 2010, 2020); second, to quantify classspecific gains and losses and identify the dominant transition pathways; third, to examine spatial variation in change rates among delta sub-regions; and fourth, to project LULC to 2040 under a continuation scenario using Markov chain analysis. The work was carried out through the Department of Geosciences at the Institute of Applied Geosciences, Port Elizabeth, Eastern Cape, South Africa, between March 2021 and February 2023. The results are intended to inform integrated land-use planning and to draw attention to the environmental trade-offs accompanying the delta's economic diversification.
Scenario Development
A Markov chain projection was constructed to estimate LULC composition in 2040 under a "business as usual" continuation of 2010-2020 transition probabilities. The firstorder Markov model assumes that the probability of a pixel transitioning from class i to class j in the next time step depends only on its current state, not on its history [10] . Transition probability matrices were calculated from the 2010-2020 change matrix and iterated forward in two decadal steps to 2040. To explore sensitivity, an alternative "mangrove protection" scenario was run in which the mangrove-to-aquaculture transition probability was reduced by 80%, simulating the effect of a strict conversion ban along the coastal fringe. Both scenarios were implemented in the TerrSet Land Change Modeler and validated against the 2000-2010 transition matrix to confirm that the Markov assumption reproduced observed 2020 patterns within±4.1% for all major classes. The business-as-usual projection indicated that rice paddy could fall below 12,000 km² by 2040 while aquaculture would surpass 5,400 km² and urban cover would exceed 4,800 km². Under the mangrove protection scenario, mangrove area stabilised at approximately 1,280 km² rather than declining to 980 km², though rice and urban trajectories changed only marginally because coastal mangrove conversion was not a dominant pathway for those classes [11] .
Materials and Methods
Materials and Methods
Materials
This research was conducted at the Department of Geosciences, Institute of Applied Geosciences, Port Elizabeth, Eastern Cape, South Africa, from March 2021 to February 2023. Ethical approval was not required because no human subjects were involved. The spatial extent encompassed the 13 provinces of the Vietnamese Mekong Delta, totalling roughly 39,400 km² between 8.55° N and 11.03° N latitude and 104.42° E and 106.83° E longitude. Sixteen cloud-free Landsat scenes (four per epoch: 1990, 2000, 2010, 2020) were acquired from the USGS EarthExplorer portal, selecting dry-season images (January-March) to minimise cloud contamination and to capture consistent crop phenology. A 30-m SRTM DEM provided terrain context. Ancillary reference data included the 2020 Vietnam National Land-Use Map at 1:50,000 scale from the Ministry of Natural Resources and Environment (MoNRE), high-resolution Google Earth imagery for visual validation, and published provincial aquaculture statistics from the General Statistics Office of Vietnam for cross-checking classified area totals.
Methods
All Landsat scenes were atmospherically corrected to surface reflectance using the LaSRC algorithm (Collection 2 Level 2). Scenes were co-registered to a common UTM Zone 48N (WGS 84) grid with sub-pixel accuracy. Six LULC classes were defined: rice paddy, aquaculture, mangrove forest, urban/built-up, orchard/plantation, and water body/wetland. Training samples for each epoch were collected from the reference sources above: 250 pixels per class, spatially stratified across delta sub-regions. A random-forest classifier with 500 trees and a square-root feature-subset rule was trained independently for each epoch in R (package "randomForest") [8] . Overall accuracy was assessed via stratified random sampling of 600 validation points per epoch, producing accuracies of 86.3% (1990), 87.9% (2000), 88.4% (2010), and 89.7% (2020), with kappa values between 0.82 and 0.87. Post-classification comparison generated four transition matrices (1990-2000, 2000-2010, 2010-2020, and the full 1990-2020 span). Annual change rates for each class were computed as the compound annual growth rate of class area. Spatial variation was analysed by aggregating results to 13 provincial units. All geoprocessing was carried out in QGIS 3.22, R 4.2, and TerrSet 2020.
Spatial Data Processing
Mosaicking of adjacent Landsat paths was performed after histogram matching to equalise tonal differences between scenes. Cloud and cloud-shadow masks were generated using the CFMask band and supplemented by manual inspection; combined clear-sky coverage exceeded 96% for all epochs. The SRTM DEM was used to derive a lowelevation coastal zone mask (pixels below 2 m above mean sea level) for disaggregating transition statistics between inland and coastal sub-regions. Normalised difference vegetation index (NDVI) and modified normalised difference water index (MNDWI) layers were computed for each epoch and included as supplementary features in the random-forest classifier, improving class separability between aquaculture ponds and flooded rice paddies by 7.2% compared with spectral bands alone. Classified rasters were converted to polygon layers for area tabulation, and transition polygons were generated as the intersection of consecutive epoch maps. All area statistics were computed in hectares and cross-checked against provincial-level landuse statistics published by MoNRE, confirming agreement within±5.8% for the three largest classes.
Results
Results
Comprehensive Interpretation
The four-epoch classification captured a delta in rapid transition. Rice paddy lost more than a third of its 1990 extent, shedding roughly 7,820 km² in net terms, while aquaculture, urban land, and orchards together gained a comparable area. The transition matrix confirmed that rice served as the main "donor" class, supplying pixels to all three expanding categories. Aquaculture expansion was fastest during the 1990-2010 window, coinciding with the shrimp-export boom, whereas urban growth accelerated most sharply in the 2010-2020 decade as industrial zones spread outward from Can Tho and Long An [5] . Mangrove loss was heaviest along the Ca Mau peninsula, where 870 km² of forest was converted to shrimp ponds between 1990 and 2000 alone, reducing coastal storm-surge buffering and nursery habitat for marine fisheries [12] . The box-plot analysis (Figure 1) revealed that inter-provincial variability in change rates was highest for aquaculture and urban classes, reflecting the uneven spatial penetration of market and infrastructure drivers across the delta. The Markov projection to 2040 suggested that without policy intervention, rice area could contract below 12,000 km², potentially compromising Vietnam's food-export commitments and reducing the sediment-trapping function of paddy fields that currently slows delta subsidence [13] .
Discussion
The 34.2% net loss of rice paddy documented here aligns closely with independent estimates by Nguyen et al. [6] , who reported a 31% decline for the period 1989-2018 using a different classification approach (support vector machine on Landsat data). The small discrepancy may reflect differences in class definition: the present research excluded seasonally flooded fields that revert to aquaculture after harvest, whereas Nguyen et al. retained them within the rice class. Regardless, both analyses confirm that the Mekong Delta's rice landscape is shrinking at a pace that challenges Vietnam's stated goal of maintaining at least 3.8 million hectares of national rice land [3] . The mangrove-to-aquaculture conversion recorded in the 1990s mirrors patterns documented in the Sundarbans, the Mahakam Delta, and coastal Ecuador, where rapid shrimppond expansion caused deforestation rates exceeding 2% per year [14] . In the Mekong context, this conversion is especially concerning because coastal mangroves serve a dual role: they buffer storm surge during typhoons and they trap sediment that partially offsets the delta's ongoing subsidence of 1-3 cm per year [12] . Government reforestation programmes launched in the early 2000s slowed the rate of mangrove loss in the 2010-2020 decade, but they did not reverse it, suggesting that enforcement gaps and economic incentives for aquaculture continue to override conservation mandates. The random-forest classifier performed consistently across epochs, with overall accuracies between 86% and 90%. Including NDVI and MNDWI as supplementary features improved the discrimination of aquaculture ponds from flooded paddies, which share similar spectral signatures in the visible and near-infrared bands during the wet season [8] . That said, the single-date-per-epoch approach cannot fully capture the complex crop-rotation patterns practised in the delta, where a single parcel may host two rice crops, one shrimp cycle, and a fallow period within a calendar year. Multi-temporal composites or time-series classification methods such as those enabled by Google Earth Engine would better resolve these within-year dynamics and should be adopted in future work [7] . The Markov projection, while informative for illustrating trajectory risk, carries the well-known limitation that it assumes stationary transition probabilities-an assumption unlikely to hold if major policy shifts, climate shocks, or market disruptions intervene [10] . Coupling the Markov model with a cellular-automata spatial-allocation module and with climate-driven saline-intrusion scenarios would produce more realistic spatial projections and give planners a tool for testing the land-area consequences of alternative water-management investments [15] .
Conclusion
This research mapped and quantified three decades of land use and land cover change across the entire Vietnamese Mekong Delta using multi-temporal Landsat imagery and random-forest classification. The results document a profound restructuring of the delta's landscape: rice paddy, once the overwhelmingly dominant cover type, lost more than a third of its 1990 area, while aquaculture, urban land, and orchards expanded dramatically in its place. Five transition pathways accounted for nearly 60% of all changed pixels, with rice-to-aquaculture being the single largest at 18.4%. Mangrove forest lost over 40% of its extent, primarily through conversion to shrimp ponds in the coastal provinces of Ca Mau and Kien Giang during the 1990s. While government reforestation efforts slowed the rate of mangrove loss after 2000, they did not halt it, and the projected trajectory to 2040 under business-as-usual conditions points to further contraction. Spatial analysis at the provincial level revealed that change rates were far from uniform. Coastal provinces drove aquaculture expansion, upstream provinces led the shift to orchards, and the urban corridor around Can Tho and Long An absorbed the largest share of built-up growth. This geographic differentiation argues against one-size-fits-all policy responses and instead calls for regionally tailored land-use strategies that balance economic diversification against food-security and environmental objectives. From a methodological standpoint, the random-forest approach produced consistent, replicable classifications with accuracies above 86% for all four epochs, and the inclusion of water and vegetation indices as supplementary features improved class separability in the challenging aquaculturerice interface. Extending this framework with time-series classification and spatial modelling tools would sharpen both the historical record and the forward-looking scenarios, giving Mekong Delta planners the evidence they need to navigate the delta's ongoing transformation while safeguarding its agricultural productivity and ecological integrity.
Acknowledgement
Acknowledgements
Figures and tables from the paper
| LULC Class | 1990 (km²) | 2000 (km²) | 2010 (km²) | 2020 (km²) | Net Change (%) | Rate (%/yr) |
|---|---|---|---|---|---|---|
| Rice paddy | 22,840 | 20,310 | 17,680 | 15,020 | −34.2 | −1.38 |
| Aquaculture | 1,430 | 2,240 | 3,370 | 4,110 | + 187.4 | + 3.57 |
| Mangrove forest | 2,310 | 1,840 | 1,510 | 1,350 | −41.7 | −1.77 |
| Urban/built-up | 1,280 | 1,870 | 2,940 | 4,030 | + 214.8 | + 3.89 |
| Orchard/plantation | 4,870 | 6,310 | 7,940 | 9,540 | + 95.9 | + 2.27 |
| Water/wetland | 6,670 | 6,830 | 5,960 | 5,350 | −19.8 | −0.73 |
Table text extracted from the original PDF; superscript letters are shown inline. The original table image is below.
View original table image
| Transition | Area Changed (km²) | Share of All Change (%) | Main Period | Primary Location |
|---|---|---|---|---|
| Rice → Aquaculture | 2,940 | 18.4 | 1990-2010 | Ca Mau, Bac Lieu |
| Rice → Orchard | 2,630 | 16.5 | 2000-2020 | Dong Thap, An Giang |
| Rice → Urban | 2,180 | 13.6 | 2010-2020 | Can Tho, Long An |
| Mangrove → Aquaculture | 870 | 5.4 | 1990-2000 | Ca Mau, Kien Giang |
| Wetland → Urban | 740 | 4.6 | 2010-2020 | Can Tho, Vinh Long |
Table text extracted from the original PDF; superscript letters are shown inline. The original table image is below.