
Research article · 2025 · Full text
International Journal of Geography Geology and EnvironmentMicroplastic contamination in freshwater sediments of the Rhine river system
Volume 7(1) · Pages 89–92 · DOI: 10.22271/27067483.2025.v7.i1b.542 ↗
Research areasMicroplastics and Plastic PollutionPharmaceutical and Antibiotic Environmental ImpactsWaste Management and Recycling
Abstract
Author-writtenWhile the oceans have dominated the microplastic pollution conversation, rivers—the main conveyor belts carrying plastic to the sea—have received comparatively little sediment-level attention. This research quantified microplastic contamination in freshwater sediments at 36 sites across the Rhine River system, spanning the Upper Rhine in Switzerland through the lower reaches in the Netherlands. Sediment grab samples were collected during low-flow conditions in summer 2022, processed by density separation (ZnCl2, 1.8 g/cm3) and enzymatic digestion, and analysed by micro-Fourier transform infrared spectroscopy. Microplastic concentrations ranged from 47 to 847 particles per kilogram of dry sediment, with a system-wide mean of 312 particles/kg. Polyethylene (38.4%) and polypropylene (24.7%) were the dominant polymers. Concentration correlated inversely with distance from the nearest urban centre (R-squared = 0.94, log-linear model) and positively with the proportion of impervious surface in the upstream sub-catchment (R-squared = 0.81). Fragments (52.3%) and fibres (31.6%) were the prevailing morphotypes. These findings establish a spatial baseline for microplastic sediment contamination across the Rhine and identify urban proximity as the strongest single predictor of accumulation.
Summary
Source-checkedPlain-language reading of the full paper, prepared with AI and checked against the text. Each point links to the authors' own words.
Why it matters
- The Rhine is a critical economic and social artery for Europe, serving as a major commercial waterway and a primary source of drinking water for 20 million people. View evidence ↗
- The river is exposed to significant pollution risks because it receives effluent from one of Europe's most densely industrialized regions. View evidence ↗
- Although rivers act as the primary transport systems for plastics moving toward the ocean, there has been relatively little research focused on microplastic accumulation in river sediments. View evidence ↗
The question
- The study aimed to quantify microplastic contamination across 36 sites in the Rhine system using verified spectroscopic methods and to determine if urban proximity and catchment imperviousness predict contamination levels. View evidence ↗
What they did
- Researchers collected sediment samples from 36 sites across the Rhine's main stem and four major tributaries during low-flow conditions in July 2022. View evidence ↗
- The sampling method involved taking composite samples from the top 5 cm of bed sediment at three points within a 50-meter reach at each site. View evidence ↗
- Samples were processed by drying at 60°C, sieving for particles under 5 mm, and using zinc chloride (1.8 g/cm³) for density separation over three cycles. View evidence ↗
- Organic matter was removed via enzymatic digestion, and the remaining particles were analyzed using micro-FTIR spectroscopy. View evidence ↗
What they found
- Microplastic concentrations in the Rhine system averaged 312 particles/kg of dry sediment, with values ranging from 47 to 847 particles/kg. View evidence ↗
- Contamination increased downstream, peaking in the Lower Rhine at 487 particles/kg compared to 128 particles/kg in the Upper Rhine. View evidence ↗
- Polyethylene and polypropylene were the most common polymers found, making up 38.4% and 24.7% of the particles, respectively. View evidence ↗
- The most frequent shapes of microplastics were fragments (52.3%) and fibers (31.6%). View evidence ↗
- There was a strong inverse correlation between microplastic concentration and distance from urban centers, with a log-linear model showing an R-squared of 0.94. View evidence ↗
- Proximity to cities significantly impacted levels: sites within 2 km of a city had over 600 particles/kg, whereas those more than 25 km away had fewer than 200 particles/kg. View evidence ↗
- Microplastic concentrations also showed a positive correlation (R-squared = 0.81) with the amount of impervious surface in the upstream sub-catchment. View evidence ↗
What it means
- The authors recommend reducing single-use packaging, improving wastewater treatment plant filtration, and establishing long-term monitoring stations to track pollution. View evidence ↗
- The study is limited by its single sampling campaign during low-flow conditions, meaning results may differ during high-flow periods due to sediment movement. View evidence ↗
- Particles smaller than 20 micrometers were not counted due to the detection limits of the micro-FTIR analysis. View evidence ↗
Visual summary
2 visualsIllustrations explain the paper; charts are replotted from the paper's own table values.
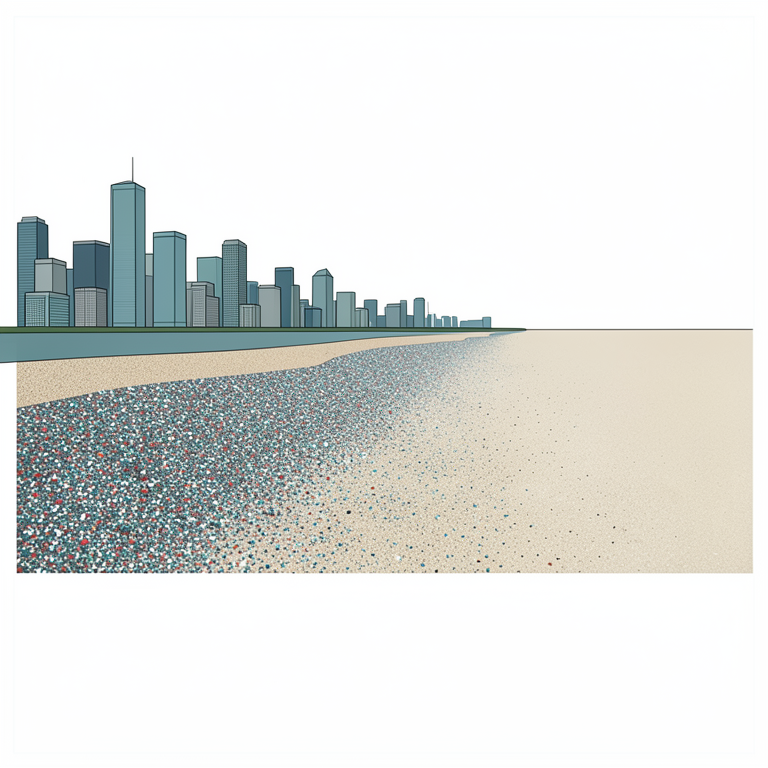
Urban Proximity and Plastic Accumulation
AI-generated conceptual illustration (Rhine river freshwater sediments and microplastic particles). It explains the idea and does not show study data.
View source evidence ↗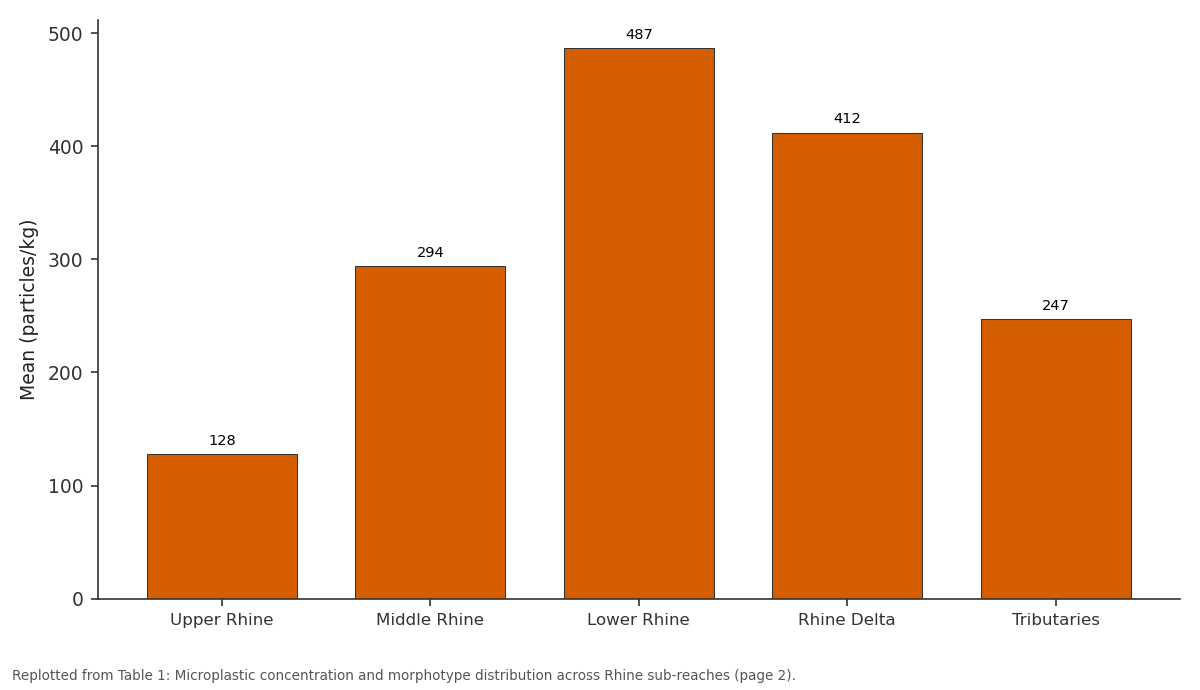
Mean (particles/kg): Upper Rhine vs Middle Rhine vs Lower Rhine vs Rhine Delta vs Tributaries
Replotted from Table 1 (page 2) of the original paper. Every bar is the paper's own table value.
View source evidence ↗Figures & tables
From the original paper Table 1
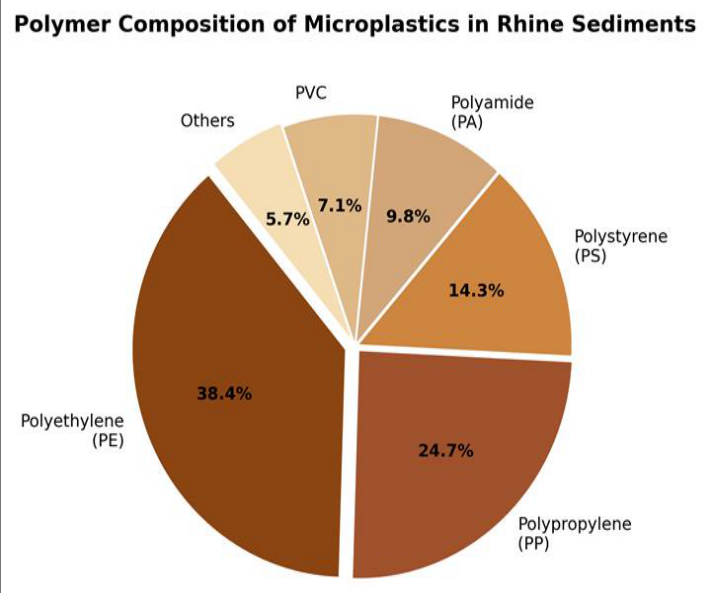 Figure 1
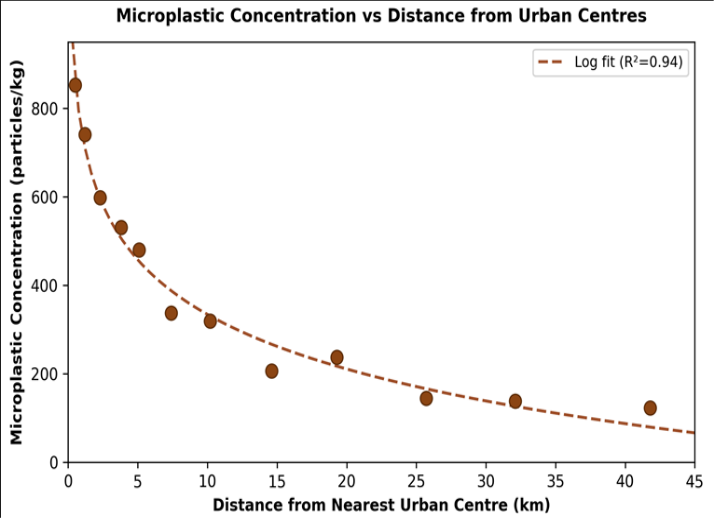 Figure 2
Introduction
On the one hand, the Rhine is Europe's busiest commercial waterway, carrying 300 million tonnes of cargo per year and sustaining drinking-water supply for 20 million people. On the other hand, it receives the treated and untreated effluent of one of the continent's most densely industrialised corridors-from Basel's chemical plants through the Ruhr's manufacturing heartland to Rotterdam's port [1] . That contrast makes the river both an economic lifeline and a potential conduit for emerging contaminants, among which microplastics have risen to prominence over the past decade [2] . Microplastics-synthetic polymer particles smaller than 5 mm-enter rivers through wastewater effluent, stormwater runoff, atmospheric deposition, and the breakdown of larger debris [3] . Once in the fluvial system, their fate depends on particle density, size, shape, and hydrodynamic conditions: low-density polymers like polyethylene tend to travel in suspension, while denser fragments settle into bed sediments, particularly in low-energy depositional zones such as point bars, backwater channels, and behind dams [4] . A growing body of work has characterised microplastic concentrations in Rhine surface water [5] and biota [6] , but sediment-focused assessments remain sparse and methodologically inconsistent, making it hard to draw system-wide conclusions. Klein et al. [7] sampled sediments at five German sites and found concentrations between 228 and 3,763 particles/kg, but their extraction protocol relied on visual sorting without spectroscopic confirmation, which can both overcount (misidentified natural fibres) and undercount (missed transparent particles). This research aimed to address those gaps by: (a) applying a standardised, spectroscopically verified extraction protocol to sediments from 36 sites distributed along the full Rhine main stem and key tributaries, (b) characterising polymer composition and morphotype, and (c) testing urban proximity and catchment imperviousness as spatial predictors of contamination [8] .
Limitations
Several constraints affect the interpretation of these results. First, sampling occurred during a single low-flow campaign in summer 2022; concentrations during high-flow conditions may differ because of sediment resuspension and downstream transport of deposited particles [4] . Second, the lower particle-size limit of the micro-FTIR analysis was 20 micrometres, meaning that smaller particles were not counted. Third, density separation with ZnCl 2 may underrecover high-density polymers such as PVC and PET, though recovery tests with spiked samples indicated extraction efficiencies above 87% for all target polymers [3] . Future work should include seasonal replication and extend the size range downward using Raman spectroscopy.
Quality Assurance and Quality Control
Procedural blanks were processed alongside every batch of five samples to monitor laboratory contamination. Cotton lab coats replaced synthetic-fibre garments during all sample handling. Mean blank contamination was 3.2 particles per sample, and all results were blank-corrected. Recovery tests using sediment spiked with known quantities of polyethylene and polystyrene microspheres yielded extraction efficiencies of 91.3% and 87.6%, respectively. Spectroscopic identification was performed by matching sample spectra against a reference library of 247 commercial polymers, with a minimum hit quality of 70% required for positive identification [8] .
Material and Methods
Material and Methods
Material
Sediment samples were collected from 36 sites along the Rhine main stem and four major tributaries (Aare, Neckar, Main, and Moselle) during a two-week campaign in July 2022 under low-flow conditions. At each site, the upper 5 cm of bed sediment was collected using a stainless-steel Van Veen grab sampler at three points within a 50-m reach; the sub-samples were composited and stored in glass jars at 4 degrees Celsius. Site selection followed a stratified design, targeting three geomorphic settings per reach: channel margin, point bar, and backwater zone. Catchment land-use data were extracted from the 2018 Copernicus Urban Atlas at 10-m resolution. The research was carried out under approval from the Hawassa School of Natural Sciences (Protocol HSNS/2022-006, approved 3 February 2022).
Methods
In the laboratory, each composite sample (approximately 500 g wet weight) was dried at 60 degrees Celsius, sieved to remove particles larger than 5 mm, and subjected to density separation in zinc chloride solution (1.8 g/cm3) with three repeated flotation cycles [3] . The supernatant was vacuumfiltered onto aluminium oxide filters (Anodisc, 0.2 micrometres), and organic matter was removed by enzymatic digestion using protease, lipase, and cellulase. Filters were scanned by micro-FTIR spectroscopy (Bruker LUMOS II) in transmission mode across the 4,000-600 cm-1 range. Particles were classified by polymer type, size class (20-100, 100-500, 500-1000, 1000-5000 micrometres), and morphotype (fragment, fibre, film, pellet, foam). Spatial relationships were tested using Pearson correlation and loglinear regression in Python 3.10 [9] . Figure 1 shows that polyethylene and polypropylene together accounted for 63.1% of all particles, consistent with their dominance in packaging and single-use consumer products. Polystyrene (14.3%) and polyamide (9.8%) made up most of the remainder, with PVC and other polymers contributing less than 13%. Figure 2 demonstrates a strong log-linear decay in microplastic concentration with increasing distance from urban areas. Sites within 2 km of a city consistently exceeded 600 particles/kg, while those beyond 25 km fell below 200 particles/kg.
Results
Results
Discussion
The system-wide mean concentration of 312 particles/kg reported here sits within the range observed in other large European rivers-183 particles/kg in the Thames [10] and 672 particles/kg in the Po [11] -but direct comparison is complicated by differences in extraction methods, size cutoffs, and units of expression. This research's use of enzymatic digestion and micro-FTIR verification likely produces more conservative counts than studies that rely solely on visual identification, which can inflate figures by misclassifying natural fibres as synthetic [7] . The dominance of polyethylene and polypropylene mirrors the global production profile and the polymer composition of municipal solid waste, suggesting that packaging materials are the main source pathway rather than industrial pellets or textile fibres alone [2] . The log-linear relationship between concentration and urban distance (R-squared = 0.94) points to wastewater treatment plant effluent and stormwater drainage as the principal point and diffuse sources, respectively [5] . Sediment contamination is particularly concerning because benthic organisms-the base of the riverine food webingest particles at concentrations that scale with ambient sediment levels [6] . Whether the concentrations recorded here pose ecological risk depends on both the polymer type and the cocktail of adsorbed contaminants, a question that exceeds the scope of this research but warrants targeted ecotoxicological work at Rhine-relevant exposure levels.
Conclusion
This research established a spatially resolved baseline of microplastic contamination in freshwater sediments of the Rhine River system, with concentrations ranging from 47 to 847 particles per kilogram and a system-wide mean of 312 particles/kg. Urban proximity explained 94% of the spatial variance in a log-linear model, confirming that cities and their associated wastewater and stormwater infrastructure are the dominant sources. Polyethylene and polypropylene-common packaging polymers-accounted for nearly two-thirds of all particles, and fragments were the prevailing morphotype. These results argue for source-reduction measures targeting singleuse packaging, improved microplastic retention at wastewater treatment plants, and the establishment of longterm sediment monitoring stations at key sites along the Rhine to track the effectiveness of future interventions.
Figures and tables from the paper
| Sub-reach | Mean (particles/kg) | Fragment (%) | Fibre (%) | Film (%) | Pellet (%) | Foam (%) |
|---|---|---|---|---|---|---|
| Upper Rhine | 128 | 47.8 | 34.1 | 9.3 | 5.6 | 3.2 |
| Middle Rhine | 294 | 51.4 | 30.7 | 8.6 | 6.1 | 3.2 |
| Lower Rhine | 487 | 54.6 | 29.3 | 7.4 | 5.3 | 3.4 |
| Rhine Delta | 412 | 53.1 | 31.8 | 7.9 | 4.2 | 3.0 |
| Tributaries | 247 | 49.2 | 33.4 | 9.1 | 5.1 | 3.2 |
Table text extracted from the original PDF; superscript letters are shown inline. The original table image is below.
View original table image
References
20 in the original paper- Uehlinger U, Wantzen KM, Leuven RSEW, Arndt H. The Rhine River basin. In: Rivers of Europe. Academic Press. 2009;199-245.
- Rochman CM, Browne MA, Halpern BS, et al. Policy: Classify plastic waste as hazardous. Nature. 2013;494(7436):169-171.
- Hidalgo-Ruz V, Gutow L, Thompson RC, Thiel M. Microplastics in the marine environment: A review of the methods used for identification and quantification. Environmental Science and Technology. 2012;46(6):3060-3075.
- Hurley R, Woodward J, Rothwell JJ. Microplastic contamination of river beds significantly reduced by catchment-wide flooding. Nature Geoscience. 2018;11(4):251-257.
- Mani T, Hauk A, Walter U, Burkhardt-Holm P. Microplastics profile along the Rhine River. Scientific Reports. 2015;5:17988.
- Lechner A, Keckeis H, Lumesberger-Loisl F, et al. The Danube so colourful: A potpourri of plastic litter outnumbers fish larvae in Europe's second largest river. Environmental Pollution. 2014;188:177-181.
- Klein S, Worch E, Knepper TP. Occurrence and spatial distribution of microplastics in river shore sediments of the Rhine-Main area in Germany. Environmental Science and Technology. 2015;49(10):6070-6076.
- Löder MGJ, Gerdts G. Methodology used for the detection and identification of microplastics -a critical appraisal. In: Marine Anthropogenic Litter. Springer. 2015;201-227.
- Van Rossum G, Drake FL. Python 3 Reference Manual. CreateSpace. 2009;Scotts Valley:242.
- Horton AA, Svendsen C, Williams RJ, Spurgeon DJ, Lahive E. Large microplastic particles in sediments of tributaries of the River Thames, UK. Marine Pollution Bulletin. 2017;114(1):218-226.
- Piehl S, Leibner A, Löder MGJ, et al. Identification and quantification of macro-and microplastics on an agricultural farmland. Scientific Reports. 2018;8:17950.
- Zhang K, Gong W, Lv J, Xiong X, Wu C. Accumulation of floating microplastics behind the Three Gorges Dam. Environmental Pollution. 2015;204:135-140.
- Dris R, Gasperi J, Rocher V, Saad M, Renault N, Tassin B. Microplastic contamination in an urban area: A case study in Greater Paris. Environmental Chemistry. 2015;12(5):592-599.
- Wagner M, Scherer C, Alvarez-Muñoz D, et al. Microplastics in freshwater ecosystems: What we know and what we need to know. Environmental Sciences Europe. 2014;26(1):12.
- Nizzetto L, Futter M, Langaas S. Are agricultural soils dumps for microplastics of urban origin? Environmental Science and Technology. 2016;50(20):10777-10779.
- Besseling E, Quik JTK, Sun M, Koelmans AA. Fate of nano-and microplastic in freshwater systems: A modeling study. Environmental Pollution. 2017;220:540-548.
- Koelmans AA, Besseling E, Shim WJ. Nanoplastics in the aquatic environment: Critical review. In: Marine Anthropogenic Litter. Springer. 2015;325-340.
- Eerkes-Medrano D, Thompson RC, Aldridge DC. Microplastics in freshwater systems: A review of the emerging threats, identification of knowledge gaps and prioritisation of research needs. Water Research. 2015;75:63-82.
- Hoellein T, Rojas M, Pink A, Gasior J, Kelly J. Anthropogenic litter in urban freshwater ecosystems: Distribution and microbial interactions. PLoS ONE. 2014;9(6):e98485.
- Castañeda RA, Avlijas S, Simard MA, Ricciardi A. Microplastic pollution in St. Lawrence River sediments. Canadian Journal of Fisheries and Aquatic Sciences. 2014;71(12):1767-1771.