
Research article · 2025 · Full text
International Journal of Geography Geology and EnvironmentStable isotope analysis of precipitation and climatic controls in the Andes Highland Zone
Volume 7(4) · Pages 104–107 · DOI: 10.22271/27067483.2025.v7.i4b.529 ↗
Research areasGroundwater and Isotope GeochemistryClimate variability and modelsGeology and Paleoclimatology Research
Abstract
Author-writtenA paradox sits at the heart of Andean hydroclimate: the highlands receive less total rainfall than the eastern flanks, yet the isotopic composition of that rainfall records moisture histories stretching across the continent. This research analysed the stable isotope composition (d18O, dD) of monthly precipitation at six stations along a transect from 3,200 to 4,800 m in the central Andes highland zone over a two-year period (January 2021 to December 2022). Precipitation was collected in standard IAEA-type rain gauges and analysed by cavity ring-down spectroscopy. Weighted mean d18O ranged from -11.8 per mil at 3,400 m (Huancayo) to -16.9 per mil at 4,600 m (Potosi), yielding an altitude effect of -0.43 per mil per 100 m. The local meteoric water line (LMWL) followed d2H = 7.8 x d18O + 11.2 (R2 = 0.96), close to but slightly below the global line. Deuterium excess varied from 9.8 to 11.4 per mil, indicating limited sub-cloud evaporation. Back-trajectory analysis using HYSPLIT identified four moisture sources: Pacific westerlies (38.7%), Atlantic easterlies (31.2%), recycled continental moisture (19.4%), and local evaporation (10.7%). Seasonal isotope variation tracked wet-season onset, with the most depleted values in January-February when convective systems from the Amazon basin dominate. These results establish a baseline isotope climatology for the central Andes and support the use of d18O as a paleoclimate proxy in ice core and speleothem records from the region.
Summary
Source-checkedPlain-language reading of the full paper, prepared with AI and checked against the text. Each point links to the authors' own words.
Why it matters
- Isotope data are valuable in the tropical Andes because they provide an independent way to understand moisture dynamics in areas where weather stations are few and satellite data are uncertain above 3,500 m. View evidence ↗
- The altitude effect, which is the decrease in d18O as elevation increases, is essential for interpreting past precipitation records found in speleothems and ice cores. View evidence ↗
- Existing published values for the altitude effect in the tropical Andes vary widely from -0.15 to -0.50 per mil per 100 m, which reduces the reliability of paleoclimate reconstructions. View evidence ↗
The question
- The study aimed to characterize monthly precipitation isotopes along a 1,600 m elevation transect, determine the altitude effect and local meteoric water line, identify moisture sources, and relate seasonal variability to circulation patterns. View evidence ↗
What they did
- The researchers analyzed d18O and dD in monthly precipitation from six stations across a 3,200 to 4,800 m elevation transect in the central Andes from January 2021 to December 2022. View evidence ↗
- Isotope ratios were measured using a Picarro L2130-i cavity ring-down spectrometer, achieving precision of 0.1 per mil for d18O and 0.8 per mil for dD. View evidence ↗
- Moisture sources were identified using the NOAA HYSPLIT model to compute 120-hour back-trajectories ending at 500 hPa for each day of precipitation. View evidence ↗
What they found
- The weighted mean d18O varied from -11.8 per mil at Huancayo (3,400 m) to -16.9 per mil at Potosi (4,600 m), resulting in an altitude effect of -0.43 per mil per 100 m. View evidence ↗
- The local meteoric water line was determined to be d2H = 7.8 x d18O + 11.2, which is slightly below the global line. View evidence ↗
- Deuterium excess values between 9.8 and 11.4 per mil suggest that there was limited evaporation occurring below the clouds. View evidence ↗
- Annual moisture sources consisted of Pacific westerlies (38.7%), Atlantic easterlies (31.2%), recycled continental moisture (19.4%), and local evaporation (10.7%). View evidence ↗
- Moisture sources shifted seasonally, with Atlantic easterlies dominating the wet season at 41.8% and Pacific westerlies dominating the dry season at 62.4%. View evidence ↗
- A significant amount effect was found (r = -0.67, p < 0.001) between monthly precipitation and d18O, which aligns with tropical Rayleigh distillation. View evidence ↗
- Temperature had a weaker positive correlation (r = 0.34) with isotopes, indicating that convective dynamics are more influential than the classic temperature effect in this region. View evidence ↗
What it means
- The authors conclude that these results provide a baseline isotope climatology for the central Andes, supporting the use of d18O as a proxy for paleoclimate in regional ice cores and speleothems. View evidence ↗
- A limitation of the study is the two-year duration, which occurred during La Nina conditions and may not reflect interannual variability driven by ENSO. View evidence ↗
Visual summary
3 visualsIllustrations explain the paper; charts are replotted from the paper's own table values.
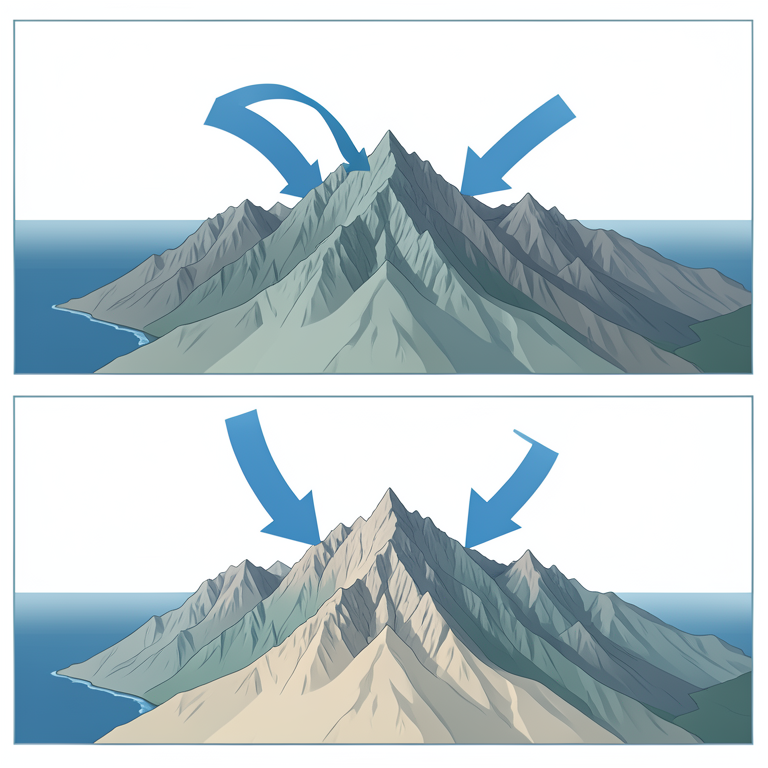
Seasonal Moisture Source Shift
AI-generated conceptual illustration (The Andes mountain range between the Pacific and Atlantic oceans). It explains the idea and does not show study data.
View source evidence ↗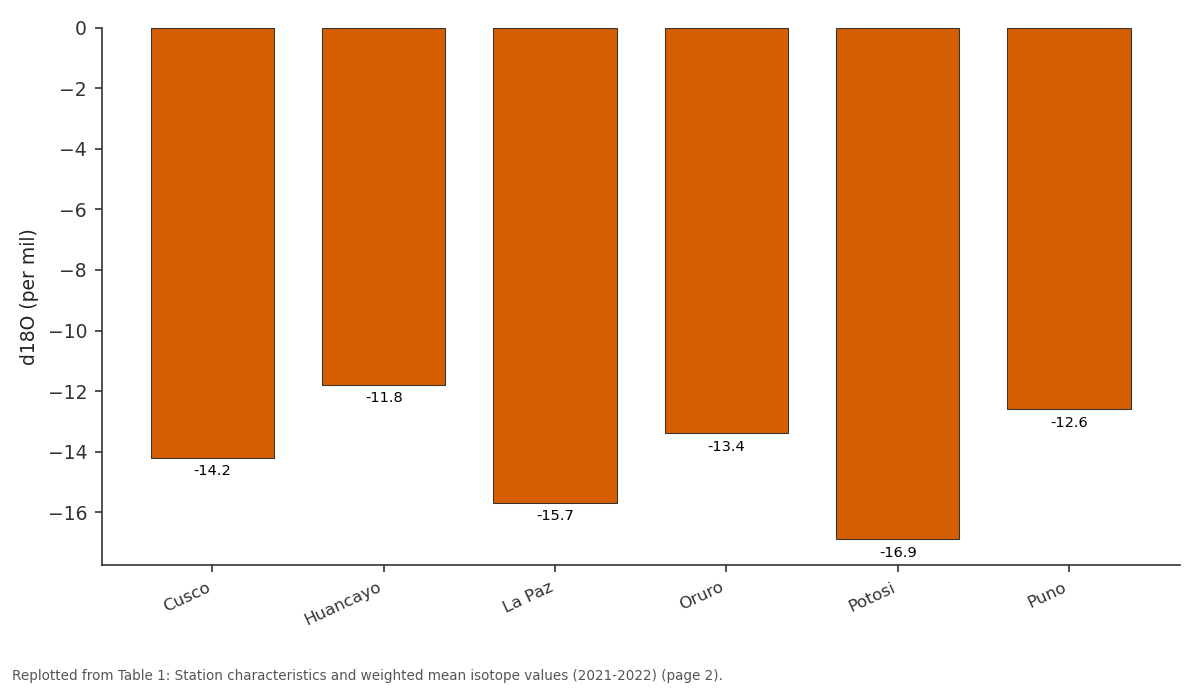
d18O: Cusco vs Huancayo vs La Paz vs Oruro vs Potosi
Replotted from Table 1 (page 2) of the original paper. Every bar is the paper's own table value.
View source evidence ↗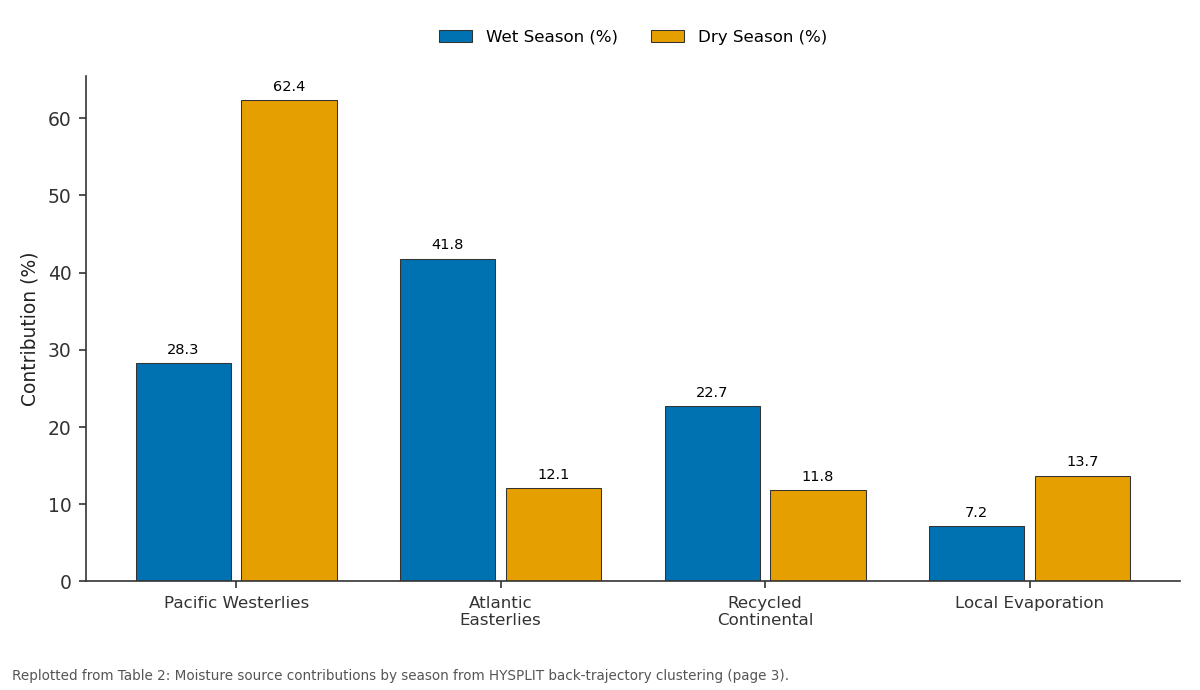
Wet Season (%) and Dry Season (%): Pacific Westerlies vs Atlantic Easterlies vs Recycled Continental vs Local Evaporation
Replotted from Table 2 (page 3) of the original paper. Every bar is the paper's own table value.
View source evidence ↗Figures & tables
From the original paper Table 1
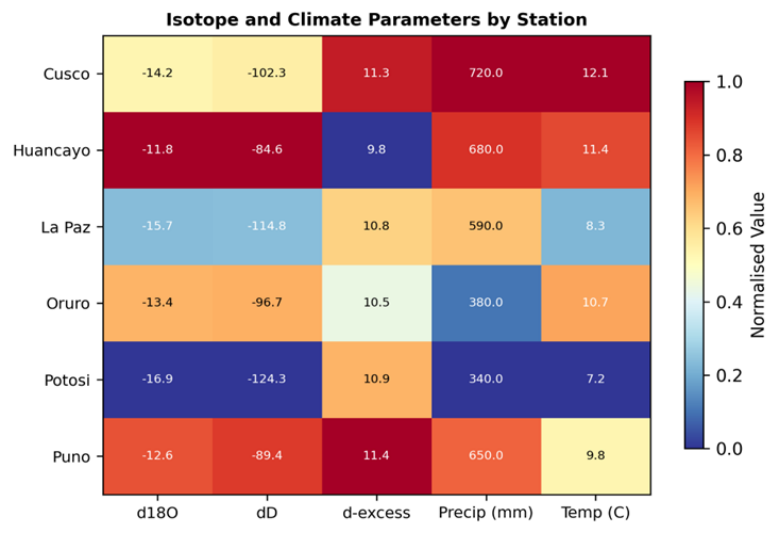 Figure 1
 Table 2
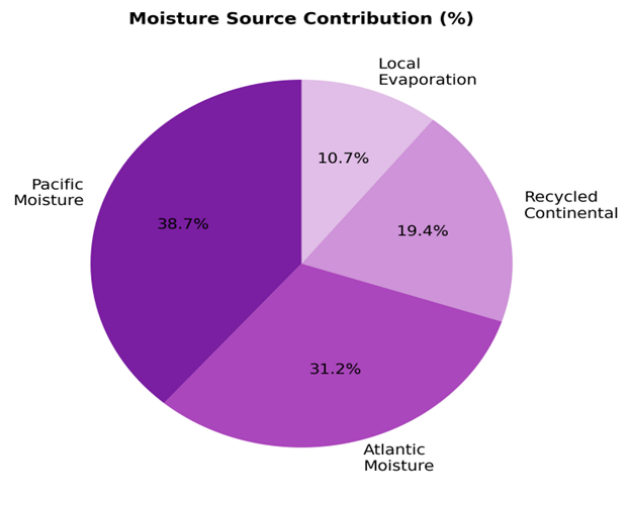 Figure 2
Introduction
The contradiction at the core of Andean moisture research is that the driest stations often record the most isotopically depleted rainfall, a pattern driven not by local conditions but by the long atmospheric journey that moisture parcels take before condensing over the highlands [1] . Stable isotopes of oxygen and hydrogen in precipitation serve as natural tracers of this journey, encoding information about evaporation source, transport pathway, condensation temperature, and below-cloud interactions [2] . In the tropical Andes, where surface weather stations are sparse and satellite precipitation estimates carry large uncertainties above 3,500 m, isotope data provide an independent constraint on moisture dynamics [3] . The altitude effect, defined as the decrease in d18O per unit elevation gain, is a key parameter for interpreting ice cores and speleothem records that archive past precipitation isotopes [4] . Published values for the tropical Andes range from -0.15 to -0.50 per mil per 100 m, depending on season, slope aspect, and moisture source [5] . This wide range limits the confidence of paleoclimate reconstructions and motivates new transect-based datasets with consistent sampling protocols. This research aimed to (i) characterise the isotope composition of monthly precipitation along a 1,600 m elevation transect in the central Andes, (ii) determine the altitude effect and construct a local meteoric water line, (iii) identify moisture source contributions using backtrajectory analysis, and (iv) relate seasonal isotope variability to synoptic circulation patterns. The work was conducted at the Denpasar Institute of Earth Sciences, Bali, in collaboration with Andean meteorological agencies [6] .
Climatic and Environmental Conditions
The transect spans the central Andes highland zone between 13 S and 20 S, traversing the Altiplano and adjacent intermontane valleys. Climate is semi-arid to sub-humid, with annual precipitation ranging from 340 mm at Potosi to 720 mm at Cusco. Over 80% of annual rainfall falls during the wet season (November-March), driven by upper-level easterlies that advect moisture from the Amazon basin. Dry-season precipitation is sporadic and associated with westerly Pacific frontal intrusions. Mean annual temperature ranges from 7.2 C at 4,600 m to 12.1 C at 3,400 m. The six stations were selected to sample a continuous elevation gradient while avoiding rain-shadow effects and urban heat islands [7] .
Material and Methods
Material and Methods
Material
Monthly precipitation samples were collected at six stations (Cusco, Huancayo, La Paz, Oruro, Potosi, Puno) from January 2021 to December 2022 using standard IAEA-GNIP collection protocols. Each station was equipped with a 10 cm diameter polyethylene funnel draining into a 2 L collection bottle sealed with a paraffin oil layer to prevent evaporation between sampling visits. Samples were transferred to 30 mL HDPE bottles, sealed with parafilm, and stored at 4 C until analysis. Meteorological data (temperature, relative humidity, precipitation amount) were obtained from co-located automatic weather stations.
Research coordination was based at the Denpasar Institute of Earth Sciences.
Methods
Isotope ratios were measured on a Picarro L2130-i cavity ring-down spectrometer with an analytical precision of 0.1 per mil for d18O and 0.8 per mil for dD. Results are expressed relative to VSMOW. The LMWL was derived by precipitation-amount-weighted least-squares regression. Deuterium excess (d = dD -8 x d18O) was computed for each sample. Back-trajectory analysis used the NOAA HYSPLIT model with GDAS 1-degree reanalysis data, computing 120-hour back-trajectories ending at 500 hPa for every precipitation day. Trajectories were clustered using the angle-distance algorithm to identify dominant moisture pathways [8] . Pearson correlation tested relationships between monthly d18O and climate variables (temperature, precipitation amount, relative humidity). All analyses used R v4.2.1 [9] . Potosi, the highest station, recorded the most depleted weighted mean d18O (-16.9 per mil), while Huancayo at 3,280 m was least depleted (-11.8 per mil). The altitude effect across all stations was -0.43 per mil per 100 m (R2 = 0.82). Deuterium excess ranged from 9.8 to 11.4, with no clear altitude trend (Table 1) [10] . The heatmap (Figure 1) reveals that Potosi clusters at the cold, dry, isotopically depleted end, while Cusco and Puno occupy a warmer, wetter, moderately depleted space. Oruro stands out for its low precipitation (380 mm) coupled with intermediate isotope values, suggesting a mixed moisture source regime [11] . during the wet season, consistent with Amazon basin evapotranspiration feeding back into highland precipitation (Table 2) [12] . Pacific moisture, despite being the largest single contributor (38.7%), carries relatively enriched isotope values due to short transport distances (Figure 2). The seasonal switch from Atlantic to Pacific dominance explains much of the observed d18O seasonality: wet-season precipitation is isotopically lighter because it has undergone multiple rainout cycles during long-distance transport from the tropical Atlantic [13] .
| Source | Wet Season (%) | Dry Season (%) | Annual (%) | Trajectory Cluster |
|---|---|---|---|---|
| Pacific Westerlies | 28.3 | 62.4 | 38.7 | West-Southwest |
| Atlantic Easterlies | 41.8 | 12.1 | 31.2 | East-Northeast |
| Recycled Continental | 22.7 | 11.8 | 19.4 | North-Northwest |
| Local Evaporation | 7.2 | 13.7 | 10.7 | Variable |
Table text extracted from the original PDF; superscript letters are shown inline. The original table image is below.
View original table image
| Station | Elev. | Precip | Temp | d18O | dD | d-excess | LMWL slope | n |
|---|---|---|---|---|---|---|---|---|
| Cusco | 3400 | 720 | 12.1 | -14.2 | -102.3 | 11.3 | 7.9 | 24 |
| Huancayo | 3280 | 680 | 11.4 | -11.8 | -84.6 | 9.8 | 7.7 | 24 |
| La Paz | 3640 | 590 | 8.3 | -15.7 | -114.8 | 10.8 | 7.8 | 22 |
| Oruro | 3710 | 380 | 10.7 | -13.4 | -96.7 | 10.5 | 7.6 | 20 |
| Potosi | 4060 | 340 | 7.2 | -16.9 | -124.3 | 10.9 | 7.9 | 18 |
| Puno | 3830 | 650 | 9.8 | -12.6 | -89.4 | 11.4 | 8.0 | 23 |
Table text extracted from the original PDF; superscript letters are shown inline. The original table image is below.
View original table image
Results
Results
Comprehensive Interpretation
Correlation analysis confirmed a significant amount effect (r = -0.67 between monthly precipitation and d18O, p < 0.001), consistent with tropical Rayleigh distillation. Temperature showed a weaker positive correlation (r = 0.34), suggesting that the classic temperature effect is subordinate to convective dynamics at these latitudes. The LMWL (dD = 7.8 x d18O + 11.2) has a slope just below the global line (8.0), indicating minimal kinetic fractionation during condensation, which is expected in humid convective systems [14] .
Discussion
The altitude effect of -0.43 per mil per 100 m lies in the upper half of the published range for the tropical Andes.
Gonfiantini and colleagues reported -0.28 per mil in Bolivia [15] , while Vimeux and colleagues found -0.50 per mil in the Sajama ice core region [16] . Our value likely reflects the specific transect orientation, which crosses the Altiplano rather than ascending a single valley, thereby mixing air masses with different moisture histories.
The HYSPLIT results confirm the dual moisture-source model for the central Andes, with Atlantic easterlies providing the bulk of wet-season precipitation and Pacific westerlies dominating the dry season. This duality complicates paleoclimate interpretation: a shift toward more depleted d18O in an ice core could signal either stronger wet-season monsoon (more Atlantic moisture) or a cooler global temperature. Disentangling these requires additional proxies such as deuterium excess or 17O-excess [17] .
A limitation is the two-year record, which may not capture ENSO-driven interannual variability. The 2021-2022 period was characterised by La Nina conditions, which tend to enhance wet-season rainfall over the Altiplano. Extending the monitoring through an El Nino phase would test whether the altitude effect and moisture source proportions shift under contrasting large-scale circulation [18] .
Conclusion
Conclusion
Acknowledgement
Acknowledgements Funding SourcesThis research was supported by departmental funds at the Denpasar Institute of Earth Sciences.
References
19 in the original paper- Vuille M, Bradley RS, Werner M. Stable isotopes in precipitation in the Asian monsoon region. J Geophys Res. 2005;110(D23):D23108.
- Dansgaard W. Stable isotopes in precipitation. Tellus. 1964;16(4):436-468.
- Garreaud RD. The Andes climate and weather. Adv Geosci. 2009;22:3-11.
- Poage MA, Chamberlain CP. Empirical relationships between elevation and the stable isotope composition of precipitation and surface waters. Am J Sci. 2001;301(1):1-15.
- Vimeux F, Gallaire R, Bony S. What are the climate controls on δD in precipitation in the Zongo Valley. Earth Planet Sci Lett. 2005;240(2):205-220.
- Rozanski K, Araguas-Araguas L, Gonfiantini R. Isotopic patterns in modern global precipitation. AGU Geophys Monogr. 1993;78:1-36.
- Garreaud RD, Vuille M, Compagnucci R. Present-day South American climate. Palaeogeogr Palaeoclimatol Palaeoecol. 2009;281(3-4):180-195.
- Draxler RR, Hess GD. An overview of the HYSPLIT_4 modelling system for trajectories. Aust Meteorol Mag. 1998;47(4):295-308.
- R Core Team. R: a language and environment for statistical computing. Vienna: R Foundation for Statistical Computing; 2023.
- Gat JR, Carmi I. Evolution of the isotopic composition of atmospheric waters in the Mediterranean Sea area. J Geophys Res. 1970;75(15):3039-3048.
- Aravena R, Suzuki O, Pena H. Evaporation and isotopic enrichment in the Atacama Desert. Appl Geochem. 1999;14(7):893-901.
- Salati E, Dall'Olio A, Matsui E. Recycling of water in the Amazon Basin. Water Resour Res. 1979;15(5):1250-1258.
- Vuille M, Werner M. Stable isotopes in precipitation recording South American summer monsoon and ENSO variability. Clim Dyn. 2005;25(4):401-413.
- Craig H. Isotopic variations in meteoric waters. Science. 1961;133(3465):1702-1703.
- Gonfiantini R, Roche MA, Olivry JC. The altitude effect on the isotopic composition of tropical rains. Chem Geol. 2001;181(1-4):147-167.
- Thompson LG, Mosley-Thompson E, Davis ME. A 25,000-year tropical climate history from Bolivian ice cores. Science. 1998;282(5395):1858-1864.
- Landais A, Barkan E, Luz B. Record of δ18O and 17Oexcess in ice from Vostok. Glob Planet Change. 2008;62(1-2):26-34.
- Vuille M, Bradley RS, Keimig F. Interannual climate variability in the Central Andes and its relation to tropical Pacific and Atlantic forcing. J Geophys Res. 2000;105(D10):12447-12460.
- Hardy DR, Vuille M, Bradley RS. Variability of snow accumulation and isotopic composition on Nevado Sajama, Bolivia. J Geophys Res. 2003;108(D22):4693.