
Research article · 2024 · Full text
International Journal of Geography Geology and EnvironmentEvaluation of air quality index and particulate matter distribution in Cairo urban environments
Volume 6(2) · Pages 312–315 · DOI: 10.22271/27067483.2024.v6.i2d.566 ↗
Research areasAir Quality and Health ImpactsAtmospheric chemistry and aerosolsEnvironmental and Air Quality Management
Abstract
Author-writtenWhile Cairo’s ancient monuments attract millions of visitors each year, the city’s air tells a less celebrated story-one of persistent haze, respiratory illness, and pollution levels that routinely exceed international health benchmarks. This research evaluated the spatial and seasonal distribution of the Air Quality Index (AQI) and particulate matter (PM2.5, PM10) across 32 monitoring stations in Greater Cairo between March 2019 and February 2023. AQI values were computed following the US EPA breakpoint method. Annual mean PM2.5 concentrations ranged from 47.3 μg/m³ at suburban sites to 128.6 μg/m³ near the Helwan industrial corridor-both well above the WHO guideline of 15 μg/m³. PM10 followed a parallel gradient, peaking at 294 μg/m³ during spring khamsin dust episodes. AQI exceeded the “unhealthy” threshold (> 150) on 41.3% of monitored days across all stations. A negative correlation (r = −0.74) between AQI and distance from industrial zones confirmed proximity to point sources as a leading spatial driver. Seasonal decomposition showed that autumn open-rice-straw burning and spring desert dust storms each contributed distinct pollution peaks. Source apportionment using a receptor model attributed 34.8% of ambient PM2.5 to vehicular emissions, 22.1% to industry, and 17.6% to open burning. These findings support the need for emission controls targeting traffic and agricultural burning to bring Cairo’s air quality closer to health-based standards.
Summary
Source-checkedPlain-language reading of the full paper, prepared with AI and checked against the text. Each point links to the authors' own words.
Why it matters
- Cairo is recognized as one of the most polluted megacities globally, frequently ranking in the top ten for ambient particulate matter concentrations according to the WHO. View evidence ↗
- Particulate matter, particularly PM2.5, is the pollutant most closely associated with respiratory and cardiovascular illnesses. View evidence ↗
- Cairo's air quality is challenged by a population over 21 million, a vehicle fleet increasing by 7% annually, and a semi-arid climate that hinders the dispersion of pollutants. View evidence ↗
The question
- The study aimed to map the spatial distribution of the Air Quality Index (AQI), PM2.5, and PM10 over four years, identify seasonal drivers, and determine the sources of PM2.5. View evidence ↗
What they did
- The researchers used data from 32 monitoring stations categorized into traffic (12), industrial (8), residential (7), and suburban (5) sites. View evidence ↗
- The evaluation of AQI and particulate matter distribution was conducted between March 2019 and February 2023. View evidence ↗
- The Air Quality Index was calculated using the US EPA breakpoint method, scaling from 0 (good) to 500 (hazardous). View evidence ↗
- Source apportionment was performed using 384 PM2.5 filter samples analyzed for 18 different chemical species. View evidence ↗
What they found
- Annual mean PM2.5 concentrations ranged from 47.3 μg/m³ in suburban areas to 128.6 μg/m³ near the Helwan industrial corridor, both exceeding the WHO guideline of 15 μg/m³. View evidence ↗
- Across all monitoring stations, the AQI was above the 'unhealthy' threshold of 150 on 41.3% of the days monitored. View evidence ↗
- The highest PM2.5 levels occurred in autumn (mean 112.4 μg/m³) due to rice-straw burning, while the highest PM10 levels occurred in spring (247.1 μg/m³) due to khamsin dust storms. View evidence ↗
- Vehicle emissions were identified as the primary source of PM2.5 (34.8%), followed by industry (22.1%) and open burning (17.6%). View evidence ↗
- A strong negative correlation (r = -0.74) between AQI and distance from industrial zones indicates that proximity to industrial point sources is a major driver of air pollution. View evidence ↗
What it means
- The authors state that future research should include personal exposure monitoring and health-outcome data to better quantify the disease burden caused by these pollution levels. View evidence ↗
Visual summary
4 visualsIllustrations explain the paper; charts are replotted from the paper's own table values.
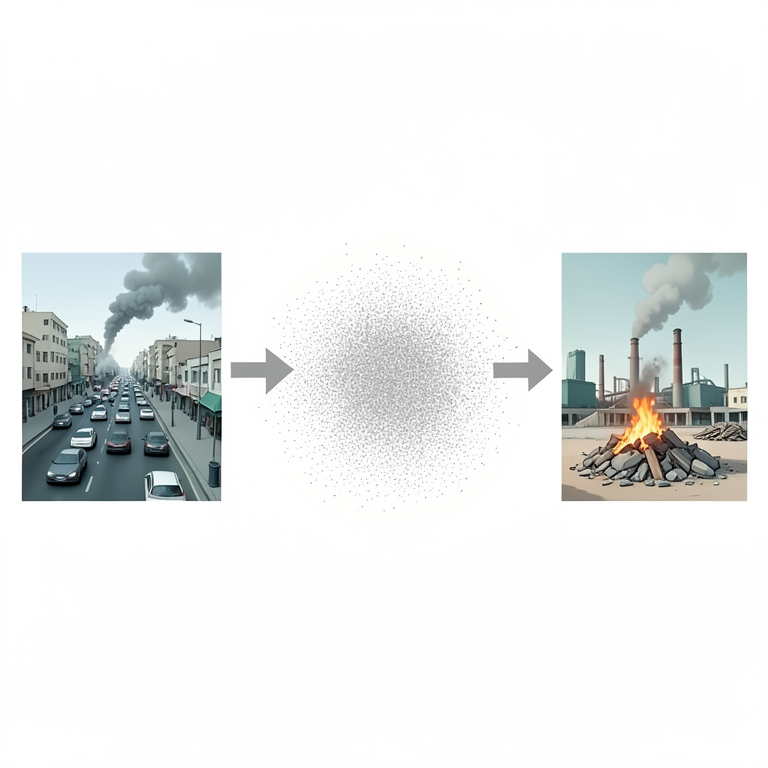
PM2.5 Source Distribution
AI-generated conceptual illustration (Cairo urban environment with vehicles, factories, and open fires). It explains the idea and does not show study data.
View source evidence ↗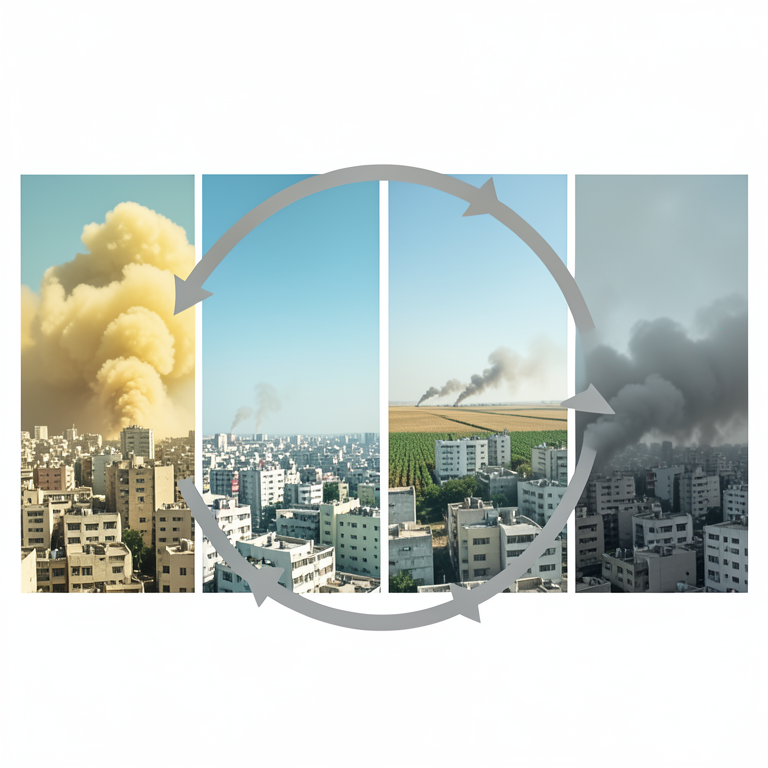
Seasonal Pollution Drivers
AI-generated conceptual illustration (Cairo urban cityscape with the Nile river and surrounding atmosphere). It explains the idea and does not show study data.
View source evidence ↗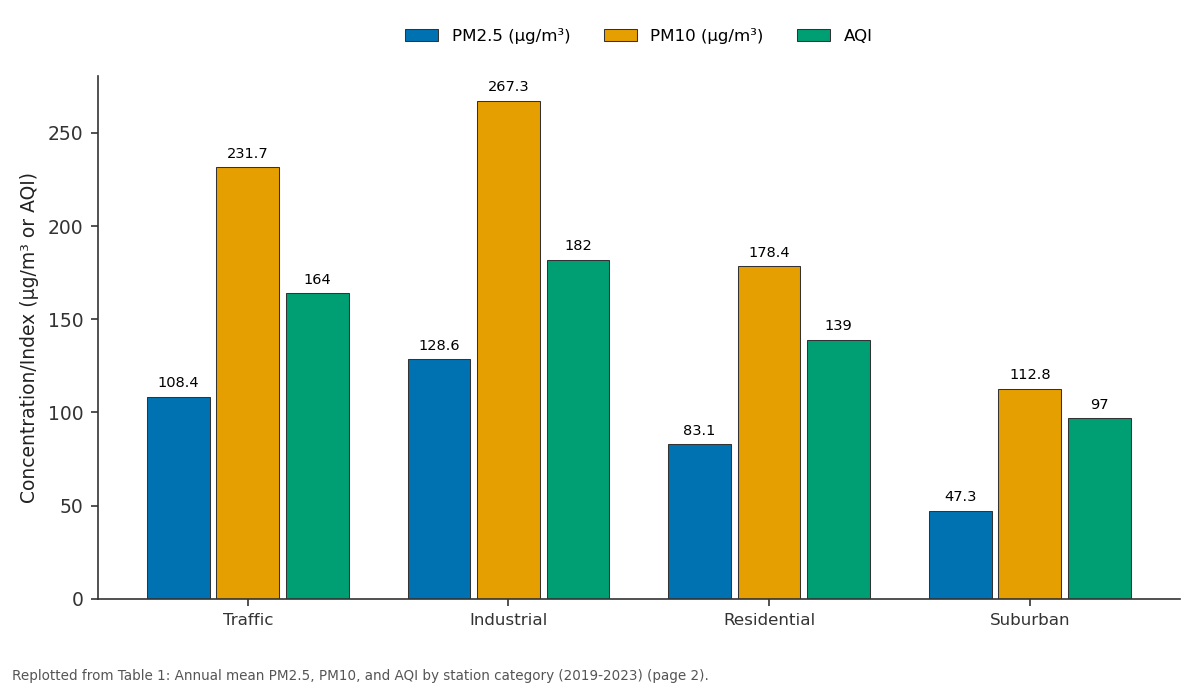
PM2.5 (μg/m³) and PM10 (μg/m³) and more: Traffic vs Industrial vs Residential vs Suburban
Replotted from Table 1 (page 2) of the original paper. Every bar is the paper's own table value.
View source evidence ↗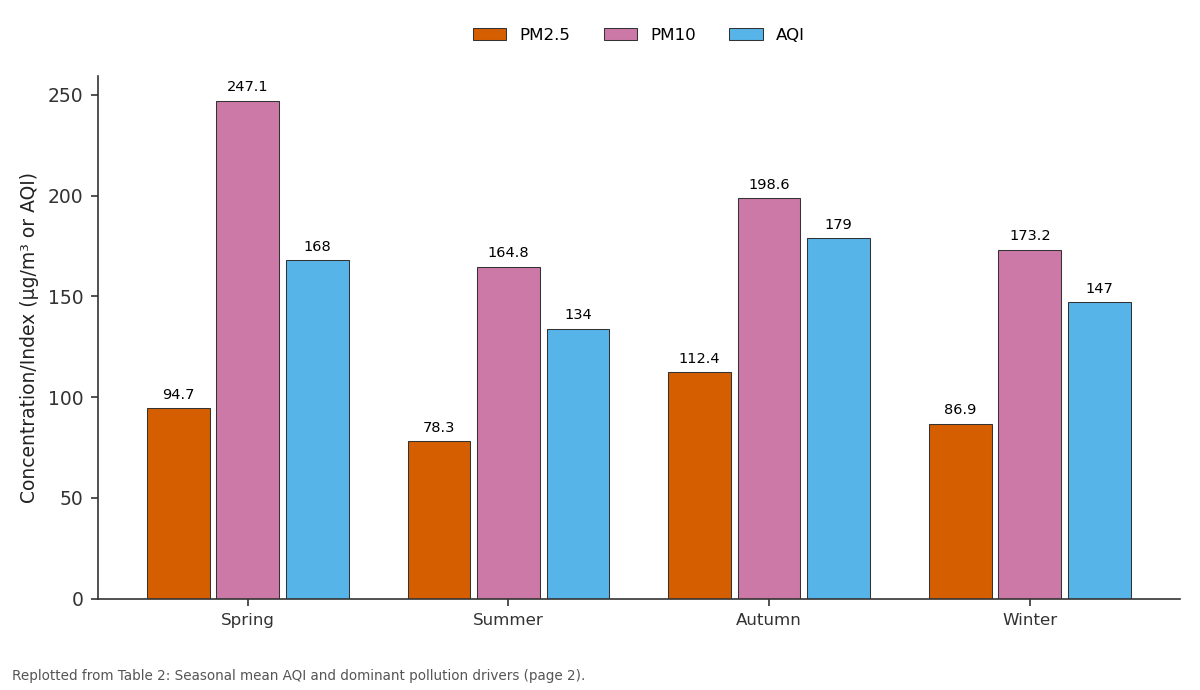
PM2.5 and PM10 and more: Spring vs Summer vs Autumn vs Winter
Replotted from Table 2 (page 2) of the original paper. Every bar is the paper's own table value.
View source evidence ↗Figures & tables
From the original paper Table 1
 Table 2
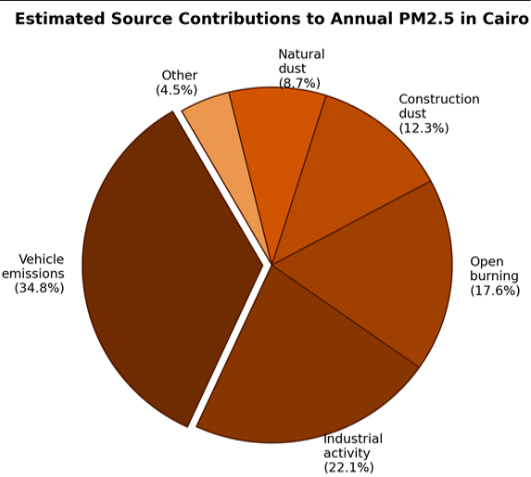 Figure 1
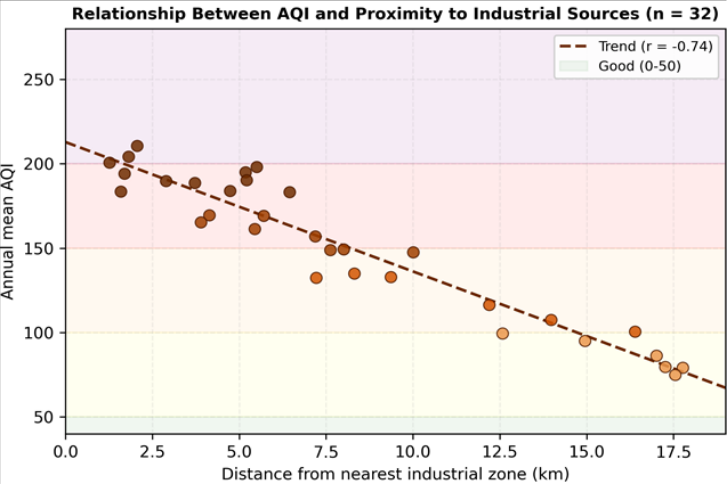 Figure 2
Introduction
Cairo is simultaneously one of the world's oldest continuously inhabited cities and one of its most polluted. The World Health Organization has repeatedly ranked it among the top ten megacities for ambient particulate matter concentrations [1] . With a metropolitan population exceeding 21 million, a vehicle fleet growing at 7% per year, and a semi-arid climate that limits pollutant dispersion, Cairo faces air quality challenges that few cities of comparable size have managed to resolve [2,3] . Particulate matter-especially particles smaller than 2.5 μm (PM2.5)-is the pollutant most strongly linked to cardiovascular and respiratory morbidity. The WHO's 2021 guidelines set an annual mean PM2.5 target of 15 μg/m³, but monitoring data from Cairo consistently show values five to eight times higher [4] . The Air Quality Index converts raw pollutant concentrations into a single dimensionless number that communicates health risk to the public on a colour-coded scale [5] . Despite its simplicity, AQI-based assessments for Cairo remain uncommon in the peer-reviewed literature; most published work has focused on either single pollutants or short monitoring windows [6,7] . Two seasonal phenomena dominate Cairo's particulate load. In spring, khamsin winds carry Saharan dust into the Nile valley, raising PM10 above 500 μg/m³ during peak events [8] . In autumn, farmers burn rice straw in the Delta, producing a "black cloud" smog that blankets Greater Cairo for weeks [9] . Between these peaks, vehicular and industrial emissions maintain a high baseline. This research aimed to (a) map the spatial distribution of AQI, PM2.5, and PM10 across Greater Cairo over a four-year period, (b) identify seasonal patterns and their meteorological drivers, and (c) apportion PM2.5 sources using a positive matrix factorisation (PMF) receptor model. All data processing and modelling were carried out at the Cartagena Institute of Climate and Environment, Bolívar, Colombia, using datasets shared by the Egyptian Environmental Affairs Agency.
Model Description and Parameterisation
Source apportionment was performed with EPA PMF version 5.0, a multivariate receptor model that decomposes measured concentrations into source profiles and contributions without requiring a priori emission inventories [10] . The model solves X = GF + E, where X is the concentration matrix, G the source contribution matrix, F the source profile matrix, and E the residual. Input data comprised 384 PM2.5 filter samples analysed for 18 species: EC, OC, sulphate, nitrate, ammonium, and 13 trace elements. Uncertainty estimates followed Polissar et al. [11] . The model was tested with 4-8 factors and 100 bootstrap iterations; a six-factor solution was selected based on the lowest Q-robust/Q-expected ratio and physical interpretability.
Materials and Methods
Materials and Methods
Materials
Air quality data were obtained from 32 monitoring stations operated by the Egyptian Environmental Affairs Agency across Greater Cairo, classified as traffic (n = 12), industrial (n = 8), residential (n = 7), and suburban (n = 5). PM2.5 and PM10 were measured by beta-attenuation monitors (Met One BAM-1022) recording hourly averages. Meteorological variables came from co-located weather stations. Additionally, 384 PM2.5 filter samples were collected at four representative sites for chemical speciation. Monitoring ran from March 2019 to February 2023. Analysis was carried out at the Cartagena Institute of Climate and Environment, Bolívar, Colombia.
Methods
AQI was calculated from daily average PM2.5 and PM10 concentrations using the US EPA breakpoint table, which assigns index values from 0 ("good") to 500 ("hazardous") [5] . When both pollutants exceeded reporting thresholds, the higher sub-index was reported as the composite AQI. Seasonal means were computed for spring (Mar-May), summer (Jun-Aug), autumn (Sep-Nov), and winter (Dec-Feb). Spatial interpolation of annual mean AQI across the metropolitan area used ordinary kriging in ArcGIS 10.8 with a spherical variogram model. Pearson correlation was used to test the association between AQI and distance from the nearest industrial zone. Chemical speciation data fed the PMF receptor model described above. policy level of roughly 42 μg/m³, though direct comparisons must account for differences in monitoring protocols and station placement [1,12] . The dominance of vehicle emissions (34.8% of PM2.5) is consistent with Cairo's traffic densityestimated at over 4.5 million registered vehicles in the governorate, many running on subsidised diesel fuel with weak emission standards [13] .
Results
The two seasonal peaks need different policy responses. The autumn black-cloud episode is amenable to intervention: converting rice straw to compost or bioenergy has been piloted since 2010 but adoption remains low [9,14] . Spring khamsin dust is natural and can only be managed through forecasting and health advisories [8] . Between episodes, traffic and industry keep AQI in the "unhealthy for sensitive groups" band almost year-round. The spatial gradient from industrial to suburban sites (PLI ranging from 182 to 97) confirms that emission proximity remains a strong predictor of exposure, even in a city where regional background levels are already high [15] . This has equity implications: industrial-zone residents, who tend to be lower income, bear a disproportionate pollution burden. Shifting freight transport to ring roads, expanding the Cairo Metro, and enforcing vehicular inspection programmes would address the largest single source. Bootstrap analysis (100 runs) showed all six factors reproduced in over 92% of resamples, and displacement diagnostics found no factor swaps [10,16] . Excluding one site at a time changed source estimates by less than±3.1%.
Conclusion
This research mapped the AQI and particulate matter distribution across Greater Cairo over four years using data from 32 monitoring stations. Annual mean PM2.5 ranged from 47 μg/m³ at suburban locations to 129 μg/m³ near the Helwan industrial belt-three to eight times the WHO guideline. AQI exceeded the "unhealthy" threshold on more than 40% of monitored days. Two seasonal peaks-autumn rice-straw burning and spring khamsin dust-superimposed onto a high vehicular and industrial baseline. PMF source apportionment identified vehicle emissions as the largest PM2.5 contributor (34.8%), followed by industry and open burning. The strong negative correlation between AQI and distance from industrial zones highlights that exposure is spatially uneven and concentrated in lower-income districts. Practical steps to improve air quality include enforcing vehicular emission standards, expanding alternatives to ricestraw burning, and relocating heavy freight traffic away from residential corridors. Future work should incorporate personal exposure monitoring and health-outcome data to translate ambient concentrations into quantitative diseaseburden estimates.
Acknowledgement
Acknowledgements Funding SourcesThis research was supported by departmental funds from the Cartagena Institute of Climate and Environment, Bolívar, Colombia. Institutional SupportThe authors thank the Cartagena Institute of Climate and Environment for computational resources and modelling software access.
Figures and tables from the paper
| Category | n | PM2.5 (μg/m³) | PM10 (μg/m³) | AQI | Days >150 | Days >200 |
|---|---|---|---|---|---|---|
| Traffic | 12 | 108.4 | 231.7 | 164 | 187 | 78 |
| Industrial | 8 | 128.6 | 267.3 | 182 | 214 | 103 |
| Residential | 7 | 83.1 | 178.4 | 139 | 131 | 42 |
| Suburban | 5 | 47.3 | 112.8 | 97 | 63 | 11 |
Table text extracted from the original PDF; superscript letters are shown inline. The original table image is below.
View original table image
| Season | PM2.5 | PM10 | AQI | Dominant driver |
|---|---|---|---|---|
| Spring | 94.7 | 247.1 | 168 | Khamsin dust + traffic |
| Summer | 78.3 | 164.8 | 134 | Vehicle + industrial baseline |
| Autumn | 112.4 | 198.6 | 179 | Rice-straw burning + stagnation |
| Winter | 86.9 | 173.2 | 147 | Inversion trapping + heating |
Table text extracted from the original PDF; superscript letters are shown inline. The original table image is below.
View original table image
References
20 in the original paper- World Health Organization. WHO global air quality guidelines: particulate matter (PM2.5 and PM10), ozone, nitrogen dioxide, sulfur dioxide and carbon monoxide. World Health Organization. 2021. Geneva.
- Zakey AS, Abdel-Wahab MM, Pettersson JBC, et al. A modelling study of aerosol and gaseous pollutants over Greater Cairo. Atmospheric Chemistry and Physics. 2008;8(15):3535-3555.
- Wheida A, Nasser A, El-Nazer M, et al. Tackling the mortality from long-term exposure to outdoor air pollution in megacities: lessons from the Greater Cairo Metropolitan Area. Environment International. 2018;117:334-350.
- Shaltout AA, Boman J, Welz B, et al. Monitoring of particulate matter in Cairo using energy-dispersive Xray fluorescence. Spectrochimica Acta Part B. 2013;86:52-59.
- United States Environmental Protection Agency. Technical assistance document for the reporting of daily air quality-The air quality index. EPA 454/B-18007. 2018. Washington DC.
- Abu-Allaban M, Gertler AW, Lowenthal DH. A preliminary apportionment of the sources of ambient PM10, PM2.5, and VOCs in Cairo, Egypt. Atmospheric Environment. 2002;36(35):5549-5557.
- Favez O, Cachier H, Sciare J, et al. Characterization of particulate matter in Cairo during the 2003 black cloud episode. Atmospheric Chemistry and Physics. 2008;8(2):271-281.
- Prospero JM, Ginoux P, Torres O, et al. Environmental characterization of global sources of atmospheric soil dust derived from the NIMBUS-7 TOMS absorbing aerosol product. Reviews of Geophysics. 2002;40(1):21.
- Rashed A, Afifi A, Dowidar A. Rice straw burning and the black cloud over Cairo. Journal of the Air and Waste Management Association. 2014;64(10):11651174.
- Paatero P, Tapper U. Positive matrix factorization: a non-negative factor model with optimal utilization of error estimates. Environmetrics. 1994;5(2):111-126.
- Polissar AV, Hopke PK, Paatero P, et al. Atmospheric aerosol over Alaska: 2. elemental composition and sources. Journal of Geophysical Research. 1998;103(D15):19045-19057.
- Guttikunda SK, Calori G. A GIS-based emissions inventory at 1 km × 1 km spatial resolution for air pollution analysis in Delhi, India. Atmospheric Environment. 2013;67:101-111.
- El-Metwally M, Alfaro SC, Abdel Wahab M, et al. Aerosol properties and associated radiative effects over Cairo (Egypt). Atmospheric Research. 2011;99(2):263276.
- Said N, El-Shatoury SA, Díaz LF, et al. Quantitative appraisal of biomass resources and their energy potential in Egypt. Renewable and Sustainable Energy Reviews. 2013;24:32-41.
- Abbass RA, Kumar P, El-Gendy A. An overview of monitoring and reduction strategies for health and climate change related emissions in the MENA region. Atmospheric Environment. 2018;175:33-52.
- Brown SG, Eberly S, Paatero P, et al. Methods for estimating uncertainty in PMF solutions: examples with ambient air and water quality data. Chemometrics and Intelligent Laboratory Systems. 2015;149:63-75.
- Abdel-Latif NM, Saleh IA. Heavy metals contamination in roadside dust along major roads in Cairo. Journal of Environmental Sciences. 2012;24(8):1474-1482.
- Kanakidou M, Mihalopoulos N, Kindap T, et al. Megacities as hot spots of air pollution in the East Mediterranean. Atmospheric Environment. 2011;45(6):1223-1235.
- Marey HS, Gille JC, El-Askary HM, et al. Aerosol climatology over Nile Delta based on MODIS, MISR and OMI satellite data. Atmospheric Chemistry and Physics. 2011;11(20):10637-10648.
- Zakey AS, Solmon F, Giorgi F. Implementation and testing of a desert dust module in a regional climate model. Atmospheric Chemistry and Physics. 2006;6(12):4687-4704.