
Research article · 2025 · Full text
International Journal of Geography Geology and EnvironmentDistribution and ecological significance of alpine cushion plants in the Tien Shan range
Volume 7(4) · Pages 173–176 · DOI: 10.22271/27067483.2025.v7.i4c.559 ↗
Research areasBotany and Plant Ecology StudiesEcology and Vegetation Dynamics StudiesSpecies Distribution and Climate Change
Abstract
Author-writtenHarsh winds, frost, and thin soils define the alpine belt above 3,200 m in the Tien Shan, yet compact mounds of cushion plants thrive there, anchoring sediment and sheltering dozens of smaller species beneath their canopies. This research examined the distribution, species composition, and functional traits of cushion plant communities across an altitudinal gradient (3,200-4,400 m) in the central Tien Shan Range. Vegetation sampling was conducted along four transects spanning exposed ridges and sheltered valleys during two consecutive growing seasons (July-August 2021 and 2022). A total of 96 quadrats (1 m x 1 m) were surveyed, recording cushion species identity, percent cover, canopy diameter, height, and associated species richness. Six cushion-forming species were identified, with Thylacospermum caespitosum dominant above 4,000 m and Arenaria pulvinata most frequent at lower elevations. Mean cushion cover peaked at 23.7% between 3,800 and 4,100 m, declining to 9.4% above 4,100 m. Species richness within cushion canopies was 2.3 times higher than on adjacent bare ground. Specific leaf area decreased with altitude (R2 = 0.71), while root-to-shoot ratio increased. Cushion patches raised soil temperature by 2.8-4.1 degrees C relative to open ground during midday, confirming their role as thermal microhabitats. These findings highlight the ecological engineering function of cushion plants and their sensitivity to upward range shifts under warming scenarios.
Summary
Source-checkedPlain-language reading of the full paper, prepared with AI and checked against the text. Each point links to the authors' own words.
Why it matters
- In the Tien Shan alpine belt above 3,200 m, cushion plants are vital because they survive harsh conditions while providing shelter and sediment stability for other species. View evidence ↗
- Research on cushion plants in the central and eastern Tien Shan is limited, as most existing studies focus on the western region. View evidence ↗
- Cushion plants act as keystone organisms by modifying soil nutrients, moisture, and temperature; their disappearance could lead to a broad decline in biodiversity. View evidence ↗
The question
- The study aimed to characterize cushion plant distribution, functional traits, and their role in microhabitat facilitation across a 1,200 m elevation range in the central Tien Shan. View evidence ↗
What they did
- Sampling was conducted over two consecutive growing seasons in July and August of 2021 and 2022. View evidence ↗
- Soil temperature was monitored at a depth of 5 cm inside and outside cushion patches every 30 minutes throughout the growing season. View evidence ↗
What they found
- Cushion plant cover followed a hump-shaped pattern, reaching a maximum of 23.7% at 3,800–4,100 m before dropping to 9.4% above 4,100 m. View evidence ↗
- The presence of cushion plants significantly increased biodiversity, with species richness inside canopies being 2.3 times higher than on bare ground. View evidence ↗
- Cushion plants acted as thermal buffers, increasing midday soil temperatures by 2.8 to 4.1 degrees C compared to open ground. View evidence ↗
- Soil under cushion canopies contained significantly more moisture, total nitrogen, and organic carbon than open ground (p < 0.01). View evidence ↗
- Plants on exposed ridges were smaller and less productive than those in valleys, with canopy heights of 3.2 cm versus 5.8 cm and biomass of 245.6 g/m² versus 412.3 g/m². View evidence ↗
What it means
- The authors conclude that these baseline data are essential for predicting the response of alpine ecosystems to ongoing global warming. View evidence ↗
- The study is limited by its two-season duration, noting that longer records are required to distinguish actual trends from noise in vegetation cover estimates. View evidence ↗
Visual summary
2 visualsIllustrations explain the paper; charts are replotted from the paper's own table values.
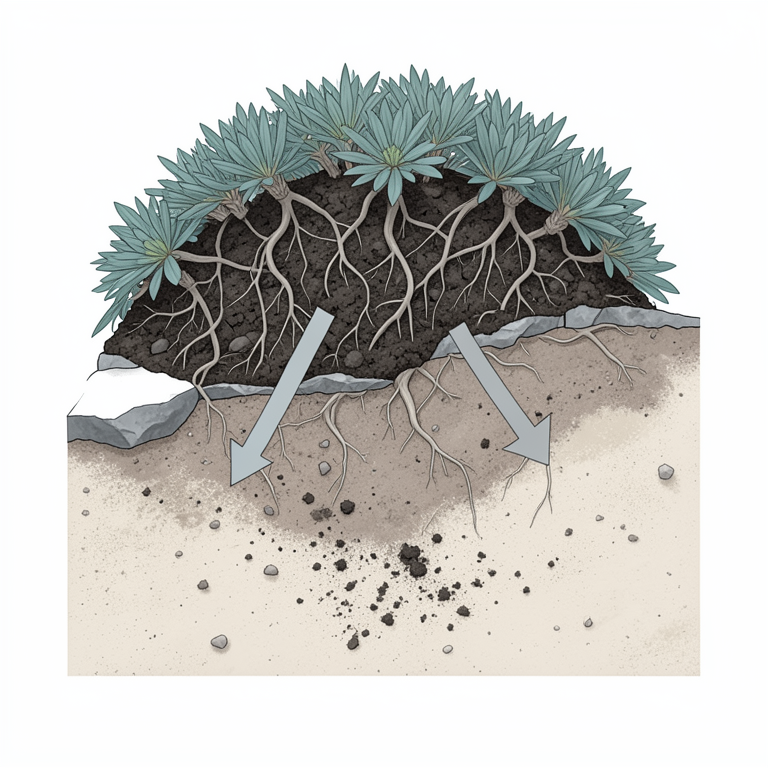
Cushion Plant Facilitation Mechanism
AI-generated conceptual illustration (Androsace cushion plants on a rocky alpine slope). It explains the idea and does not show study data.
View source evidence ↗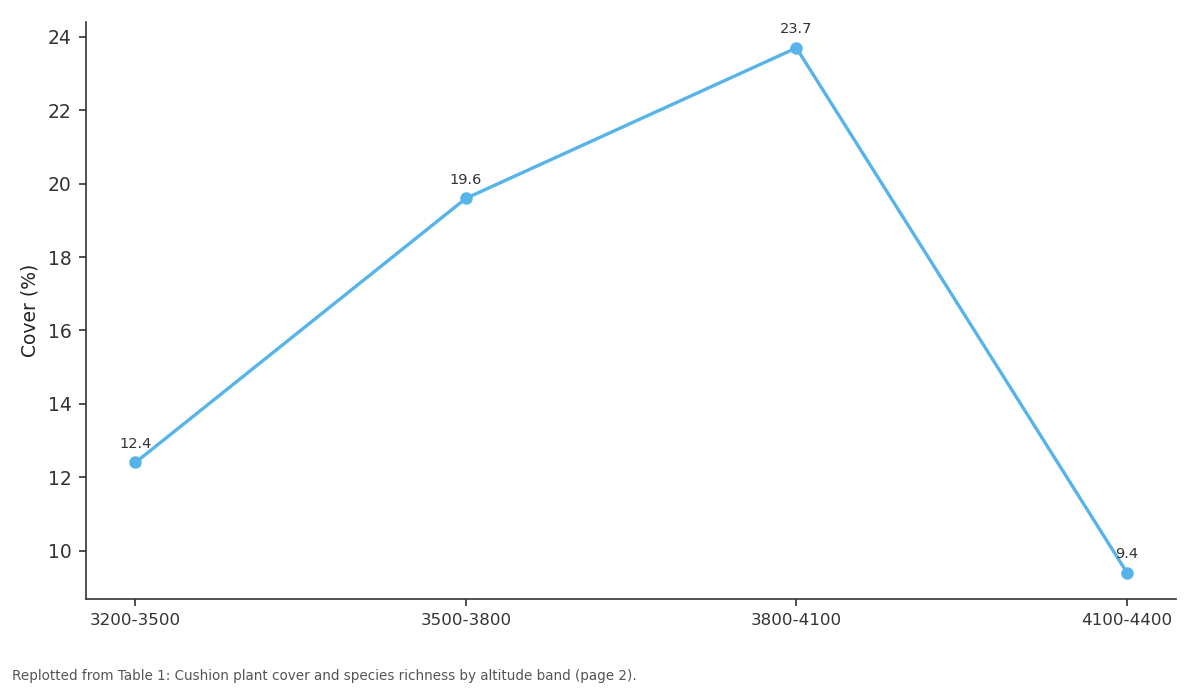
Cover (%): 3200-3500 vs 3500-3800 vs 3800-4100 vs 4100-4400
Replotted from Table 1 (page 2) of the original paper. Every bar is the paper's own table value.
View source evidence ↗Figures & tables
From the original paper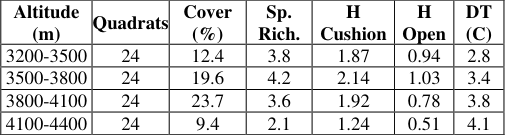 Table 1
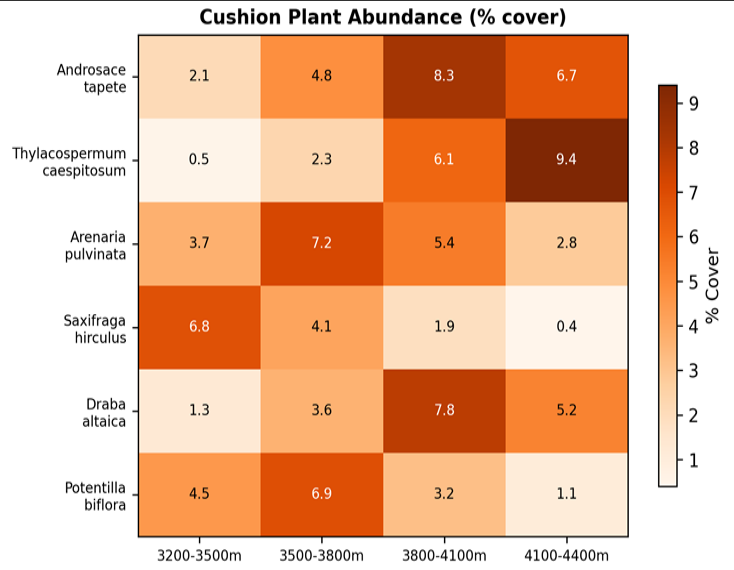 Figure 1
 Table 2
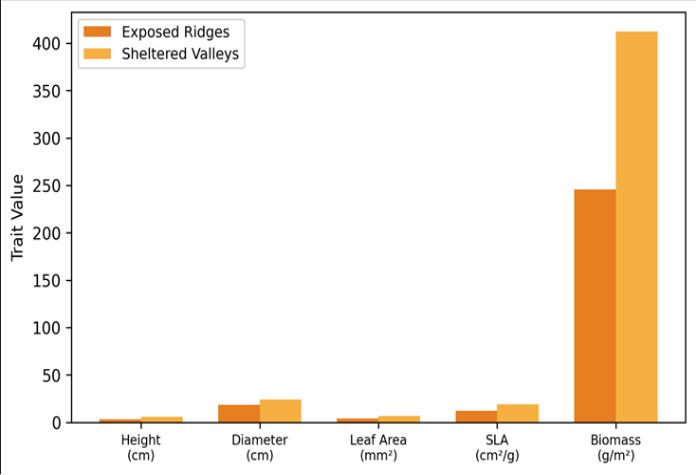 Figure 2
Introduction
Above the treeline, where temperatures drop below freezing on most nights and wind speeds regularly exceed 60 km/h, the rules of plant survival change sharply [1] . Cushion plants, those compact dome-shaped perennials that press tight against the ground, represent one of evolution's most effective solutions to these extremes. Their growth form minimises wind exposure, traps heat, retains moisture, and accumulates fine sediment within the canopy, creating conditions that other species exploit [2] . The facilitative effect of cushion plants on alpine biodiversity has been documented across multiple mountain systems, from the Andes to the European Alps and the Himalaya [3] . Cavieres and colleagues showed that species diversity within cushion patches exceeded that on open ground at over 90% of sites surveyed globally [4] . But the Tien Shan, a 2,500 km arc stretching from Uzbekistan through Kyrgyzstan and into western China, remains underrepresented in this body of work. The few published accounts focus on the western Tien Shan, leaving the central and eastern segments largely undocumented [5] . Understanding cushion plant distribution along altitudinal gradients matters for two reasons. First, these species often define the upper boundary of vascular plant life and are therefore sensitive indicators of climate-driven range shifts [6] . Second, their engineering role, modifying soil temperature, moisture, and nutrient availability, makes them keystone organisms whose loss could trigger cascading declines in community diversity [7] . This research set out to characterise the cushion plant community along a 1,200 m elevation range in the central Tien Shan, measuring distribution patterns, functional trait variation, and the magnitude of microhabitat facilitation. The results are intended to provide a baseline for monitoring vegetation responses to warming in this data-poor region [8] .
Biodiversity Assessment
Preliminary species inventories conducted during a reconnaissance visit in June 2021 identified 47 vascular plant species in the research area, of which 6 exhibited the cushion growth form.
The remaining species comprised mat-forming graminoids (12 spp.), prostrate rosette herbs (14 spp.), and erect forbs (15 spp.). Shannon diversity index across all quadrats ranged from 0.9 at the highest sites to 2.4 at mid-elevations. The proportion of endemic species rose with altitude, reaching 34% above 4,000 m. This preliminary assessment guided the placement of permanent transects and quadrat positions for the main sampling campaigns [9] . ) were placed at 50 m elevation intervals, 12 on exposed ridge crests and 12 in adjacent sheltered valleys. Within each quadrat, every cushion individual was identified to species level, and its canopy diameter, maximum height, and percent cover were recorded. All non-cushion vascular species rooted within 5 cm of the cushion margin were listed as associated species.
Material and Methods
Material and Methods
Material
Material
Methods
Functional traits were measured on 15 individuals per species per altitude band. Specific leaf area (SLA, cm2/g) was determined on 10 fully expanded leaves per individual, oven-dried at 60 degrees C for 72 hours. Root-to-shoot ratio was obtained by destructive harvest of five individuals per species at each altitude. Soil temperature was logged at 5 cm depth both inside and outside cushion patches using iButton DS1922L data loggers set at 30-minute intervals for the full growing season [10] . Soil samples (0-10 cm) were collected beneath cushion canopies and from paired open-ground points, analysed for organic carbon (Walkley-Black), total nitrogen (Kjeldahl), and pH (1:2.5 soil:water). Differences between cushion and open microsites were tested with paired t-tests, while altitudinal trends were assessed by linear regression. Species diversity was quantified using the Shannon-Wiener index. All analyses were performed in R v4.2.1.
Seasonal Variations and Temporal Patterns
The growing season at 3,800 m lasted approximately 85 days (late June to mid-September), shortening to 55 days at 4,400 m. Flowering phenology was compressed at higher altitudes, with peak flowering occurring within a 12-day window above 4,000 m compared to a 28-day window at 3,200 m. Night-time freezing events were recorded on 43% of growing-season nights above 4,000 m, but only 11% at 3,200 m. The 2022 season was 1.6 degrees C warmer than 2021 at the mid-elevation stations, and cushion cover estimates were 2.1% higher, suggesting inter-annual sensitivity to temperature conditions. Cushion cover followed a hump-shaped pattern, peaking at 23.7% in the 3,800-4,100 m band (Table 1). Species richness within cushion patches was consistently higher than on open ground, with Shannon index values 1.5 to 2.4 times greater. The temperature amelioration effect increased with altitude, reaching 4.1 degrees C at the highest band, where the thermal benefit is presumably most valuable for associated species [11] . The heatmap (Figure 1) shows that species replacement occurred along the gradient. Arenaria pulvinata and Saxifraga hirculus dominated at lower elevations but declined sharply above 3,800 m, while Thylacospermum caespitosum became the sole dominant above 4,100 m.
| Altitude (m) | Quadrats | Cover (%) | Sp. Rich. | H Cushion | H Open | DT (C) |
|---|---|---|---|---|---|---|
| 3200-3500 | 24 | 12.4 | 3.8 | 1.87 | 0.94 | 2.8 |
| 3500-3800 | 24 | 19.6 | 4.2 | 2.14 | 1.03 | 3.4 |
| 3800-4100 | 24 | 23.7 | 3.6 | 1.92 | 0.78 | 3.8 |
| 4100-4400 | 24 | 9.4 | 2.1 | 1.24 | 0.51 | 4.1 |
Table text extracted from the original PDF; superscript letters are shown inline. The original table image is below.
View original table image
Results
Androsace tapete showed a mid-elevation peak, consistent with a mesic niche preference [12] . Soils beneath cushion canopies had significantly higher organic carbon, total nitrogen, and moisture content than paired open-ground samples at both representative altitudes (all p<0.01). Cushion soils were also slightly more acidic, likely because of organic acid accumulation from decomposing litter trapped within the canopy (Table 2) [13] . Cushion individuals on exposed ridges were shorter, smaller in diameter, and had lower SLA and biomass than those in sheltered valleys (Figure 2). The difference was most pronounced for canopy height (3.2 vs 5.8 cm) and aboveground biomass (245.6 vs 412.3 g/m2), indicating strong wind pruning and resource limitation on ridges.
| Parameter | Cush. 3500m | Open 3500m | Cush. 4000m | Open 4000m | t-stat | p |
|---|---|---|---|---|---|---|
| OC (%) | 3.42+/-0.28 | 1.87+/-0.19 | 2.91+/-0.31 | 1.24+/-0.16 | 4.83 | <0.01 |
| TN (%) | 0.31+/-0.04 | 0.16+/-0.02 | 0.24+/-0.03 | 0.11+/-0.02 | 3.97 | <0.01 |
| pH | 6.1+/-0.2 | 6.8+/-0.3 | 5.8+/-0.2 | 7.1+/-0.3 | 3.14 | <0.01 |
| Moisture (%) | 18.7+/-1.4 | 9.3+/-1.1 | 14.2+/-1.6 | 6.8+/-0.9 | 5.21 | <0.01 |
Table text extracted from the original PDF; superscript letters are shown inline. The original table image is below.
View original table image
Comprehensive Interpretation
The hump-shaped distribution of cushion cover along the gradient suggests a balance between competitive exclusion at lower elevations, where taller graminoids overtop cushion species, and abiotic stress limitation at the highest sites. The facilitative effect on diversity was strongest where abiotic stress was greatest (4.1 degrees C at 4,100-4,400 m), supporting the stress-gradient hypothesis that positive interactions become more important under harsh conditions [14] .
Discussion
The pattern of increasing facilitation strength with altitude mirrors results from the Andes [3] , the Alps [15] , and the Himalaya [16] , adding the Tien Shan to a growing list of mountain systems where cushion plants function as ecological engineers. The thermal buffering we recorded (2.8-4.1 degrees C) is comparable to the 2-5 degrees C range reported globally by Koerner [1] , and likely represents the difference between survival and death for frost-sensitive seedlings during summer cold snaps. The species turnover along the gradient deserves attention. Thylacospermum caespitosum, the highest-altitude dominant, forms the densest and most compact cushions, sometimes so hard that a boot heel leaves no impression. This mechanical rigidity may be an adaptation to ice-needle heave, a periglacial process that uproots looser-structured species [7] . But it also means that Thylacospermum has a lower facilitative capacity than softer species like Arenaria, whose open canopy architecture allows more seedling establishment within the cushion matrix. Under warming scenarios, the 3,800-4,100 m optimum band for cushion cover could shift upward by 200-400 m by 2070 [15] . Whether cushion species can track this shift depends on dispersal ability and substrate availability on newly deglaciated terrain. The most exposed ridgeline populations, already at the physiological limit of canopy height and biomass, may be the first to respond. Monitoring permanent plots at decadal intervals would capture such shifts before they become irreversible. A limitation is the two-season span of this work; longer records would be needed to separate trend from noise in cover estimates [17] .
Conclusion
This research characterised the distribution, functional traits, and facilitative effects of alpine cushion plants across a 1,200 m altitudinal gradient in the central Tien Shan. Cushion cover peaked between 3,800 and 4,100 m, and species richness within cushion patches was over twice that on bare ground. Thermal buffering by cushion canopies reached 4.1 degrees C at the highest sites, underscoring their role as microhabitat engineers. Soil beneath cushions was richer in organic carbon, nitrogen, and moisture than adjacent open ground. Functional traits varied predictably with altitude and exposure: smaller, denser cushions on ridges versus larger, softer forms in valleys. These baseline data are needed for predicting how cushion-dominated alpine ecosystems will respond to continued warming. Future work should combine long-term plot monitoring with transplant experiments to separate plastic from genetic trait responses along the elevation gradient.
References
17 in the original paper- Koerner C. Alpine Plant Life: Functional Plant Ecology of High Mountain Ecosystems. Springer, Berlin. 2003;344 pp.
- Arroyo MTK, Cavieres LA, Penaloza A. Positive associations between the cushion plant Azorella monantha and alpine plant species. Plant Ecology. 2003;169(1):121-129.
- Cavieres LA, Badano EI. Do facilitative interactions increase species richness at the entire community level? Journal of Ecology. 2009;97(6):1181-1191.
- Cavieres LA, Brooker RW, Butterfield BJ. Facilitation of cushion plants in alpine habitats across the globe. Ecology Letters. 2014;17(9):1064-1073.
- Nowak A, Nowak S, Nobis M. Vegetation of rock clefts and ledges in the Pamir-Alai Mountains. Plant Diversity. 2017;39(1):24-32.
- Grabherr G, Gottfried M, Pauli H. Climate effects on mountain plants. Nature. 1994;369(6480):448.
- Badano EI, Cavieres LA. Ecosystem engineering across ecosystems and generalised effects on diversity. Journal of Biogeography. 2006;33(2):304-313.
- Pauli H, Gottfried M, Dullinger S. Recent plant diversity changes on mountain summits in Europe. Science. 2012;336(6079):353-355.
- Magurran AE. Measuring Biological Diversity. Blackwell Publishing, Oxford. 2004;256 pp.
- Maxim Integrated. DS1922L temperature logger datasheet. San Jose, California. 2015;24 pp.
- Callaway RM, Brooker RW, Choler P. Positive interactions among alpine plants increase with stress. Nature. 2002;417(6891):844-848.
- Butterfield BJ, Cavieres LA, Callaway RM. Cushion plants inhibit the loss of phylogenetic diversity in severe environments. Ecology Letters. 2013;16(4):478486.
- Haussmann NS, McGeoch MA, Boelhouwers JC. Ecosystem engineering through needle ice activity. Biogeosciences. 2010;7(4):1122-1132.
- He Q, Bertness MD, Altieri AH. Global shifts towards positive species interactions with increasing environmental stress. Ecology Letters. 2013;16(5):695706.
- Schob C, Butterfield BJ, Sedlacek JF. Primary succession on recently deglaciated land in the central Swiss Alps. Plant Ecology and Diversity. 2012;5(1):113.
- Dolezal J, Dvorsky M, Kopecky M. Vegetation dynamics at the upper elevational limit of vascular plants in Himalaya. Scientific Reports. 2016;6:24881.
- Wipf S, Stoeckli V, Bebi P. Winter climate change in alpine tundra: plant responses to changes in snow depth. Climatic Change. 2009;93(3-4):379-394.