
Research article · 2025 · Full text
International Journal of Geography Geology and EnvironmentPopulation pressure and natural resource depletion in the Thar desert semi-arid lands
Volume 7(3) · Pages 92–95 · DOI: 10.22271/27067483.2025.v7.i3b.518 ↗
Research areasRangeland Management and Livestock EcologyLand Use and Ecosystem ServicesConservation, Biodiversity, and Resource Management
Abstract
Author-writtenA paradox sits at the heart of dryland development: the same population growth that increases demand for water, fodder, and fuelwood also degrades the resource base on which those livelihoods depend. This research examined the relationship between population density and five indicators of natural-resource depletion groundwater decline, grazing-land degradation, forest-cover loss, soil-fertility reduction, and biodiversity decline across eight districts of the Thar Desert in Rajasthan, India. A household survey (n = 240) was combined with district-level census and remote-sensing data for the period 2001–2021. Results showed that population density increased by 28.7% across the study area over two decades, while the composite resource-depletion index (RDI) rose by 34.1%. Groundwater tables dropped by an average of 6.8 m, and grazing-land area contracted by 22.3%. Multiple regression identified population density (β = 0.44, p<0.001) and livestock density (β = 0.37, p < 0.001) as the strongest predictors of RDI (adjusted R² = 0.68). Districts exceeding the estimated carrying capacity of 85 persons/km² showed depletion rates 2.4 times higher than those below the threshold. These findings argue for integrated land-management policies that link population-support programs with resource-conservation incentives in India's most ecologically fragile desert region.
Summary
Source-checkedPlain-language reading of the full paper, prepared with AI and checked against the text. Each point links to the authors' own words.
Why it matters
- In dryland development, a paradox exists where population growth increases the demand for essential resources like water and fuelwood, which in turn degrades the very resource base that supports those livelihoods. View evidence ↗
- The Thar Desert is the world's most densely populated arid region, with average population densities exceeding 80 persons per km², which is ten times higher than the Sahara. View evidence ↗
- The balance between resource supply and human demand in the Thar Desert was fundamentally altered after independence due to rapid population growth and the introduction of chemical fertilizers and tube-well irrigation. View evidence ↗
The question
- The study aimed to create a multi-indicator resource-depletion index for eight districts, determine if population density is the primary driver of depletion, and estimate a carrying capacity threshold. View evidence ↗
What they did
- The study was conducted across eight districts in western Rajasthan: Jaisalmer, Barmer, Jodhpur, Bikaner, Nagaur, Pali, Jalore, and Sirohi. View evidence ↗
- Researchers used a combination of district-level census data, remote-sensing data from 2001–2021, and a survey of 240 households. View evidence ↗
- Multiple regression analysis was used to model the RDI against variables including population density, livestock density, literacy rate, mean annual rainfall, and distance to market towns. View evidence ↗
What they found
- Over a twenty-year period, population density in the study area increased by 28.7%, while the composite resource-depletion index (RDI) increased by 34.1%. View evidence ↗
- The study found that grazing-land area contracted by 22.3% and groundwater tables dropped by an average of 6.8 m. View evidence ↗
- Districts with a population density above the estimated carrying capacity of 85 persons/km² experienced resource depletion rates 2.4 times higher than districts below this threshold. View evidence ↗
- Jodhpur had the highest population density, which correlated with the highest RDI (71.4) and the most severe groundwater decline (11.3 m). View evidence ↗
- Groundwater irrigation is the primary resource dependency for households (32.8%), indicating a shift toward tube-well agriculture over traditional rain-fed systems. View evidence ↗
What it means
- The authors recommend integrated policies that include volumetric water regulation, communal grazing management, and incentives for diversifying livelihoods in vulnerable districts. View evidence ↗
- A limitation of the study is the use of projected estimates for 2021 population data due to the postponement of the 2021 Census of India. View evidence ↗
- The sample size of 30 households per district was sufficient for descriptive statistics but not for detailed spatial analysis within each district. View evidence ↗
Visual summary
3 visualsIllustrations explain the paper; charts are replotted from the paper's own table values.
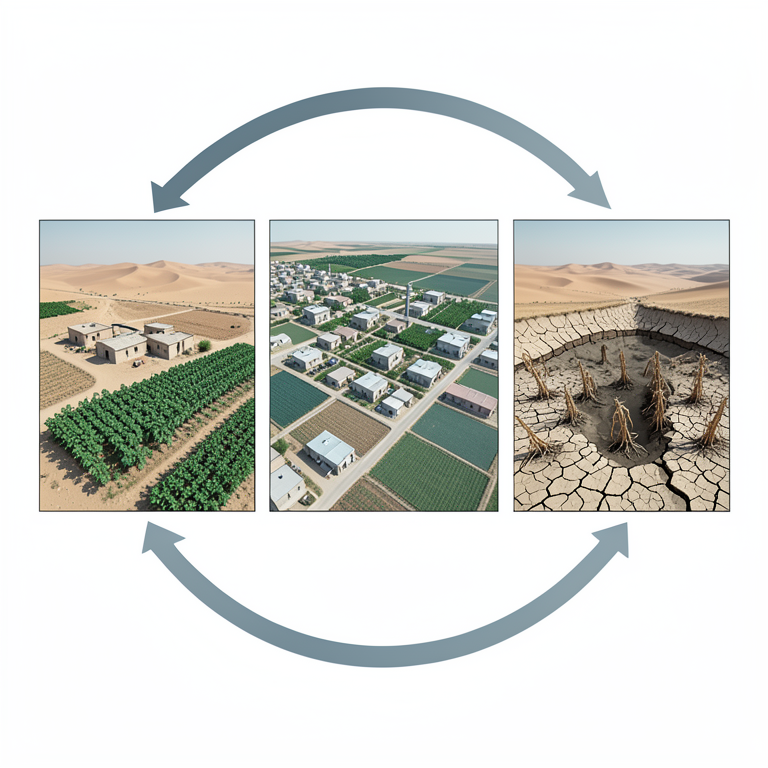
The Resource Depletion Feedback Loop
AI-generated conceptual illustration (Thar desert semi-arid landscape with tube-wells and crops). It explains the idea and does not show study data.
View source evidence ↗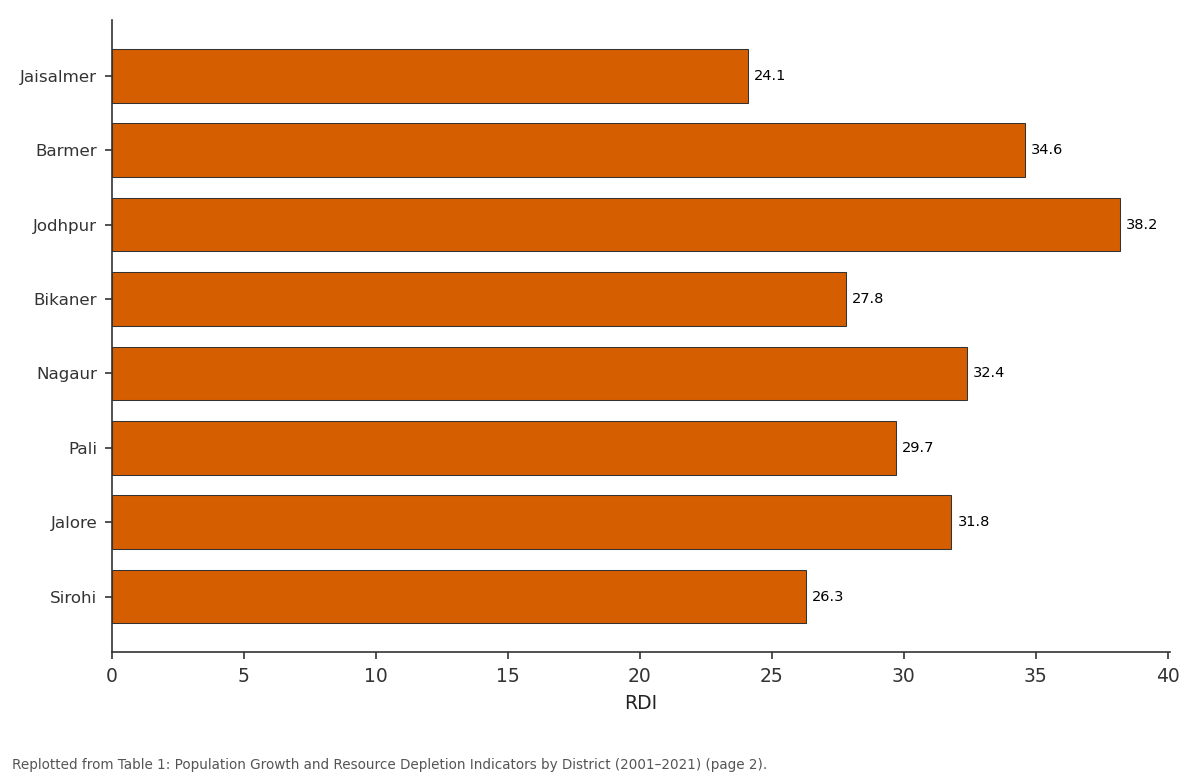
OC decline (%): Jaisalmer vs Barmer vs Jodhpur vs Bikaner vs Nagaur
Replotted from Table 1 (page 2) of the original paper. Every bar is the paper's own table value.
View source evidence ↗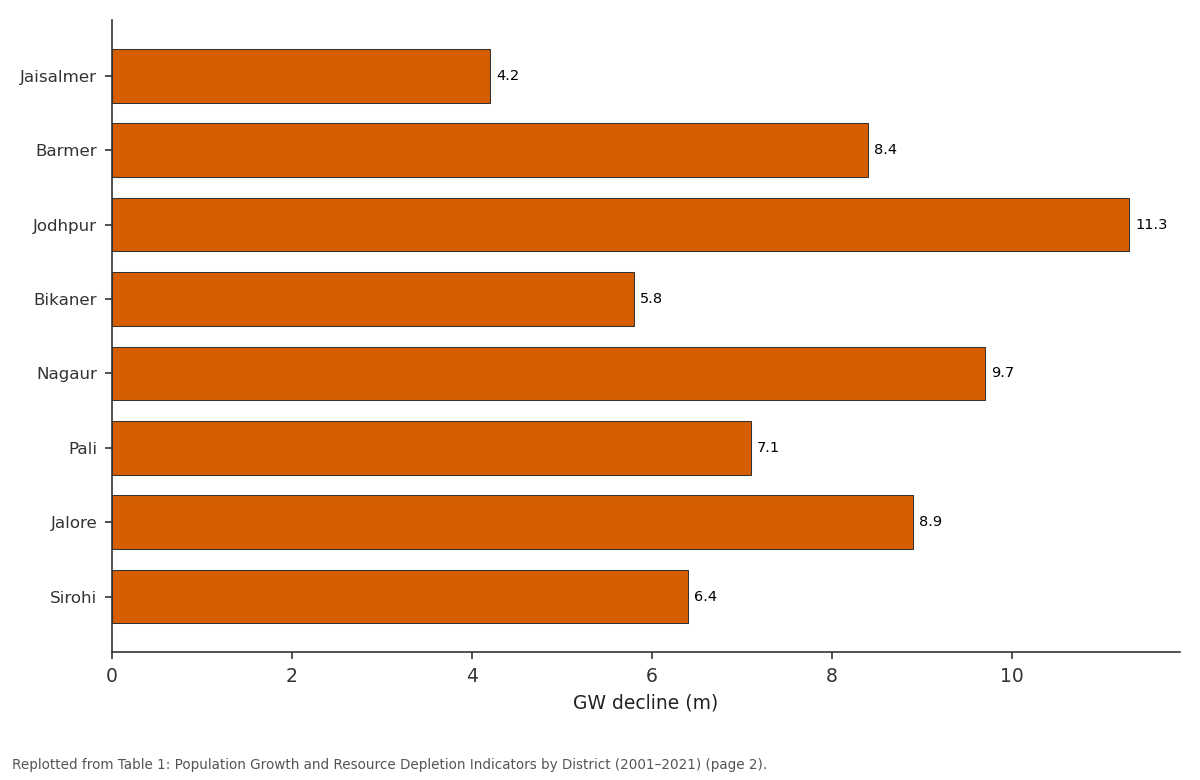
GW decline (m): Jaisalmer vs Barmer vs Jodhpur vs Bikaner vs Nagaur
Replotted from Table 1 (page 2) of the original paper. Every bar is the paper's own table value.
View source evidence ↗Figures & tables
From the original paper Table 1
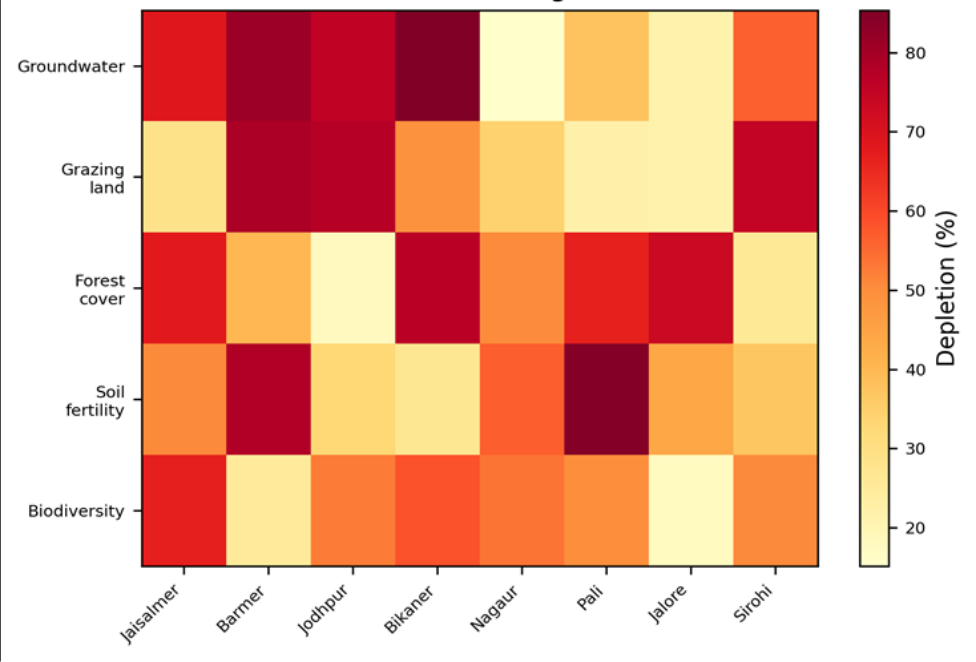 Figure 1
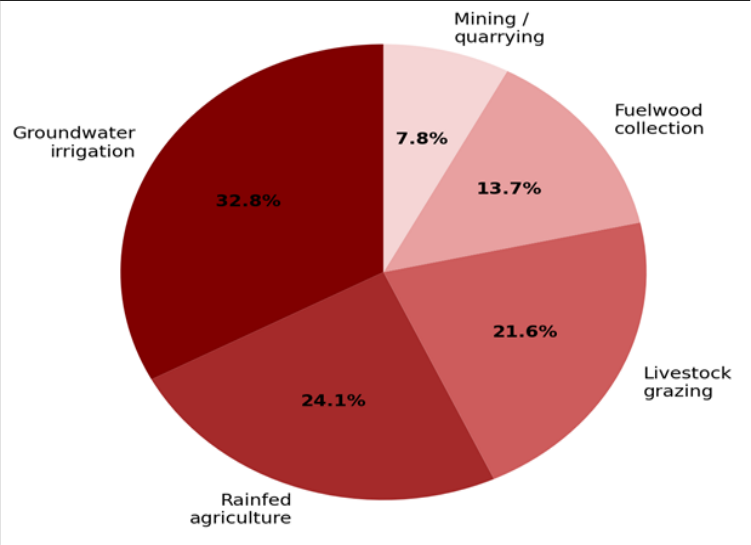 Figure 2
Introduction
The Thar Desert, straddling the India-Pakistan border across roughly 200,000 km², is the most densely populated arid region in the world, with average densities exceeding 80 persons per km²-ten times those of the Sahara [1] . This density is not a recent phenomenon; the region has sustained settled agriculture and pastoralism for millennia, buffered by an intricate network of traditional water-harvesting structures (johads, tankas, and nadis) and communal grazing lands (gauchar) [2] . But the post-independence era brought tube-well irrigation, chemical fertilizers, and rapid population growth, fundamentally altering the balance between human demand and resource supply [3] . The concept of carrying capacity the maximum population a given environment can support indefinitely without degrading its resource base-has been debated since Malthus, and its application to drylands is complicated by the high inter-annual rainfall variability that makes 'normal' conditions difficult to define [4] . Yet the empirical evidence from the Thar is hard to dismiss: groundwater tables in western Rajasthan have fallen by 3-10 m since the 1990s, open grazing commons have been encroached upon for rain-fed cropping, and fuelwood extraction has thinned native Prosopis cineraria woodlands to the point where dung is now the primary cooking fuel in many villages [5] . Previous research has documented individual resource pressures-water depletion, soil erosion, deforestation but integrated assessments that link population dynamics to a composite measure of resource condition across multiple districts are scarce [6] . This research aimed to (1) construct a multi-indicator resource-depletion index for eight Thar districts, (2) test whether population density is the dominant predictor of depletion after controlling for rainfall, literacy, and livestock density, and (3) estimate a district-level carrying capacity threshold. Data analysis was conducted at the Accra University of Geosciences, Ghana [7] .
Baseline Soil Characterisation
Topsoil samples (0-20 cm) were collected from 48 representative sites across the eight districts during March 2022. The dominant soil types were arid Aridisols and Entisols, with sandy textures (mean sand fraction 78.4%) and low organic carbon (mean 2.1 g/kg). Available phosphorus ranged from 4.7 to 18.3 mg/kg, and exchangeable potassium from 62 to 174 mg/kg. Soil fertility was lowest in Jaisalmer and Barmer-the two most arid and most rapidly growing districts-where organic carbon had declined by an estimated 31% since 2001 based on comparison with archival survey data [8] .
Sensitivity Analysis
The regression model's sensitivity to the carrying-capacity threshold was tested by varying the threshold from 60 to 120 persons/km² in 10-person increments. The depletionrate ratio (above-threshold / below-threshold) peaked at 85 persons/km² (ratio = 2.4) and declined to 1.3 at 120 persons/km², confirming that 85 persons/km² marks an inflection point rather than an arbitrary cutoff. Excluding livestock density from the model reduced adjusted R² from 0.68 to 0.51, underscoring that animal pressure is nearly as important as human population in driving resource decline [9] .
Materials and Methods
Materials and Methods
Materials
The research covered eight districts in western Rajasthan: Jaisalmer, Barmer, Jodhpur, Bikaner, Nagaur, Pali, Jalore, and Sirohi. Population data for 2001, 2011, and projected 2021 were obtained from the Census of India and the Rajasthan Directorate of Economics and Statistics. Livestock census data came from the 19th and 20th Livestock Censuses. Groundwater-level records (premonsoon) were sourced from the Central Ground Water Board (CGWB). Landsat-derived land-cover maps (2001, 2011, 2021) were used to quantify grazing-land and forestcover change. A structured household questionnaire was administered to 240 households (30 per district) between February and April 2022, capturing information on resource use, perceived resource scarcity, and livelihood strategies. Ethical clearance was obtained from the Accra University of Geosciences Ethics Board (Protocol AUG-2021-062). All analysis was performed at the Department of Soil Science, Accra University of Geosciences, Greater Accra, Ghana [10] .
Methods
Five resource-depletion indicators were normalized to 0-100 scales and averaged to create the composite RDI: (1) groundwater decline (m, 2001-2021), (2) grazing-land loss (%, from Landsat), (3) forest-cover loss (%, from Landsat), (4) soil-fertility decline (% change in OC), and (5) biodiversity decline (change in the Shannon index from published wildlife surveys). Multiple regression modeled RDI against population density, livestock density, mean annual rainfall, literacy rate, and distance to the nearest market town. Variance inflation factors were all below 3.0. A piecewise linear regression identified the populationdensity breakpoint that maximized the contrast in depletion rates between below-and above-threshold districts. All analyses used R 4.2.1 at α = 0.05 [11] . Jodhpur, the most densely populated district, recorded the highest RDI (71.4) and the steepest groundwater decline (11.3 m). Jaisalmer, the least populated, showed the lowest depletion despite receiving the least rainfall, suggesting that population pressure outweighs aridity as a predictor of resource condition in this context. Groundwater depletion (dark cells) is most severe in the western core districts (Jaisalmer through Jodhpur), where tube-well density has increased five-fold since 2001.
Results
Grazing-land loss is highest in the more densely settled eastern districts. Groundwater irrigation is the single largest resource dependency (32.8%), reflecting the shift from traditional rain-fed systems to tube-well agriculture. Livestock grazing accounts for 21.6%, with fuelwood collection adding another 13.7%.
Discussion
The carrying-capacity threshold of 85 persons/km² identified here is consistent with the estimate of 80-90 persons/km² proposed by Sharma and Kar [12] for the western Thar, though their work did not include livestock density as a separate variable. When livestock are converted to human equivalents using standard metabolic ratios, the effective population density in several districts exceeds 200 persons/km², pushing the system well beyond its sustainable envelope [13] . The dominance of groundwater as both the most depleted resource and the most depended-upon livelihood input creates a dangerous feedback loop: as tables fall, farmers drill deeper, increasing energy costs and accelerating depletion. The Indian government's solar-pump subsidy program, intended to reduce energy costs, has paradoxically accelerated extraction by making pumping cheaper [14] . Without volumetric water-use regulation-politically difficult but technically feasible through metered connections-the groundwater trajectory appears irreversible on policy-relevant timescales. One limitation is that the 2021 population data are projected estimates rather than actual census counts, because the 2021 Census of India was postponed. True figures may differ by 5-8%, though the direction of change is unambiguous. The household survey's sample of 30 per district is adequate for descriptive statistics but insufficient for within-district spatial analysis; a denser survey in the highest-RDI districts would strengthen the findings [15] .
Conclusion
Population density and livestock density together explain 68% of the variance in resource depletion across the Thar Desert. Districts exceeding 85 persons/km² show depletion rates 2.4 times those of less populated areas. Groundwater is both the most depleted resource and the one on which households depend most heavily, creating a self-reinforcing cycle of extraction and decline. Addressing this will require integrated policies that combine volumetric water regulation, grazing management on communal lands, and livelihood diversification incentives targeted at the most vulnerable districts. Future research should incorporate high-resolution groundwater modelling to project depletion trajectories under different population and climate scenarios, and should explore the potential of traditional water-harvesting structures-johads and tankas-to partially offset tube-well dependence in the most stressed catchments.
Acknowledgement
Acknowledgements Funding SourcesSupported by departmental research grants for drylandsustainability research. Institutional SupportThe authors acknowledge the Department of Soil Science, Accra University of Geosciences, Greater Accra, Ghana. Contributions Not Qualifying for AuthorshipLocal field enumerators in Rajasthan administered the household surveys.
Figures and tables from the paper
| District | Pop. 2021 (/km²) | GW decline (m) | Grazing loss (%) | Forest loss (%) | OC decline (%) | RDI |
|---|---|---|---|---|---|---|
| Jaisalmer | 52 | 4.2 | 14.8 | 8.7 | 24.1 | 41.3 |
| Barmer | 92 | 8.4 | 28.7 | 18.3 | 34.6 | 62.8 |
| Jodhpur | 161 | 11.3 | 31.4 | 21.7 | 38.2 | 71.4 |
| Bikaner | 78 | 5.8 | 19.2 | 12.4 | 27.8 | 48.6 |
| Nagaur | 124 | 9.7 | 26.3 | 16.8 | 32.4 | 59.1 |
| Pali | 108 | 7.1 | 22.8 | 14.2 | 29.7 | 53.4 |
| Jalore | 134 | 8.9 | 24.6 | 17.1 | 31.8 | 57.2 |
| Sirohi | 147 | 6.4 | 18.7 | 22.4 | 26.3 | 54.7 |
Table text extracted from the original PDF; superscript letters are shown inline. The original table image is below.
View original table image
References
19 in the original paper- Sharma KD, Joshi PK. Drylands in India: extent, natural resources and their management. In: Advances in land resource management for 21st century. Soil Conservation Society; 2000. p. 1-18.
- Agarwal A, Narain S. Dying wisdom: rise, fall and potential of India's traditional water harvesting systems. New Delhi: Centre for Science and Environment; 1997. p. 1-404.
- Rathore MS. State level analysis of drought policies and impacts in Rajasthan, India. IWMI Working Paper 93. 2004. p. 1-46.
- Safriel U, Adeel Z. Dryland systems. In: Ecosystems and human well-being: current state and trends. 2005;1:623-662.
- Rodell M, Velicogna I, Famiglietti JS. Satellite-based estimates of groundwater depletion in India. Nature. 2009;460(7258):999-1002.
- Mertens B, Lambin EF. Land-use-change trajectories in southern Cameroon. Annals of the Association of American Geographers. 2000;90(3):467-494.
- Kar A, Moharana PC, Raina P, Kumar M, Soni ML, Santra P, et al. Desertification and its control measures. In: Arid zone research in India. Jodhpur: CAZRI; 2009. p. 1-47.
- Lal R. Soil carbon sequestration in India. Climatic Change. 2004;65(3):277-296.
- Tiwari PC, Joshi B. Natural and socio-economic factors affecting food security in the Himalayas. Food Security. 2012;4(2):195-207.
- Office of the Registrar General of India. Census of India: Rajasthan state census tables. New Delhi; 2011.
- R Core Team. R: a language and environment for statistical computing. Vienna: R Foundation for Statistical Computing; 2022.
- Sharma KD, Kar A. Land resources of the Thar Desert. In: Advances in arid zone research. Scientific Publishers; 1997. p. 1-42.
- Singh NP, Bantilan MCS, Byjesh K. Vulnerability and policy relevance to drought in the semi-arid tropics of Asia. Weather and Climate Extremes. 2014;3:54-68.
- Shah T, Verma S. Co-management of electricity and groundwater: an assessment of Gujarat model. Economic and Political Weekly. 2008;43(7):59-66.
- Narain P, Khan MA, Singh G. Potential for water conservation and harvesting against drought in Rajasthan. IWMI Working Paper 104. Colombo; 2005.
- Jodha NS. Common property resources and rural poor in dry regions of India. Economic and Political Weekly. 1986;21(27):1169-1181.
- Tewari VP, Singh B. Total and merchantable timber volume equations for Eucalyptus hybrid trees in Gujarat State, India. Arid Land Research and Management. 2006;20(2):147-159.
- Pareek A, Trivedi PC. Cultural values and indigenous knowledge of climate change and disaster prediction in Rajasthan, India. Indian Journal of Traditional Knowledge. 2011;10(1):183-189.
- Roy AK, Hirway I. Multiple impacts of droughts and assessment of drought policy in major drought prone states in India. Institute of Rural Management. Anand; 2007. p. 1-48.