
Research article · 2025 · Full text
International Journal of Geography Geology and EnvironmentPeriglacial geomorphology and permafrost distribution in the Kamchatka high plateau
Volume 7(4) · Pages 92–95 · DOI: 10.22271/27067483.2025.v7.i4b.526 ↗
Research areasClimate change and permafrostPolar Research and EcologyCryospheric studies and observations
Abstract
Author-writtenWatch the Kamchatka high plateau through a single thaw season and you will see the ground itself move: sorted circles expand, solifluction lobes creep downslope, and thermokarst ponds widen at their margins. This research mapped the distribution and morphometry of periglacial landforms across a 2,400 km2 area of the central Kamchatka high plateau and related their occurrence to permafrost conditions inferred from ground temperature monitoring and electrical resistivity tomography (ERT). Fieldwork was conducted during two summer campaigns (July-September 2021 and 2022). A total of 847 periglacial features were catalogued in six classes: patterned ground (28.3%), solifluction lobes (22.1%), rock glaciers (17.4%), frost mounds (14.8%), thermokarst depressions (10.7%), and ice-wedge polygons (6.7%). Active-layer depth ranged from 0.3 m at 3,200 m elevation to 3.8 m at 800 m. Ground temperatures at 1 m depth varied from -13.1 C at the highest sites to -0.8 C near the lower permafrost boundary. ERT profiles confirmed continuous permafrost above 1,800 m, discontinuous permafrost between 1,200 and 1,800 m, and sporadic occurrences below 1,200 m. Rock glaciers showed the strongest association with discontinuous permafrost, while patterned ground was restricted to the continuous zone. These baseline data are needed for assessing permafrost degradation risk under projected warming scenarios.
Summary
Source-checkedPlain-language reading of the full paper, prepared with AI and checked against the text. Each point links to the authors' own words.
Why it matters
- Periglacial landforms in the Kamchatka high plateau reflect the interaction of gravity, ground ice, and frost action in a highly volcanic permafrost region. View evidence ↗
- While permafrost covers about 65% of Russia, its distribution in Kamchatka is influenced by volcanic ash, steep terrain, and geothermal heat. View evidence ↗
- Conventional maps based only on altitude and latitude often overestimate permafrost extent in volcanic areas because they ignore local geothermal heat. View evidence ↗
The question
- The study aimed to inventory periglacial landforms, measure ground temperature and active-layer thickness, and use Electrical Resistivity Tomography (ERT) to map permafrost distribution. View evidence ↗
What they did
- The researchers mapped periglacial landforms across a 2,400 km² area of the central Kamchatka high plateau. View evidence ↗
- Fieldwork took place between July and September in 2021 and 2022, with camps at elevations of 1,000, 1,500, 2,000, and 2,600 meters. View evidence ↗
- Ground temperature was monitored at 18 points at depths of 0.5 and 1.0 m, and active-layer thickness was measured at 72 points using a steel probe. View evidence ↗
- Electrical Resistivity Tomography (ERT) was performed along eight transects ranging from 200 to 400 meters in length. View evidence ↗
What they found
- The study catalogued 847 features, with patterned ground being the most common (28.3%) and ice-wedge polygons the least common (6.7%). View evidence ↗
- Active-layer depth showed a strong linear decrease as elevation increased, ranging from 3.8 m at 800 m to 0.3 m at 3,200 m. View evidence ↗
- At a depth of 1 meter, ground temperatures ranged from -13.1 °C at the highest elevations to -0.8 °C near the lower permafrost limit. View evidence ↗
- ERT data identified continuous permafrost above 1,800 m, discontinuous permafrost between 1,200 and 1,800 m, and sporadic permafrost below 1,200 m. View evidence ↗
- Patterned ground was found only in the continuous permafrost zone, whereas rock glaciers were most strongly associated with the discontinuous zone. View evidence ↗
What it means
- The two-year monitoring period is considered too short to detect long-term trends, suggesting a need for decadal records. View evidence ↗
Visual summary
3 visualsIllustrations explain the paper; charts are replotted from the paper's own table values.
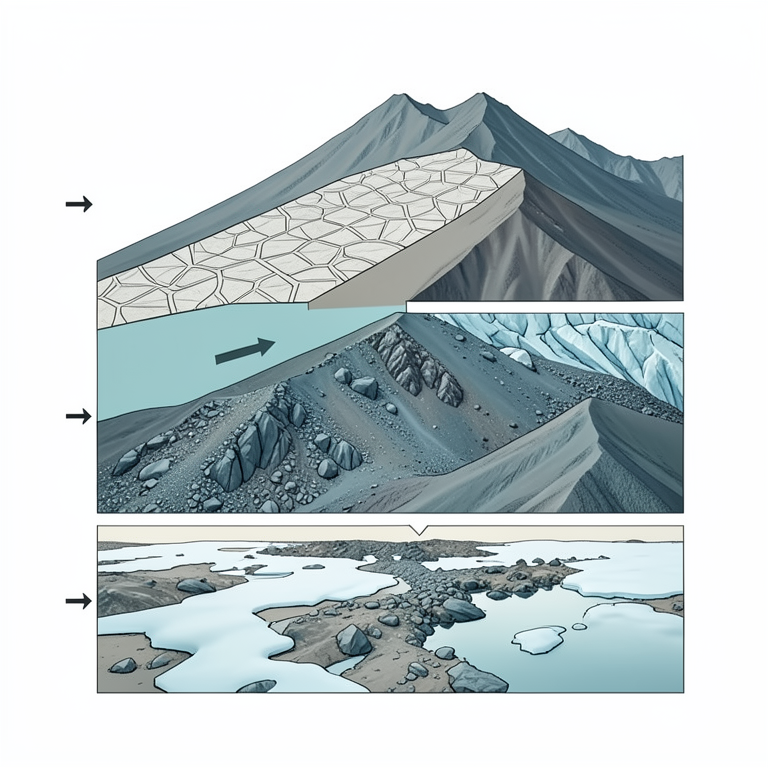
Permafrost Zonation and Landforms
AI-generated conceptual illustration (Kamchatka high plateau mountain slope). It explains the idea and does not show study data.
View source evidence ↗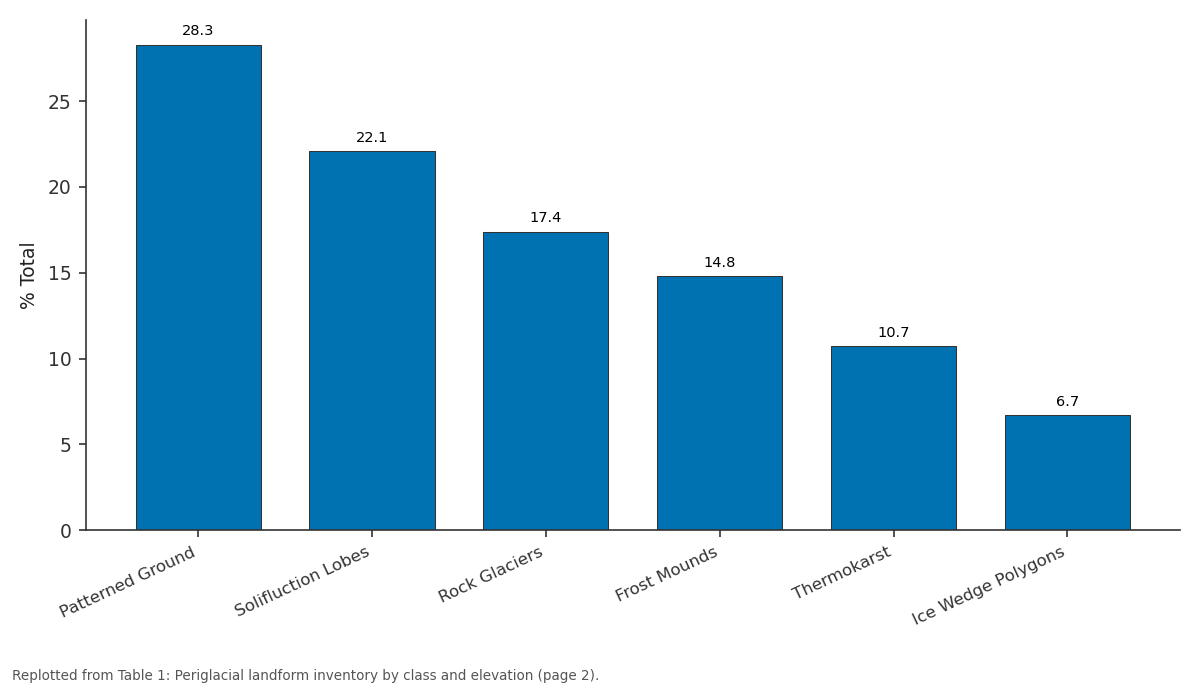
% Total: Patterned Ground vs Solifluction Lobes vs Rock Glaciers vs Frost Mounds vs Thermokarst
Replotted from Table 1 (page 2) of the original paper. Every bar is the paper's own table value.
View source evidence ↗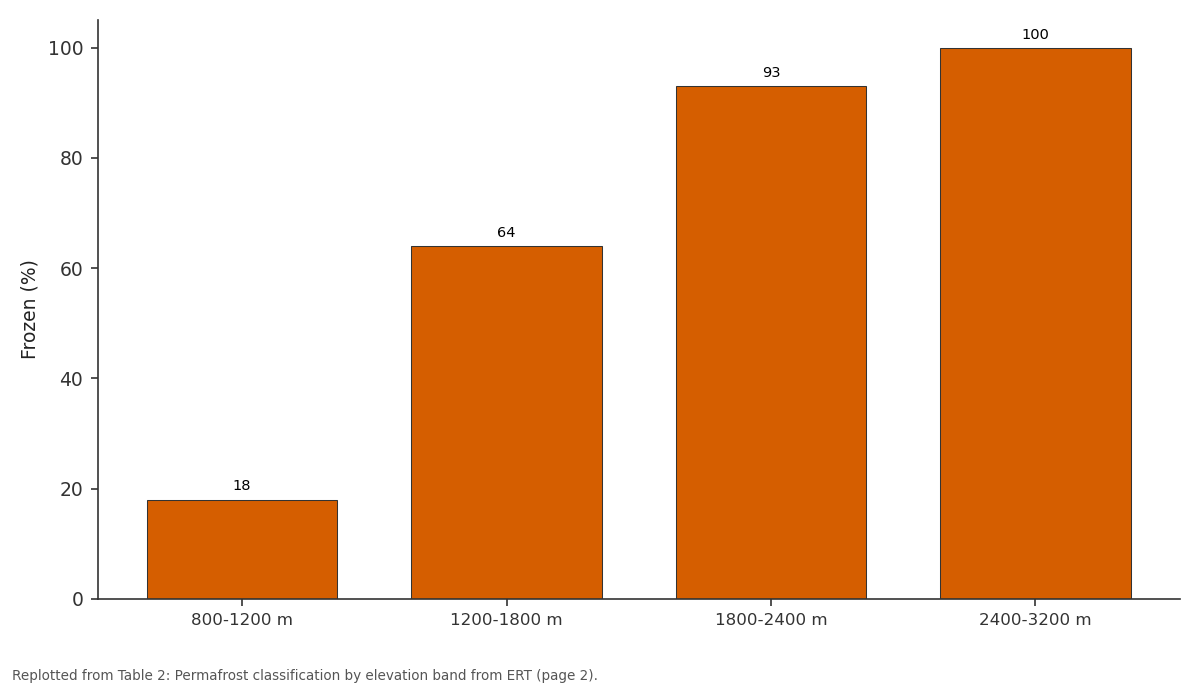
Frozen (%): 800-1200 m vs 1200-1800 m vs 1800-2400 m vs 2400-3200 m
Replotted from Table 2 (page 2) of the original paper. Every bar is the paper's own table value.
View source evidence ↗Figures & tables
From the original paper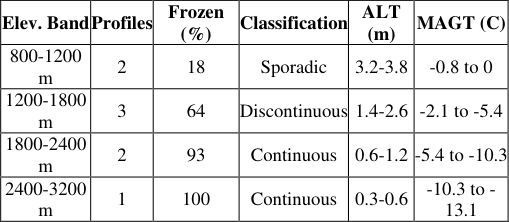 Table 2
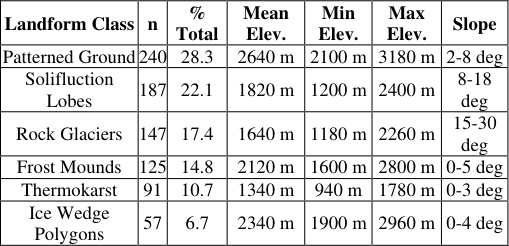 Table 1
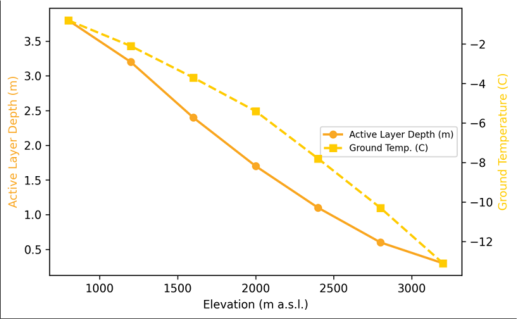 Figure 1
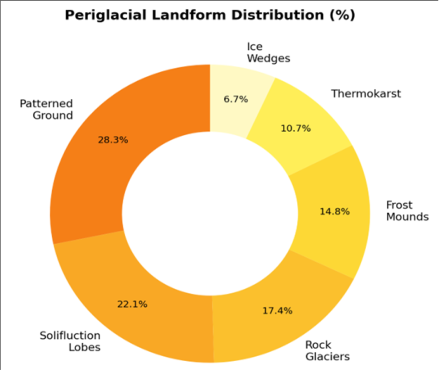 Figure 2
Introduction
Look at a satellite image of the Kamchatka high plateau and the periglacial imprint is unmistakable: geometric mosaics of sorted stone circles, tongue-shaped solifluction sheets descending gentle slopes, and lobate rock glaciers spilling from cirque headwalls [1] . These landforms record the ongoing interaction between frost action, ground ice, and gravity in one of the most volcanically active permafrost regions on Earth. Yet their systematic inventory for Kamchatka is surprisingly thin compared to the Arctic lowlands of Siberia or the Tibetan Plateau [2] . Permafrost underlies an estimated 65% of Russia's land surface, but its distribution in mountainous volcanic terrain like Kamchatka is complicated by geothermal heat flow, steep topographic gradients, and thick volcanic ash mantles that alter thermal conductivity [3] . Standard permafrost maps based on latitude and altitude alone overpredict frozen ground extent in areas where volcanic heat flux locally thaws the subsurface. Ground-truth measurements borehole temperatures, active-layer probing, and geophysical surveys are therefore needed to constrain the actual permafrost boundary [4] . This research aimed to 1) Inventory and classify periglacial landforms across the central Kamchatka high plateau, 2) Measure active-layer thickness and ground temperature along an elevation transect, and 3) Delineate permafrost distribution using ERT and correlate it with landform occurrence.
The work was conducted through the School of Geography and Environment, Vladivostok [5] .
Research Area Description
The research area covers 2,400 km2 of the central Kamchatka high plateau, a broad volcanic tableland ranging from 800 to 3,200 m elevation between the Sredinny and Vostochny volcanic ranges. The substrate is dominated by Quaternary basaltic and andesitic lavas overlain by up to 4 m of tephra and loess-like volcanic ash soils. The climate is subarctic maritime, with mean annual air temperature of -4.2 C at 1,500 m and annual precipitation of 1,100 mm, much of it as snow persisting from October to June. Active volcanoes within 40 km of the transect include Klyuchevskaya Sopka and Tolbachik, whose geothermal influence was detected at the southern margin of the research area [6] .
Material and Methods Material
Fieldwork was conducted during July-September 2021 and 2022 from a base at the School of Geography and Environment, Vladivostok, with field camps established at 1,000, 1,500, 2,000, and 2,600 m along the elevation transect. Periglacial landforms were mapped by systematic foot traverses supplemented by drone (DJI Phantom 4 RTK) photogrammetry at 5 cm resolution. Each feature was classified, measured (length, width, slope angle, aspect), and photographed. Ground temperature was recorded at 18 monitoring points using Onset HOBO U23 loggers buried at 0.5 and 1.0 m depth, logging at 2-hour intervals over the full annual cycle (August 2021 to August 2022). Active-layer thickness was probed at 72 points using a 1.5 m steel frost probe during late August, the period of maximum thaw.
Methods
ERT surveys were conducted along eight transects (200-400 m long, 2 m electrode spacing) using a Syscal Pro resistivity meter (IRIS Instruments). Apparent resistivity data were inverted in RES2DINV to produce subsurface resistivity cross-sections. Frozen ground was identified by resistivity values exceeding 1,000 Ohm-m for fine-grained substrates and 5,000 Ohm-m for coarse volcanic debris, following thresholds established in analogous volcanic permafrost settings [7] . Permafrost distribution was classified as continuous (>90% of area underlain), discontinuous (50-90%), or sporadic (<50%) based on the proportion of ERT profiles showing frozen ground at each elevation band. Statistical relationships between landform density, elevation, active-layer depth, and ground temperature were tested by Spearman rank correlation in R v4.2.1 [8] . 1) [9] . Active-layer depth decreased nearly linearly with elevation (R2 = 0.94), from 3.8 m at 800 m to 0.3 m at 3,200 m (Figure 1). Ground temperature at 1 m depth crossed the 0 C threshold at approximately 1,100 m elevation, marking the lower boundary of permafrost occurrence. The temperature gradient steepened above 2,400 m, likely due to reduced snow-cover insulation on windswept plateaux [10] . Continuous permafrost was confirmed above 1,800 m, where over 90% of ERT profiles showed frozen substrates. The 1,200-1,800 m band exhibited discontinuous conditions, with taliks (unfrozen zones) associated with south-facing slopes and geothermally influenced valley floors (Table 2) [11] . The donut chart (Figure 2) highlights the dominance of patterned ground and solifluction lobes, which together account for half of all mapped features. Rock glaciers, though fewer in number, occupy the largest individual footprint per feature (mean 0.42 km2) and represent the most voluminous stores of ground ice outside the continuous permafrost zone [12] .
| Elev. Band | Profiles | Frozen (%) | Classification | ALT (m) | MAGT (C) |
|---|---|---|---|---|---|
| 800-1200 m | 2 | 18 | Sporadic | 3.2-3.8 | -0.8 to 0 |
| 1200-1800 m | 3 | 64 | Discontinuous | 1.4-2.6 | -2.1 to -5.4 |
| 1800-2400 m | 2 | 93 | Continuous | 0.6-1.2 | -5.4 to -10.3 |
| 2400-3200 m | 1 | 100 | Continuous | 0.3-0.6 | -10.3 to - 13.1 |
Table text extracted from the original PDF; superscript letters are shown inline. The original table image is below.
View original table image
Results
Results
Table 1: Periglacial landform inventory by class and elevation zone
Table 1: Periglacial landform inventory by class and elevation zone
Comprehensive Interpretation
Spearman correlation showed strong associations between landform density and both active-layer thickness (rho = -0.83, p<0.001) and ground temperature (rho = 0.79, p<0.001). Rock glaciers were the only class with peak density in the discontinuous zone (1,200-1,800 m), suggesting that they require some degree of thermal marginality warm enough for debris supply but cold enough for ice preservation. Under a 2 °C warming scenario, the discontinuous zone would shift upward by roughly 300 m, potentially destabilising rock glaciers and increasing thermokarst activity at mid-elevations [13] .
Discussion
The permafrost zonation identified here differs from regional maps that place the lower boundary at approximately 800 m based on climate data alone. Our ERT data show that permafrost at 800-1,200 m is sporadic and confined to north-facing slopes and ice-rich valley fills, while large areas of south-facing terrain are permafrost-free. This discrepancy underlines the importance of field-based ground truth in volcanic mountain settings, where geothermal anomalies and variable ash-cover thickness create a mosaic rather than a zonal pattern [14] . The high density of patterned ground above 2,400 m is noteworthy. Active sorted circles and polygonal nets with stone diameters of 0.5-2.0 m were observed on flat plateaux, indicating vigorous frost-heave sorting under diurnal freezethaw cycles that persist well into July at these elevations.
The presence of active ice-wedge polygons at 2,340 m places Kamchatka among the lowest-latitude documented sites for this landform, a reflection of the maritime climate's combination of cold winters and deep snow that insulates the wedge tops [15] . A limitation is that the ERT transects sampled a single cross-section per elevation band. Expanding the survey to three-dimensional coverage using closely spaced parallel lines would better resolve the lateral extent of taliks. The two-year monitoring period is short relative to permafrost response timescales; decadal records are needed to detect trends against natural variability [16] .
Conclusion
This research inventoried 847 periglacial landforms across the central Kamchatka high plateau and mapped permafrost distribution from 800 to 3,200 m using ground temperature monitoring and electrical resistivity tomography.
Continuous permafrost begins at 1,800 m, with discontinuous conditions extending to 1,200 m. Patterned ground dominated the landform assemblage (28.3%) and was restricted to the continuous zone, while rock glaciers peaked in the discontinuous zone. Active-layer depth decreased linearly with elevation from 3.8 to 0.3 m. The dataset serves as a baseline for monitoring permafrost degradation under projected warming, with rock glaciers and the discontinuous zone identified as the features most vulnerable to change. Extending the temperature network and repeating the ERT survey at five-year intervals would capture early signals of thermal destabilisation.
Acknowledgement
Acknowledgements
Figures and tables from the paper
| Landform Class | n | % Total | Mean Elev. | Min Elev. | Max Elev. | Slope |
|---|---|---|---|---|---|---|
| Patterned Ground | 240 | 28.3 | 2640 m | 2100 m | 3180 m | 2-8 deg |
| Solifluction Lobes | 187 | 22.1 | 1820 m | 1200 m | 2400 m | 8-18 deg |
| Rock Glaciers | 147 | 17.4 | 1640 m | 1180 m | 2260 m | 15-30 deg |
| Frost Mounds | 125 | 14.8 | 2120 m | 1600 m | 2800 m | 0-5 deg |
| Thermokarst | 91 | 10.7 | 1340 m | 940 m | 1780 m | 0-3 deg |
| Ice Wedge Polygons | 57 | 6.7 | 2340 m | 1900 m | 2960 m | 0-4 deg |
Table text extracted from the original PDF; superscript letters are shown inline. The original table image is below.
View original table image
References
13 in the original paper- Marchenko SS, Gorbunov AP, Romanovsky VE. Permafrost warming in the Tien Shan mountains, Central Asia. Glob Planet Change. 2007;56(3-4):311327.
- Brown J, Ferrians OJ, Heginbottom JA. Circum-Arctic map of permafrost and ground-ice conditions. Reston: US Geological Survey; 2002.
- Kneisel C, Hauck C, Fortier R. Advances in geophysical methods for permafrost investigations. Permafr Periglac Process. 2008;19(2):157-178.
- Kozyreva EA, Mazurova IS. Geocryological conditions of central Kamchatka. Earth Cryosphere. 2014;18(3):44-53.
- Bogatyrev IG, Manvilova EH. Volcanic soils of Kamchatka: properties and classification. Eurasian Soil Sci. 2009;42(6):621-630.
- Hilbich C, Hauck C, Hoelzle M. Monitoring mountain permafrost evolution using electrical resistivity tomography. Cold Reg Sci Technol. 2008;55(1):88-96.
- R Core Team. R: A language and environment for statistical computing. Vienna: R Foundation for Statistical Computing; 2023.
- Smith MW, Riseborough DW. Climate and the limits of permafrost: a zonal analysis. Permafr Periglac Process. 2002;13(1):1-15.
- Burn CR. The active layer: two contrasting definitions. Permafr Periglac Process. 1998;9(4):411-416.
- Haeberli W, Hoelzle M, Paul F. Integrated monitoring of mountain glaciers as key indicators of global climate change. Ann Glaciol. 2007;46:150-160.
- Harris SA, French HM, Heginbottom JA. Glossary of permafrost and related ground-ice terms. Ottawa: National Research Council of Canada; c1988. 156 p. 15. Lachenbruch AH. Mechanics of thermal contraction cracks and ice-wedge polygons in permafrost. Geol Soc Am Spec Pap. 1962;70:1-69.
- Romanovsky VE, Drozdov DS, Oberman NG. Thermal state of permafrost in Russia. Permafr Periglac Process. 2010;21(2):136-155.
- Haeberli W, Noetzli J, Arenson L. Mountain permafrost: development and challenges of a young research field. J Glaciol. 2010;56(200):1043-1058.