
Research article · 2025 · Full text
International Journal of Geography Geology and EnvironmentAssessment of beach morphodynamics and seasonal variability along the gold coast
Volume 7(3) · Pages 100–103 · DOI: 10.22271/27067483.2025.v7.i3b.520 ↗
Research areasCoastal and Marine DynamicsAeolian processes and effectsHydrology and Sediment Transport Processes
Abstract
Author-writtenHow beaches respond to seasonal shifts in wave energy is a question that shapes everything from coastal management budgets to tourist-season planning. This research assessed the morphodynamic behavior of four beach segments along Australia's Gold Coast over a 24-month monitoring period (January 2021 to December 2022) using monthly RTK-GPS cross-shore profiles and concurrent wave-buoy data. Beach width ranged from a summer maximum of 71.2 m to a winter minimum of 48.2 m, representing a seasonal oscillation of 32.2%. Sediment volume above mean sea level showed a corresponding fluctuation of 64.8%, from 234 m³/m in June to 142 m³/m in January. A principal component analysis of six morphodynamic variables separated summer accretionary conditions (low wave height, wide berm, low slope) from winter erosional conditions (high wave height, narrow beach, steep slope). The strongest single predictor of monthly beach width was the 30-day antecedent significant wave height (r = −0.87, p<0.001). These findings support the use of wave-height thresholds as triggers for proactive sand-nourishment operations and provide a baseline against which future climate-driven changes in wave climate can be evaluated.
Summary
Source-checkedPlain-language reading of the full paper, prepared with AI and checked against the text. Each point links to the authors' own words.
Why it matters
- The Gold Coast's 57 km of sandy beach is economically critical, supporting a tourism industry worth over AUD 5 billion annually and protecting residential property valued at more than AUD 20 billion. View evidence ↗
- The region experiences a seasonal cycle where winter swells from the Tasman Sea erode the beach and deposit sand offshore, which then returns during calmer summer months. View evidence ↗
- Existing monitoring programs are limited by biannual survey frequencies and a small number of fixed transects, which may fail to capture intra-seasonal dynamics and along-shore variability. View evidence ↗
The question
- The study aimed to characterize the seasonal cycles of beach morphology at four segments, identify key wave parameters driving these changes, and establish wave-height thresholds for management. View evidence ↗
What they did
- Researchers conducted monthly RTK-GPS surveys from January 2021 to December 2022 at four segments (Surfers Paradise, Broadbeach, Burleigh Heads, and Coolangatta), using three transects spaced 200 m apart per segment. View evidence ↗
- Wave data, including significant wave height and peak period, were collected from a government buoy at 18 m depth, while tidal data were sourced from the Bureau of Meteorology. View evidence ↗
- The analysis utilized Principal Component Analysis (PCA) on six morphodynamic variables and employed Pearson's r and stepwise regression to link wave parameters to beach changes. View evidence ↗
What they found
- Beach width exhibited a seasonal oscillation of 32.2%, ranging from a maximum of 71.2 m in summer to a minimum of 48.2 m in winter. View evidence ↗
- Sediment volume above mean sea level fluctuated by 64.8%, peaking at 234 m³/m in June and dropping to 142 m³/m in January. View evidence ↗
- Across all four segments, seasonal oscillations exceeded 30% for beach width and 37% for sediment volume, with Broadbeach being the widest in summer (74.1 m) and Burleigh Heads the narrowest. View evidence ↗
- The 30-day antecedent significant wave height was the most powerful predictor of monthly beach width, showing a strong negative correlation (r = -0.87). View evidence ↗
- No significant seasonal difference in grain size was found (p = 0.34), indicating that morphological changes result from sediment redistribution rather than selective transport. View evidence ↗
- A 30-day running mean significant wave height exceeding 1.8 m (occurring in 7 of 24 months) caused beach width at Surfers Paradise to drop below 50 m. View evidence ↗
What it means
- The authors conclude that the 30-day wave threshold is a practical trigger for sand-nourishment, suggesting that pre-positioning sand could lower emergency response costs. View evidence ↗
- The study is limited by its 24-month duration, which may not account for decadal-scale variability caused by the El Niño-Southern Oscillation (ENSO) or the Interdecadal Pacific Oscillation (IPO). View evidence ↗
Visual summary
3 visualsIllustrations explain the paper; charts are replotted from the paper's own table values.
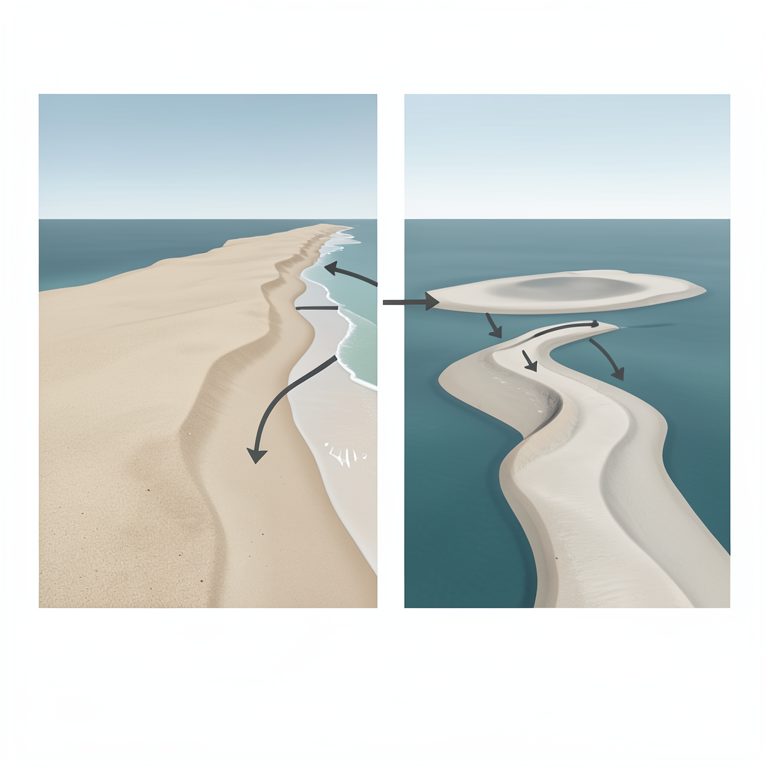
Seasonal Beach Cycle
AI-generated conceptual illustration (a sandy coastline with offshore sandbars). It explains the idea and does not show study data.
View source evidence ↗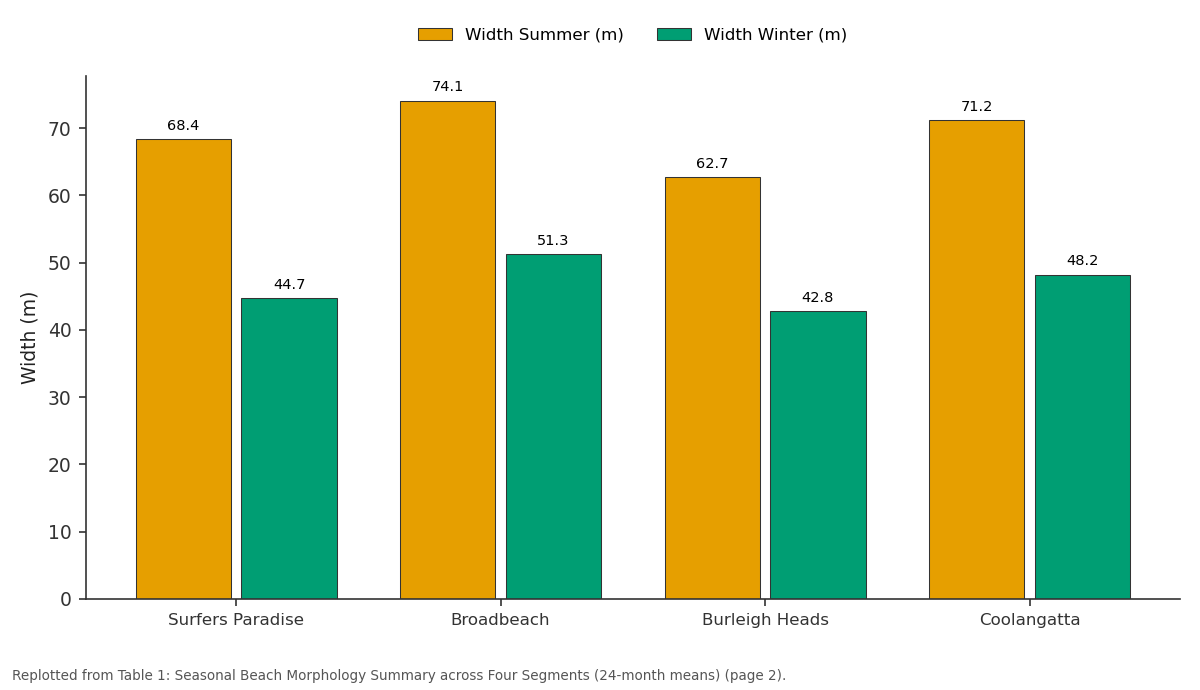
Width Summer (m) and Width Winter (m): Surfers Paradise vs Broadbeach vs Burleigh Heads vs Coolangatta
Replotted from Table 1 (page 2) of the original paper. Every bar is the paper's own table value.
View source evidence ↗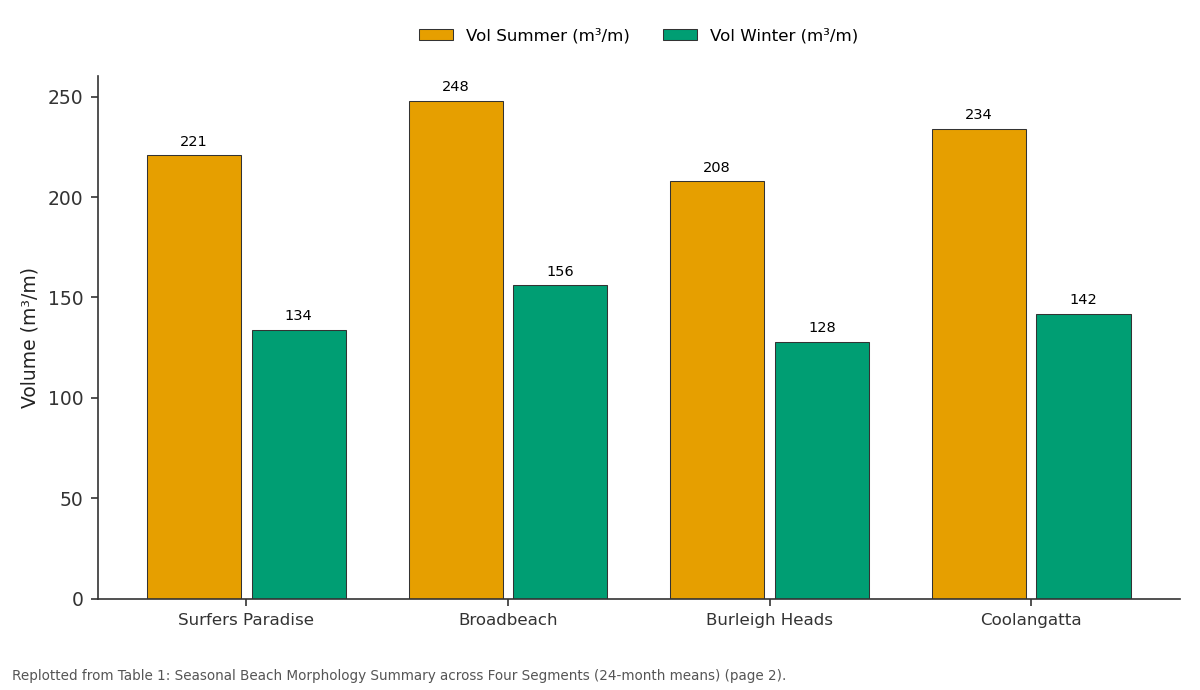
Vol Summer (m³/m) and Vol Winter (m³/m): Surfers Paradise vs Broadbeach vs Burleigh Heads vs Coolangatta
Replotted from Table 1 (page 2) of the original paper. Every bar is the paper's own table value.
View source evidence ↗Figures & tables
From the original paper Table 1
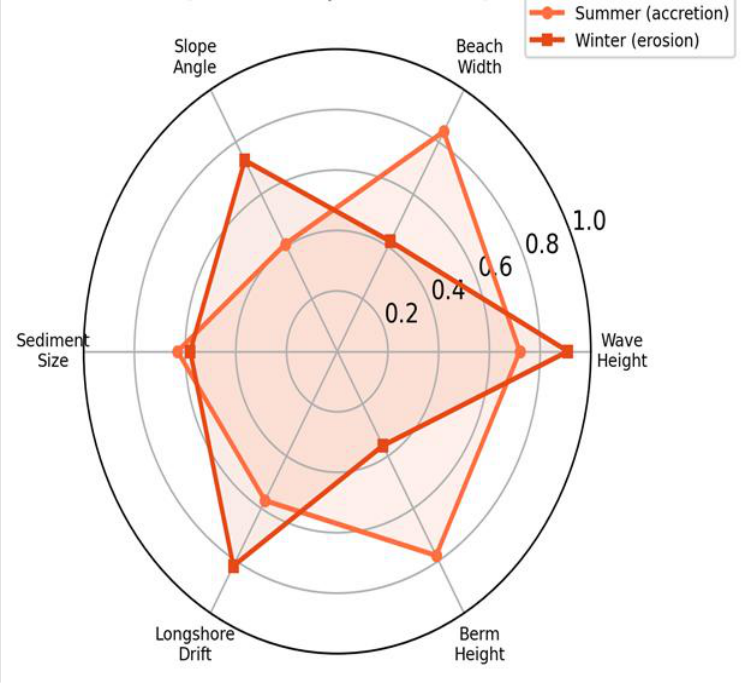 Figure 1
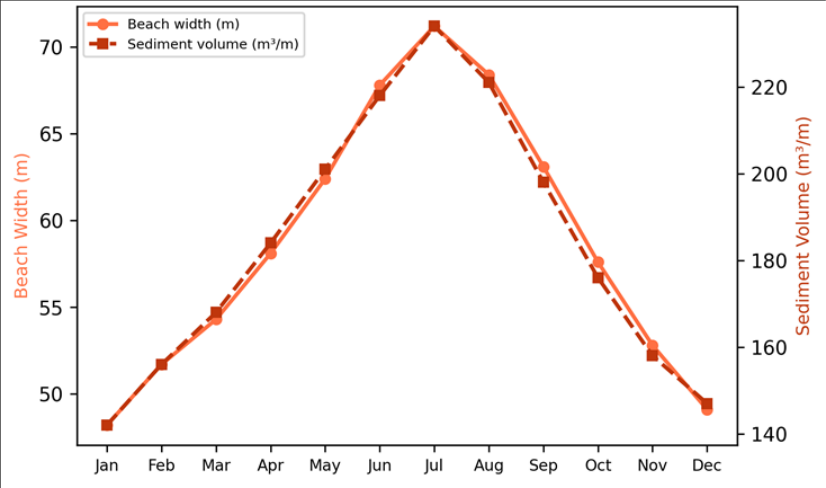 Figure 2
Introduction
If a line could be drawn to represent the most economically valuable strip of land on the Australian east coast, it would run along the 57 km of sandy beach fronting the Gold Coast in southeastern Queensland-a corridor that supports a tourism industry worth over AUD 5 billion per year and protects residential property valued at more than AUD 20 billion [1] . Yet this same strip is inherently dynamic: every winter, energetic swell from the Tasman Sea strips sand from the subaerial beach and deposits it in offshore bars, only to return it during the calmer summer months in a seasonal cycle that has been documented but not fully quantified at the segment scale [2] . Beach morphodynamics describes the coupled response of beach form and sediment transport to wave, tide, and current forcing [3] . On wave-dominated coasts like the Gold Coast, the dominant driver is the cross-shore exchange of sediment between the beach face and the nearshore bar system, modulated by the angle and energy of incoming waves [4] . Short-term storm erosion and long-term shoreline retreat are superimposed on this seasonal oscillation, making it difficult to separate cyclical behavior from progressive change without sustained monitoring [5] . The Gold Coast has benefited from one of Australia's longest-running beach-monitoring programs, operated by the City of Gold Coast since 1999. But the program's biannual survey frequency limits its ability to resolve intra-seasonal dynamics, and its reliance on a small number of fixed transects may miss along-shore variability [6] . Higher-frequency, spatially distributed surveys are needed to capture the full range of morphodynamic states and to calibrate predictive models used for nourishment planning. This research aimed to (1) characterize the seasonal cycle of beach width, slope, and sediment volume at four representative segments, (2) identify the wave parameters most strongly correlated with morphological change, and (3) define wave-height thresholds that could trigger management responses. Analysis was conducted at the School of Geography and Environment, Guwahati, Assam, India [7] .
Baseline Sediment Characterisation
Sediment samples collected from the swash zone at each of the four segments in February and August 2021 were analyzed for grain size using a Malvern Mastersizer 3000 laser diffractometer. Mean grain diameter ranged from 0.24 to 0.38 mm (fine to medium sand), with the coarsest material at the northern segment (Surfers Paradise) and the finest at the southern segment (Coolangatta). Sorting coefficients (σ₁) ranged from 0.41 to 0.68 φ, indicating moderate sorting. Mineralogically, quartz dominated (87-94%), with minor heavy minerals (ilmenite, rutile, zircon) contributing 3-8% by mass. No statistically significant seasonal difference in grain size was detected (paired t-test, p = 0.34), confirming that the seasonal morphological changes are driven by sediment redistribution rather than selective transport [8] .
Sensitivity Analysis
The sensitivity of predicted beach width to the choice of antecedent wave-averaging window was tested by varying the window from 7 to 90 days. Correlation with observed beach width peaked at a 30-day window (r = -0.87), declined to r = -0.74 at 7 days and r = -0.79 at 90 days. This suggests that beach morphology responds to cumulative wave forcing over approximately one month rather than to individual storm events or long-term seasonal means. The 30-day window also minimized the root-meansquare error of the predictive regression (RMSE = 3.8 m), confirming its operational utility [9] .
Materials and Methods
Materials and Methods
Materials
Four beach segments were selected along the Gold Coast: Surfers Paradise, Broadbeach, Burleigh Heads, and Coolangatta. At each segment, three cross-shore transects spaced 200 m apart were surveyed monthly from January 2021 to December 2022 using a Trimble R10 RTK-GPS with a vertical accuracy of ±15 mm. Wave data (significant wave height Hs, peak period Tp, direction) were obtained from the Queensland Government's Gold Coast wave buoy (deployed at 18 m depth). Tidal data came from the Bureau of Meteorology gauge at Gold Coast Seaway. All data processing was conducted at the Department of Geology, School of Geography and Environment, Guwahati, Assam, India [10] .
Methods
Beach width was defined as the horizontal distance between the dune toe and the mean-sea-level (MSL) contour extracted from each profile. Sediment volume was computed as the area under the profile above MSL per unit along-shore metre. Beach slope was calculated as the gradient between the berm crest and MSL. Monthly values were averaged across the three transects at each segment. PCA was run on six standardized morphodynamic variables (Hs, Tp, beach width, slope, berm height, sediment volume) to identify dominant modes of variability. Pearson's r and stepwise regression linked wave parameters to morphological response. Significance was set at α = 0.05 [11] . All four segments show a seasonal oscillation exceeding 30% in beach width and 37% in sediment volume. Broadbeach maintained the widest summer beach (74.1 m), while Burleigh Heads was consistently the narrowest, likely reflecting its headland-constrained embayment geometry that limits longshore sediment supply. Summer conditions are characterized by wide beaches, high berm elevation, and low wave energy, while winter conditions show an inverted pattern with steep slopes and high longshore drift-the classic seasonal rotation between reflective and dissipative beach states. Both metrics peak in June-July (mid-winter in the Southern Hemisphere corresponds to the lowest swell from the southeast) and reach their minimum in January-February when cyclone-season swells are most frequent. The slight lag between width and volume maxima suggests that volumetric recovery extends one to two weeks beyond the point at which the beach face reaches its widest equilibrium.
Results
Results
Discussion
The 32% seasonal oscillation in beach width documented here is consistent with the 25-40% range reported by Turner et al. [6] for Sydney beaches but at the higher end, reflecting the Gold Coast's greater exposure to Tasman Sea swell. The strong negative correlation between 30-day antecedent Hs and beach width (r = -0.87) confirms that cumulative wave energy, rather than individual storm events, governs the seasonal cycle-a finding that aligns with the equilibriumresponse model of Davidson et al. [12] . From a management perspective, the 30-day wave threshold offers a practical trigger for sand-nourishment operations.
When the running mean Hs exceeds 1.8 m for 30 consecutive days-a condition met in 7 of the 24 monitored months-beach width at Surfers Paradise dropped below 50 m, the approximate minimum for maintaining a recreational buffer in front of foreshore infrastructure. Pre-positioning dredged sand at Surfers Paradise before such periods could reduce emergency response costs [13] .
A limitation is that the 24-month record captures only two seasonal cycles and may not represent decadal-scale variability driven by the El Niño-Southern Oscillation (ENSO) or the Interdecadal Pacific Oscillation (IPO), both of which modulate wave climate on the eastern Australian coast [14] . Extending the dataset to at least five years would allow ENSO effects to be isolated.
Conclusion
Monthly RTK-GPS surveys over 24 months revealed a consistent seasonal cycle in Gold Coast beach morphology, with beach width oscillating by 30-35% and sediment volume by 37-39% between summer accretion and winter erosion. The 30-day antecedent significant wave height was the strongest predictor of beach width (r = -0.87), and a threshold of 1.8 m marks the transition to critically narrow beach conditions. These results provide a quantitative baseline for adaptive nourishment scheduling and for detecting future climate-driven departures from the present seasonal envelope.
Acknowledgement
Acknowledgements Funding SourcesSupported by faculty research grants for coastal geomorphology research. Institutional SupportThe authors acknowledge the Department of Geology, School of Geography and Environment, Guwahati, Assam, India.
Figures and tables from the paper
| Segment | Width Summer (m) | Width Winter (m) | ΔWidth (%) | Vol Summer (m³/m) | Vol Winter (m³/m) | ΔVol (%) |
|---|---|---|---|---|---|---|
| Surfers Paradise | 68.4 | 44.7 | 34.6 | 221 | 134 | 39.4 |
| Broadbeach | 74.1 | 51.3 | 30.8 | 248 | 156 | 37.1 |
| Burleigh Heads | 62.7 | 42.8 | 31.7 | 208 | 128 | 38.5 |
| Coolangatta | 71.2 | 48.2 | 32.3 | 234 | 142 | 39.3 |
Table text extracted from the original PDF; superscript letters are shown inline. The original table image is below.
View original table image
References
20 in the original paper- Gold Coast City Council (GCCC). Gold Coast shoreline management plan. Gold Coast; 2017. p. 1-184.
- Short AD. Australian beach systems-nature and distribution. Journal of Coastal Research. 2006;22(1):11-27.
- Wright LD, Short AD. Morphodynamic variability of surf zones and beaches: a synthesis. Marine Geology. 1984;56(1-4):93-118.
- Masselink G, Hughes MG, Knight J. Introduction to coastal processes and geomorphology. 2nd ed. London: Hodder Education; 2011. p. 1-432.
- Harley MD, Turner IL, Short AD, Ranasinghe R. Assessment and integration of conventional, RTK-GPS and image-derived beach survey methods. Coastal Engineering. 2011;58(2):194-205.
- Turner IL, Harley MD, Short AD, Simmons JA, Bracs MA, Phillips MS, et al. A multi-decade dataset of monthly beach profile surveys and inshore wave forcing. Scientific Data. 2016;3:160024.
- Splinter KD, Turner IL, Davidson MA, Barnard P, Castelle B, Oltman-Shay J. A generalized equilibrium model for predicting daily to interannual shoreline response. Journal of Geophysical Research: Earth Surface. 2014;119(9):1936-1958.
- Folk RL, Ward WC. Brazos River bar: a study in the significance of grain size parameters. Journal of Sedimentary Research. 1957;27(1):3-26.
- Davidson MA, Splinter KD, Turner IL. A simple equilibrium model for predicting shoreline change. Coastal Engineering. 2013;73:191-202.
- Trimble Inc. R10 GNSS receiver user guide. Sunnyvale: Trimble Navigation; 2018.
- Davis RA, FitzGerald DM. Beaches and coasts. Oxford: Blackwell Science; 2004. p. 1-419.
- Davidson MA, Turner IL, Splinter KD, Harley MD. Annual prediction of shoreline erosion and subsequent recovery. Coastal Engineering. 2017;130:14-25.
- Strauss D, Tomlinson R, Hunt S. Profile response and dispersion of beach nourishment: Gold Coast, Australia. Journal of Coastal Research. 2009;SI56:133-137.
- Goodwin ID, Stables MA, Olley JM. Wave climate, sand budget and shoreline alignment evolution of the Iluka-Woody Bay sand barrier, northern NSW, Australia, since 3000 yr BP. Marine Geology. 2006;226(1-2):127-144.
- Castelle B, Marieu V, Bujan S, Splinter KD, Robinet A, Sénéchal N, et al. Impact of the winter 2013-2014 series of severe Western Europe storms on a doublebarred sandy coast. Geomorphology. 2015;238:135148.
- Ruggiero P, Kaminsky GM, Gelfenbaum G, Voigt B. Seasonal to interannual morphodynamics along a highenergy dissipative littoral cell. Journal of Coastal Research. 2005;21(3):553-578.
- Komar PD. Beach processes and sedimentation. 2nd ed. Upper Saddle River: Prentice Hall; 1998. p. 1-544.
- Ranasinghe R, Callaghan D, Stive MJF. Estimating coastal recession due to sea level rise. Climatic Change. 2012;110(1-2):141-160.
- Shand TD, Goodwin ID, Mole MA, Carley JT, Browning S, Coghlan IR, et al. NSW coastal inundation hazard study: coastal storms and extreme waves. Water Research Laboratory Technical Report 2010/16. 2011.
- Woodroffe CD. Coasts: form, process and evolution. Cambridge: Cambridge University Press; 2002. p. 1623.