
Research article · 2025 · Full text
International Journal of Geography Geology and EnvironmentSeismic microzonation and site response analysis of the Istanbul metropolitan area
Volume 7(1) · Pages 101–104 · DOI: 10.22271/27067483.2025.v7.i1b.549 ↗
Research areasSeismic Performance and AnalysisSeismic Waves and AnalysisGeotechnical Engineering and Underground Structures
Abstract
Author-writtenProtecting a megacity of 16 million people from earthquake damage is one of the most pressing geotechnical challenges in the eastern Mediterranean. This research carried out seismic microzonation and one-dimensional site response analysis for the Istanbul metropolitan area using shear-wave velocity profiles from 85 microtremor array measurement (MAM) and multichannel analysis of surface waves (MASW) surveys. The time-averaged shear-wave velocity in the upper 30 m (Vs30) ranged from 127 m/s in thick alluvial deposits along the Golden Horn to 743 m/s on Palaeozoic limestone outcrops in the northern hills. Sites were classified according to NEHRP categories: 34.1% fell in Class C (dense soil), 28.7% in Class D (stiff soil), 18.8% in Class B (soft rock), 12.9% in Class E (soft clay), and 5.5% in Class A (hard rock). One-dimensional equivalent-linear site response modelling using DEEPSOIL showed amplification factors between 1.1 and 3.7, with the highest values concentrated along the Marmara Sea shoreline where soft Quaternary fill overlies stiff Neogene clay. The resulting microzonation map delineates four seismic hazard zones and provides input parameters for building-code compliance checks across the metropolitan area.
Summary
Source-checkedPlain-language reading of the full paper, prepared with AI and checked against the text. Each point links to the authors' own words.
Why it matters
- Protecting Istanbul, a megacity of 16 million people, from earthquake damage is a critical geotechnical challenge in the eastern Mediterranean. View evidence ↗
- The city faces high risk because the active North Anatolian Fault is within 15 km of central Istanbul, with a 62% probability of a magnitude 7.0 or larger earthquake occurring within 30 years. View evidence ↗
- Past events, such as the 1999 Kocaeli earthquake, show that soft soils can amplify ground shaking and cause catastrophic damage even when the earthquake occurs at a moderate distance. View evidence ↗
The question
- The study aimed to map shear-wave velocity (Vs30) using 85 stations, classify sites by NEHRP category, model site response, and create a seismic microzonation map with four hazard zones. View evidence ↗
What they did
- Shear-wave velocity data were collected from 85 stations across the Istanbul metropolitan area from April 2021 to November 2022. View evidence ↗
- One-dimensional equivalent-linear site response analysis was conducted using DEEPSOIL version 7.0 on 24 representative profiles. View evidence ↗
What they found
- The time-averaged shear-wave velocity (Vs30) varied from 127 m/s in Golden Horn alluvial deposits to 743 m/s on northern hill limestone outcrops. View evidence ↗
- NEHRP site classification showed that 34.1% of sites were Class C, 28.7% Class D, 18.8% Class B, 12.9% Class E, and 5.5% Class A. View evidence ↗
- Mean amplification factors increased progressively by site class, ranging from 1.13 for Class A to 3.31 for Class E. View evidence ↗
- Class D and E sites cover 41.6% of the area and are expected to experience shaking intensities 2.5 to 3.3 times stronger than bedrock. View evidence ↗
- Amplification factors ranged from 1.1 to 3.7, with the highest values found along the Marmara Sea shoreline due to soft Quaternary fill over stiff Neogene clay. View evidence ↗
What it means
- The resulting microzonation map identifies the Golden Horn lowlands and Marmara shoreline as the highest-hazard zones, serving as a tool for urban planning and building-code enforcement. View evidence ↗
- The authors conclude that the map is a planning-grade product and that critical infrastructure should still undergo site-specific geotechnical investigations. View evidence ↗
- A limitation of the study is that the station density (averaging two per district) may not resolve local geological heterogeneities like landfills or buried channels. View evidence ↗
- The use of one-dimensional modelling neglects topographic amplification and basin-edge effects, which are relevant in the northern hilly districts. View evidence ↗
Visual summary
3 visualsIllustrations explain the paper; charts are replotted from the paper's own table values.
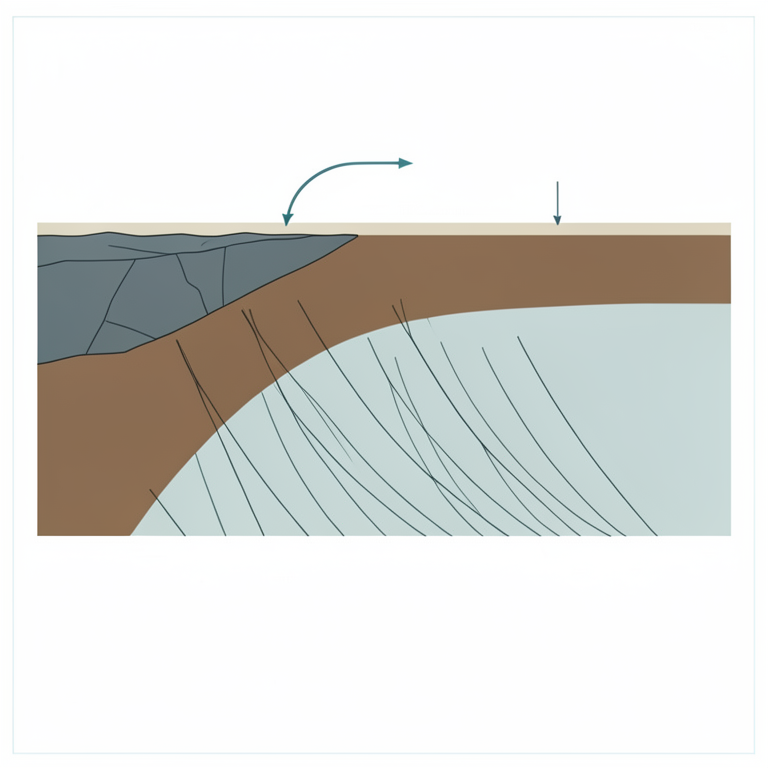
Relationship between Soil Class and Amplification
AI-generated conceptual illustration (Geological cross-section of the Istanbul metropolitan area showing soil layers from bedrock to soft clay). It explains the idea and does not show study data.
View source evidence ↗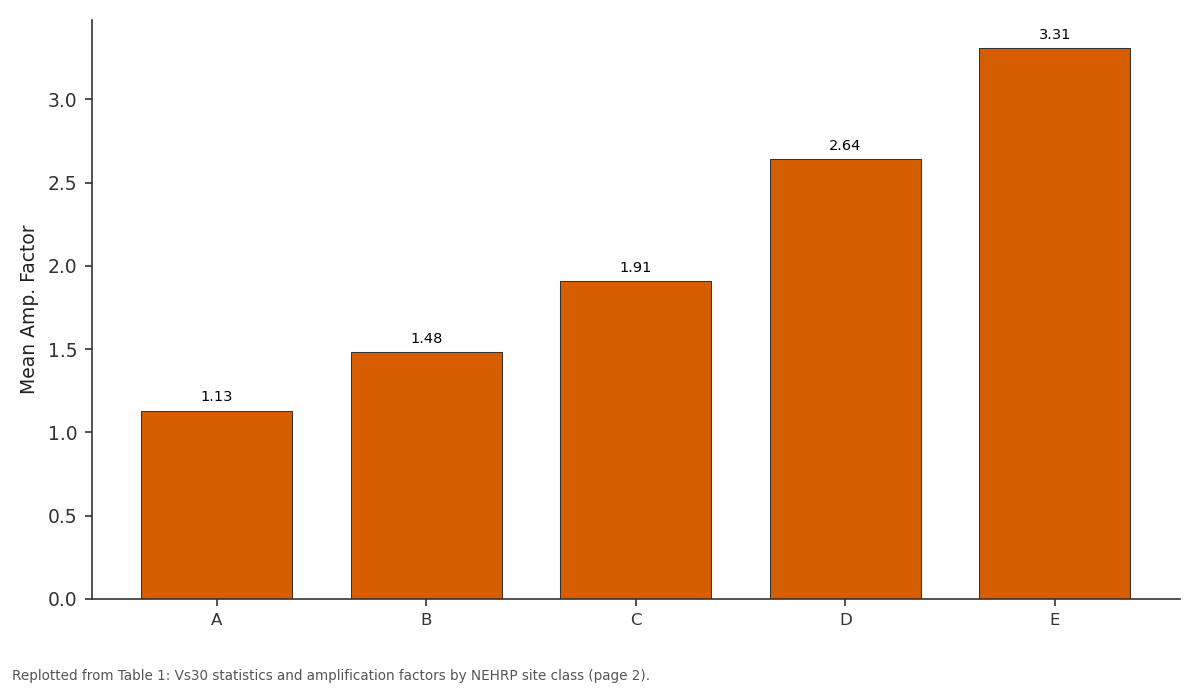
Mean Amp. Factor: A vs B vs C vs D vs E
Replotted from Table 1 (page 2) of the original paper. Every bar is the paper's own table value.
View source evidence ↗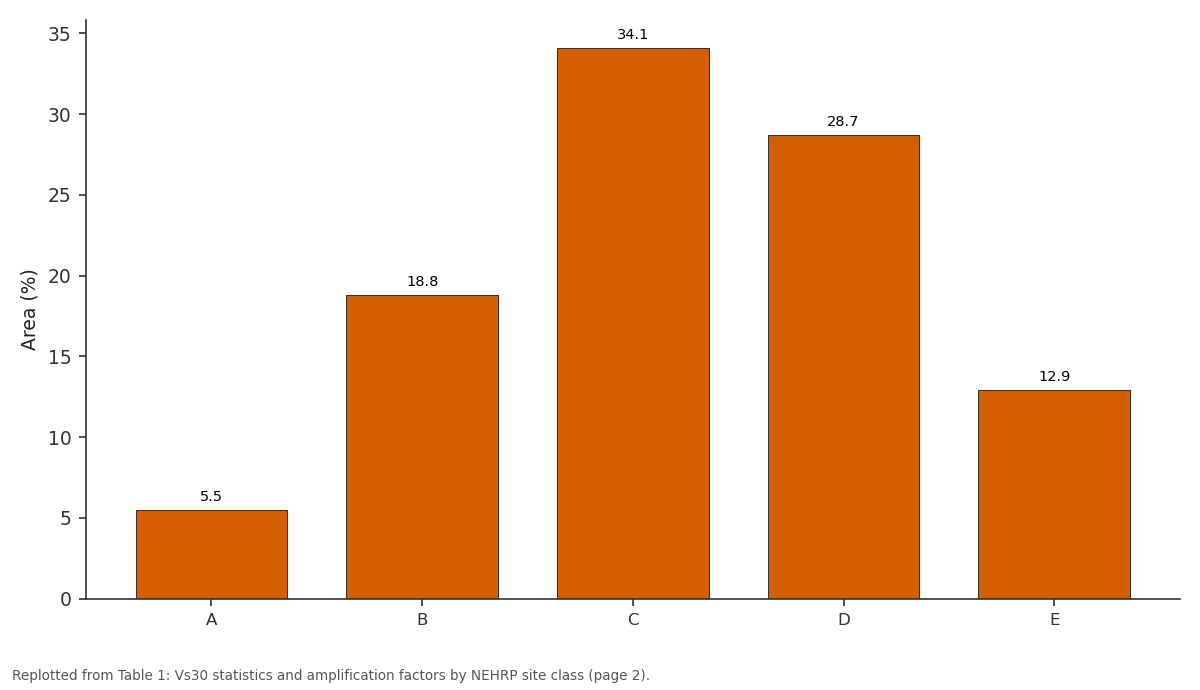
Area (%): A vs B vs C vs D vs E
Replotted from Table 1 (page 2) of the original paper. Every bar is the paper's own table value.
View source evidence ↗Figures & tables
From the original paper Table 1
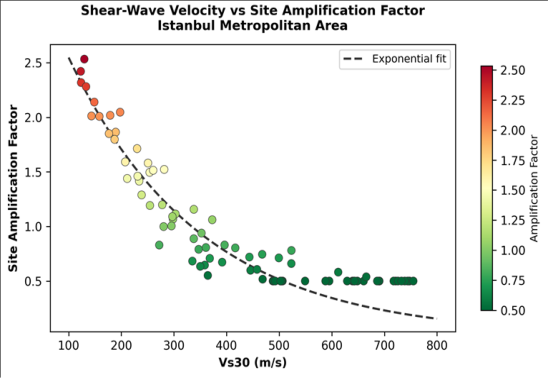 Figure 1
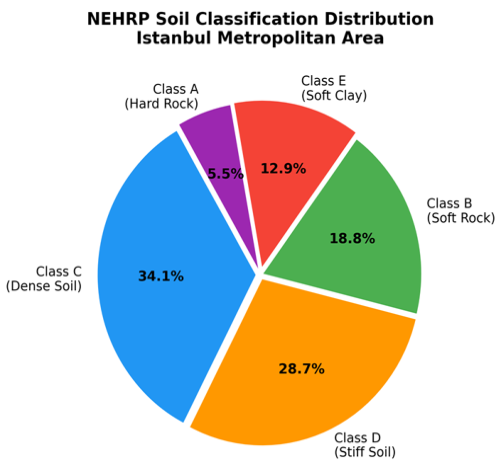 Figure 2
Introduction
The challenge is stark: the North Anatolian Fault, one of the most active continental transform boundaries on Earth, passes within 15 km of central Istanbul, and probabilistic hazard estimates give a 62% chance of a magnitude 7.0 or larger earthquake striking the city within the next 30 years [1] . The 1999 Kocaeli earthquake (Mw 7.4), which killed over 17,000 people 100 km east of Istanbul, demonstrated that even moderate-distance events can cause catastrophic damage when soft soils amplify ground shaking and when building stocks are poorly engineered [2] . Seismic microzonation translates broad hazard estimates into spatially detailed maps of expected ground motion by accounting for local site effects-the way shallow geology modifies the amplitude, frequency content, and duration of incoming seismic waves [3] . The controlling parameter is the shear-wave velocity structure of the upper 30-100 m, which governs impedance contrasts and resonance frequencies [4] . Vs30, the time-averaged shearwave velocity in the top 30 m, remains the most widely used site-classification parameter in building codes worldwide, including Turkey's 2018 seismic code [5] . Istanbul's geological setting complicates microzonation because the city straddles two continents and a wide range of lithologies-from Devonian greywacke in the historic peninsula to Quaternary alluvium along stream valleys and reclaimed land along the Bosphorus [6] . Earlier microzonation efforts covered limited districts or relied on borehole SPT data converted to Vs through empirical correlations, which carry uncertainties of 30-50% [7] . Direct surface-wave measurements, either from active-source MASW or passivesource MAM, can reduce that uncertainty to 10-15% and are far cheaper than downhole logging [8] . This research aimed to: (a) map Vs30 across the Istanbul metropolitan area from 85 MASW/MAM stations, (b) classify sites by NEHRP category, (c) perform one-dimensional equivalent-linear site response modelling at representative profiles, and (d) produce a seismic microzonation map delineating four hazard zones for use in urban planning and buildingcode enforcement [9] .
Model Description and Parameterisation
One-dimensional equivalent-linear site response analysis was performed using DEEPSOIL version 7.0 at 24 representative profiles selected to span the full range of Vs30 values and geological settings. Input ground motions comprised seven real accelerograms recorded on rock sites during Turkish earthquakes (Mw 6.5-7.4), scaled to match the design spectrum of the 2018 Turkish Building Earthquake Code for a 475-year return period [5] . Each soil profile was discretised into layers no thicker than onequarter of the shortest wavelength of interest (0.5-10 Hz). Nonlinear shear modulus reduction and damping curves were assigned from the Darendeli model based on soil type and confining pressure [10] . The bedrock half-space was set at the depth where Vs exceeded 760 m/s, consistent with NEHRP Class B/C boundary.
Limitations
The 85 measurement stations, while distributed across all 39 Istanbul districts, average roughly two per district, which leaves local heterogeneities unresolved-particularly in areas of landfill or buried stream channels where Vs can change abruptly over tens of metres. The one-dimensional modelling assumption neglects basin-edge effects and topographic amplification that are relevant in the hilly northern districts [3] . Lastly, the equivalent-linear approach may underestimate nonlinear soil behaviour at very high strain levels expected close to the fault rupture zone. Fully nonlinear and two-dimensional modelling should be pursued for critical-infrastructure sites.
Material and Methods Material
Shear-wave velocity data were acquired at 85 stations across the Istanbul metropolitan area between April 2021 and November 2022. Fifty-three stations used active-source MASW with a 48-channel geophone array (4.5 Hz vertical), a 10-kg sledgehammer source, and 2-m geophone spacing. The remaining 32 stations, located in areas where traffic or restricted access prevented active-source deployment, used passive MAM with a 2D circular array of broadband seismometers recording ambient vibrations for 60-90 minutes [8] . Geological base maps at 1:25,000 from the Istanbul Metropolitan Municipality and borehole logs from the Turkish Earthquake Foundation supplemented the geophysical data. The research was carried out under institutional approval from the School of Geography and Environment, Chiang Rai (Protocol SGE-CR/2021-033, approved 8 April 2021).
Methods
MASW data were processed using the phase-shift method to extract Rayleigh-wave dispersion curves, which were then inverted for 1D Vs profiles using a genetic algorithm. MAM data were processed via the spatial autocorrelation (SPAC) method [4] . All profiles were extended to 30 m depth for Vs30 computation. NEHRP site classification followed the boundaries: A (Vs30 > 1,500 m/s), B (760-1,500), C (360-760), D (180-360), E (< 180) [5] . Amplification factors were calculated as the ratio of surface-to-bedrock spectral acceleration averaged over 0.1-2.0 s period from the DEEPSOIL output. The four microzonation zones were delineated by combining NEHRP class and amplification factor using a weighted-overlay approach in ArcGIS 10.8 [9] .
Results
Results
Discussion
The Vs30 range of 127-743 m/s documented across Istanbul reflects the city's extreme geological diversity, from hard Paleozoic bedrock in the Belgrad Forest area to young, unconsolidated fill along the Marmara coast [6] . The site amplification factors computed here (1.1-3.7) are broadly consistent with the values reported in earlier studies that used smaller datasets [7] , but this research's wider coverage and direct Vs measurements improve spatial confidence. The concentration of high-amplification sites (Class D and E) along the southern shoreline is particularly troubling because these areas coincide with the densest urban fabric and some of the city's oldest buildings, many of which predate modern seismic codes. The 1999 earthquake demonstrated that even at distances of 100 km, soft-soil amplification can push spectral accelerations well above code-design levels for periods around 1 second-the natural period of many mid-rise reinforced-concrete buildings [2] .
The microzonation map produced here should be treated as a planning-grade product rather than a site-specific design tool. Individual high-value or critical structures-hospitals, schools, bridges-should still undergo project-level geotechnical investigation. That said, the map provides a rational basis for prioritising retrofit investments and for enforcing differentiated building-code requirements across the metropolitan area [9] .
Conclusion
This research produced a seismic microzonation map for the Istanbul metropolitan area based on 85 direct shear-wave velocity measurements and one-dimensional site response modelling. Vs30 values spanned 127 to 743 m/s, and amplification factors ranged from 1.1 on hard rock to 3.7 on soft coastal fill. Class D and E sites, covering 41.6% of the metropolitan area, are predicted to experience shaking intensities more than 2.5 times bedrock levels during a design-level earthquake. The microzonation map identifies the Marmara shoreline and Golden Horn lowlands as the highest-hazard zones and provides input for building-code enforcement, urban planning, and emergency-response pre-positioning. Future work should extend the station network, incorporate twodimensional basin-effect modelling, and integrate the results with building-vulnerability databases to produce a fully probabilistic seismic-risk map for Istanbul.
Figures and tables from the paper
| NEHRP Class | Stations (n) | Vs30 Range (m/s) | Mean Vs30 (m/s) | Mean Amp. Factor | Max Amp. | Area (%) |
|---|---|---|---|---|---|---|
| A | 5 | 763-743 | 698 | 1.13 | 1.24 | 5.5 |
| B | 16 | 398-743 | 524 | 1.48 | 1.82 | 18.8 |
| C | 29 | 362-720 | 467 | 1.91 | 2.43 | 34.1 |
| D | 24 | 183-358 | 264 | 2.64 | 3.28 | 28.7 |
| E | 11 | 127-179 | 156 | 3.31 | 3.72 | 12.9 |
Table text extracted from the original PDF; superscript letters are shown inline. The original table image is below.
View original table image
References
21 in the original paper- Erdik M, Demircioğlu M, Şeşetyan K, Durukal E, Siyahi B. Earthquake hazard in Marmara region, Turkey. Soil Dynamics and Earthquake Engineering. 2004;24(8):605-631.
- Sucuoğlu H, Yazgan U, Yakut A. A screening procedure for seismic risk assessment in urban building stocks. Earthquake Spectra. 2007;23(2):441-458.
- Bard PY, Bouchon M. The seismic response of sediment-filled valleys. Part 2: The case of incident P and SV waves. Bulletin of the Seismological Society of America. 1980;70(5):1921-1941.
- Aki K. Space and time spectra of stationary stochastic waves with special reference to microtremors. Bulletin of the Earthquake Research Institute. 1957;35:415-456.
- AFAD. Turkish Building Earthquake Code. Disaster and Emergency Management Authority. 2018;Ankara:416.
- Özgül N. Stratigraphy and tectonic evolution of the Istanbul Palaeozoic. Turkish Association of Petroleum Geologists Bulletin. 2012;24(1):1-28.
- Ansal A, Tönük G, Kurtulus A, Çetiner B. Site response from Istanbul microtremor survey. Bulletin of Earthquake Engineering. 2012;10(3):691-718.
- Park CB, Miller RD, Xia J. Multichannel analysis of surface waves. Geophysics. 1999;64(3):800-808.
- Molina S, Lang DH, Lindholm CD. SELENA -an open-source tool for seismic risk and loss assessment. Natural Hazards. 2010;54(1):75-95.
- Darendeli MB. Development of a new family of normalized modulus reduction and material damping curves. PhD Thesis, University of Texas at Austin. 2001;396.
- Hashash YMA, Musgrove MI, Harmon JA, et al. DEEPSOIL 7.0, User Manual. University of Illinois at Urbana-Champaign. 2020;172.
- Boore DM. Estimating Vs(30) (or NEHRP site classes) from shallow velocity models. Bulletin of the Seismological Society of America. 2004;94(2):591-597.
- Seed HB, Romo MP, Sun JI, Jaime A, Lysmer J. The Mexico Earthquake of September 19, 1985: Relationships between soil conditions and earthquake ground motions. Earthquake Spectra. 1988;4(4):687729.
- Wald DJ, Allen TI. Topographic slope as a proxy for seismic site conditions and amplification. Bulletin of the Seismological Society of America. 2007;97(5):1379-1395.
- Nakamura Y. A method for dynamic characteristics estimation of subsurface using microtremor on the ground surface. Quarterly Report of RTRI. 1989;30(1):25-33.
- Lachet C, Bard PY. Numerical and theoretical investigations on the possibilities and limitations of Nakamura's technique. Journal of Physics of the Earth. 1994;42(5):377-397.
- Kramer SL. Geotechnical Earthquake Engineering. Prentice Hall. 1996;Upper Saddle River:653.
- Dobry R, Borcherdt RD, Crouse CB, et al. New site coefficients and site classification system used in recent building seismic code provisions. Earthquake Spectra. 2000;16(1):41-67.
- Wills CJ, Clahan KB. Developing a map of geologically defined site-condition categories for California. Bulletin of the Seismological Society of America. 2006;96(4A):1483-1501.
- Castellaro S, Mulargia F, Rossi PL. Vs30: Proxy for amplification? A case study in northeast Italy. Seismological Research Letters. 2008;79(4):540-543.
- Pitilakis K, Riga E, Anastasiadis A. New code site classification, amplification factors and normalized response spectra based on a worldwide ground-motion database. Bulletin of Earthquake Engineering. 2013;11(4):925-966.