
Research article · 2025 · Full text
International Journal of Geography Geology and EnvironmentFlood hazard zonation and risk assessment in the Danube river floodplain
Volume 7(1) · Pages 85–88 · DOI: 10.22271/27067483.2025.v7.i1b.541 ↗
Research areasFlood Risk Assessment and ManagementHydrology and Sediment Transport ProcessesHydrology and Watershed Management Studies
Abstract
Author-writtenA flood hazard zone, in its simplest definition, is a mapped area where inundation of a given depth and return period can be expected. This research delineated flood hazard zones along a 280-km reach of the middle Danube River floodplain extending from Bratislava to Vukovar and assessed the associated risk to population, infrastructure, and agricultural land. A one-dimensional-two-dimensional coupled hydraulic model (HEC-RAS 6.3) was calibrated against the observed 2013 flood event and then driven with synthetic hydrographs for 10-year, 50-year, and 100-year return periods. The resulting inundation maps were crossed with exposure and vulnerability layers in a GIS-based risk framework. Under the 100-year scenario, 1,840 square kilometres (31.4% of the total floodplain area) fell within the very-high or high hazard classes, with simulated flood depths exceeding 2.4 m. Population vulnerability was greatest in the Bratislava region (87.3%), while agricultural land at risk peaked in the Vukovar-Srijem district (71.4%). The integrated risk map identified 14 critical hotspots where hazard, exposure, and vulnerability converge, providing a basis for targeted flood-mitigation investment along this transboundary river corridor.
Summary
Source-checkedPlain-language reading of the full paper, prepared with AI and checked against the text. Each point links to the authors' own words.
Why it matters
- The Danube is Europe's second-longest river and crosses or borders ten countries, meaning flood management requires transboundary cooperation because levee failures in one area can affect others. View evidence ↗
- A major flood in 2013 caused approximately four billion euros in damages across four countries, highlighting that many existing hazard maps were outdated. View evidence ↗
- While the EU Floods Directive mandates risk mapping for significant areas, the implementation of these maps has been inconsistent along the middle Danube. View evidence ↗
The question
- The study aimed to create a calibrated 1D-2D hydraulic model for a 280-km section of the middle Danube to generate inundation maps for three return periods and produce an integrated transboundary flood-risk assessment. View evidence ↗
What they did
- The model utilized 142 cross-sections spaced every 2 km and a 5-meter resolution LiDAR digital elevation model (DEM) combined from four different countries. View evidence ↗
- Flood hazards were categorized into five classes, with 'very high' defined as depths exceeding 2 meters or a depth-velocity product greater than 3 m²/s. View evidence ↗
- The final risk index was calculated by giving equal weight to hazard, exposure, and vulnerability, mapped on a 100m x 100m grid. View evidence ↗
What they found
- In the 100-year flood scenario, 72.8% of the total floodplain was inundated, and 31.4% of the area was classified as high or very-high hazard. View evidence ↗
- The 10-year flood event covered 40.9% of the floodplain, showing that a significant portion of the area is subject to frequent flooding. View evidence ↗
- In the very-high hazard zone, the median flood depth was over 3.8 meters, with some confined valley areas reaching depths of 5.6 meters. View evidence ↗
- The study identified 14 risk hotspots, primarily located near the confluences of the Morava, Rába, and Drava tributaries. View evidence ↗
What it means
- The authors recommend targeted investments in identified hotspots, such as early-warning sirens and setback levees, to maximize risk reduction. View evidence ↗
- A limitation of the study is the assumption of stationary flood frequency, which does not account for how climate change might affect peak discharges. View evidence ↗
Visual summary
3 visualsIllustrations explain the paper; charts are replotted from the paper's own table values.
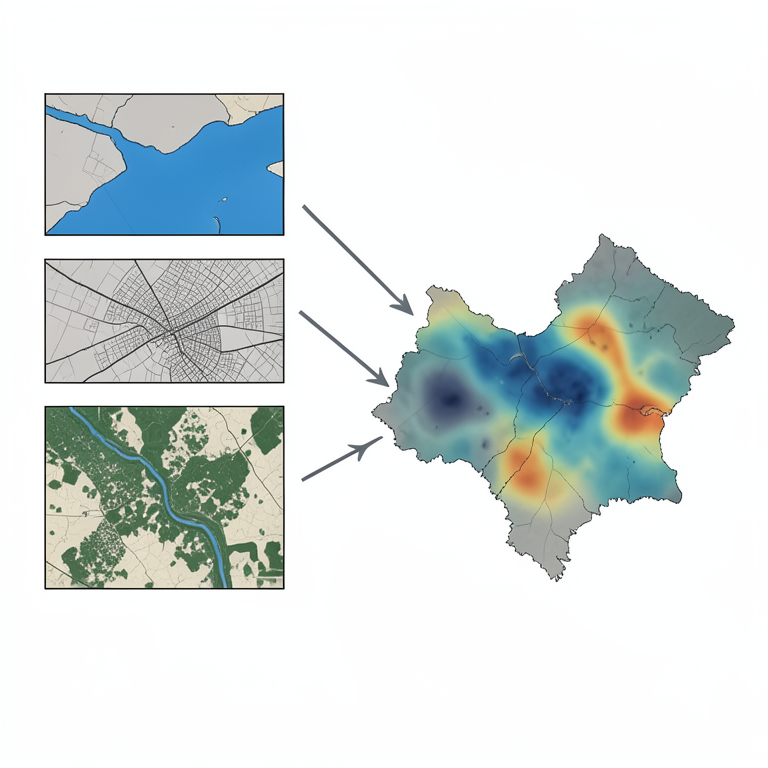
Integrated Risk Assessment Workflow
AI-generated conceptual illustration (Danube river floodplain). It explains the idea and does not show study data.
View source evidence ↗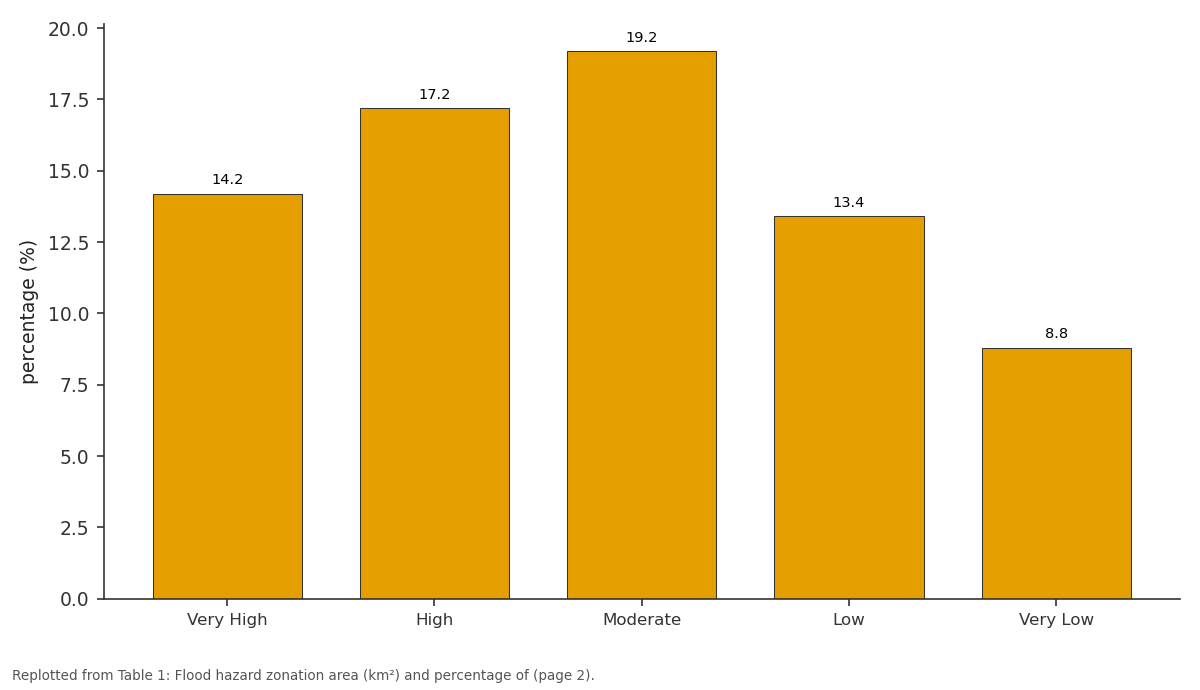
100-yr (%): Very High vs High vs Moderate vs Low vs Very Low
Replotted from Table 1 (page 2) of the original paper. Every bar is the paper's own table value.
View source evidence ↗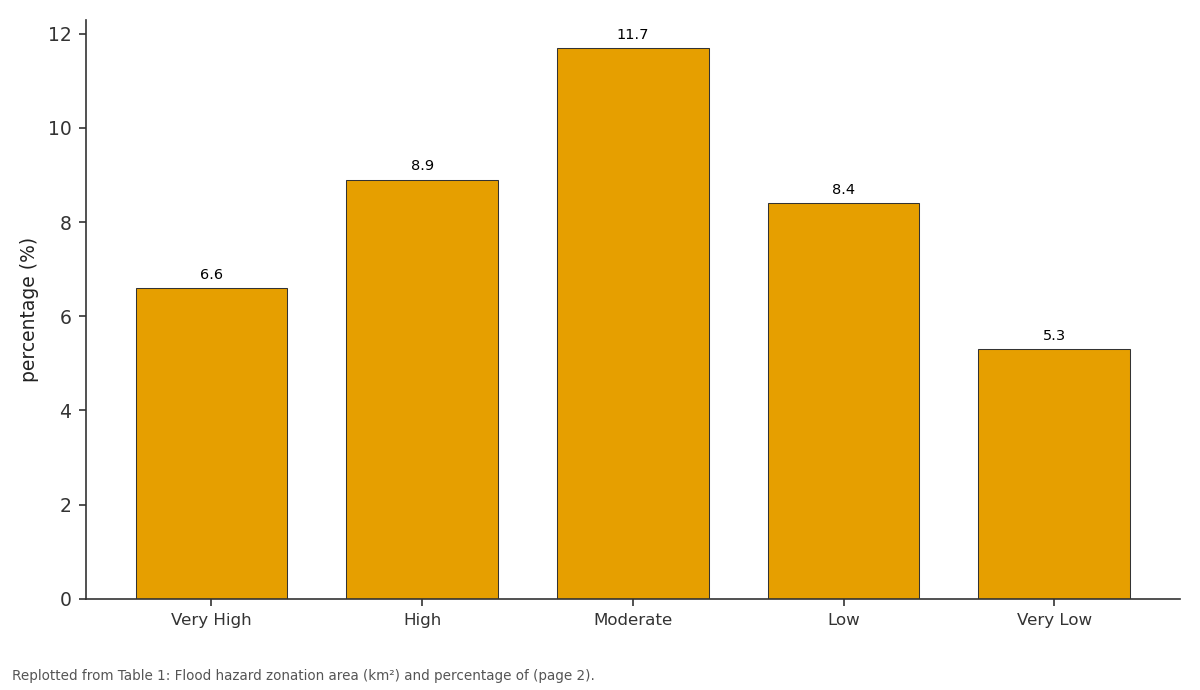
10-yr (%): Very High vs High vs Moderate vs Low vs Very Low
Replotted from Table 1 (page 2) of the original paper. Every bar is the paper's own table value.
View source evidence ↗Figures & tables
From the original paper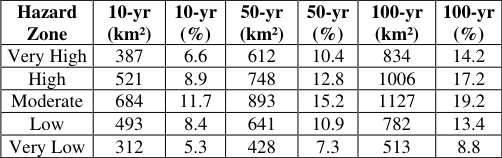 Table 1
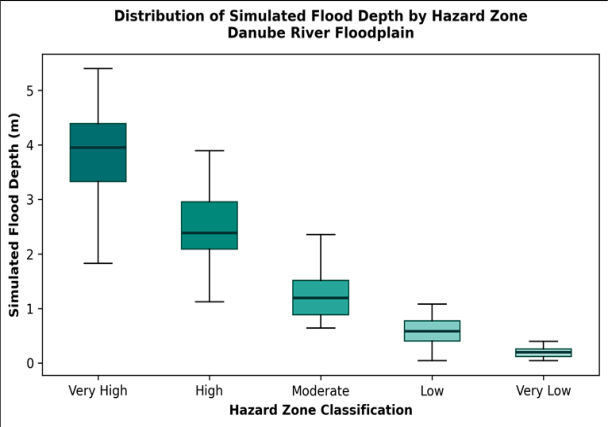 Figure 1
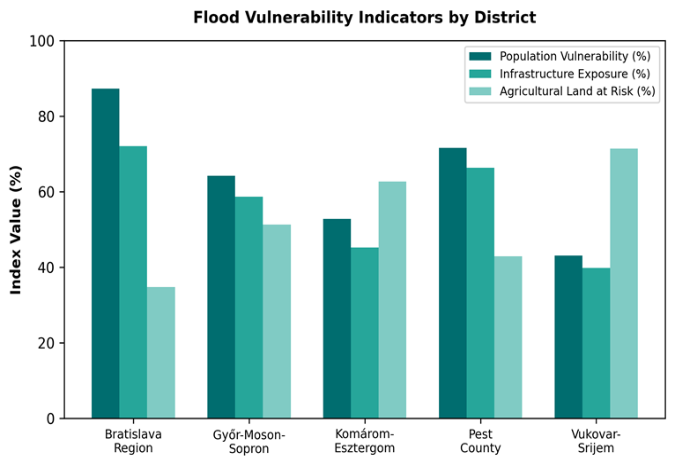 Figure 2
Introduction
Flood hazard zonation refers to the spatial delineation of areas expected to experience inundation of specified depth, velocity, and probability, and it forms the foundation of every credible flood-risk management strategy [1] . Along the Danube-Europe's second-longest river-this exercise carries transboundary weight: the river crosses or borders ten countries, and a levee failure in one jurisdiction can redirect floodwaters into the next [2] . The catastrophic 2013 event, which caused an estimated four billion euros in damage across Germany, Austria, Hungary, and Serbia, exposed gaps in hazard mapping that had not been updated since the early 2000s in several riparian districts [3] . Hydraulic modelling has advanced considerably over the past decade. Coupled onedimensional channel and two-dimensional floodplain solvers now run on desktop hardware with computation times measured in hours rather than weeks, and high-resolution digital elevation models from LiDAR surveys have reduced the topographic uncertainty that plagued earlier efforts [4] . HEC-RAS, developed by the United States Army Corps of Engineers, remains the most widely adopted open-source platform for flood simulation and has been validated on rivers ranging from Appalachian headwaters to the Mekong delta [5] . Risk assessment goes a step beyond hazard mapping by multiplying the physical hazard (depth, extent, velocity) by the exposure of assets and by their vulnerability-a function of building type, land use, population density, and coping capacity [6] . The EU Floods Directive (2007/60/EC) requires member states to prepare such risk maps for all significant flood-risk areas, yet implementation has been uneven along the middle Danube, where cross-border harmonisation of elevation data, land-use classification, and vulnerability scoring remains incomplete [7] . This research addressed those gaps by: (a) building a calibrated coupled 1D-2D hydraulic model for a 280-km reach of the middle Danube, (b) generating inundation maps for three return-period scenarios, and (c) combining those maps with exposure and vulnerability layers to produce an integrated flood-risk assessment suitable for transboundary planning [8] .
Model Description and Parameterisation
The hydraulic model was built in HEC-RAS version 6.3.1 using the coupled 1D-2D Shallow Water Equations solver. The one-dimensional domain comprised 142 cross-sections surveyed between 2017 and 2019 by the International Commission for the Protection of the Danube River (ICPDR), spaced at approximately 2-km intervals along the main channel. The two-dimensional floodplain mesh was generated from a 5-m LiDAR DEM mosaicked from national datasets of Slovakia, Hungary, Croatia, and Serbia. Mesh cell size varied from 50 m near levees and urban areas to 200 m in open agricultural floodplain. Manning's roughness coefficients were assigned by land-use class: 0.030 for the main channel, 0.045 for grassland, 0.065 for arable land, and 0.12 for forested floodplain [4,5] . Upstream boundary conditions consisted of flow hydrographs, and the downstream boundary was set as a stage-discharge rating curve derived from gauging records at Vukovar [2] .
Calibration and Validation
The model was calibrated against observed water-level and inundation-extent data from the June 2013 flood, the largest event on record for the middle Danube reach. Peak water levels at eight gauging stations were compared with modelled values; the mean absolute error was 0.23 m, and the Nash-Sutcliffe efficiency coefficient reached 0.89. Inundation extent was validated by overlaying the modelled flood boundary on Sentinel-1 SAR imagery acquired on 8 June 2013 (near-peak stage); the overall spatial agreement was 84.7% with a kappa statistic of 0.76 [3] . Sensitivity tests showed that Manning's roughness for the floodplain had the largest effect on peak stage, with a plus or minus 0.01 change in n shifting the peak by up to 0.18 m.
Material and Methods
Material and Methods
Material
Material
Methods
Synthetic design hydrographs for 10-year, 50-year, and 100year return periods were generated by fitting a Gumbel distribution to the annual maximum discharge series and scaling the 2013 observed hydrograph shape to each peak magnitude [1] . Each scenario was routed through the calibrated HEC-RAS model to produce grids of maximum depth, velocity, and inundation duration. Hazard classification followed a five-class scheme based on depth and velocity products: very high (depth > 2 m or depthvelocity product > 3 m2/s), high, moderate, low, and very low [6] . Exposure layers (population density, infrastructure count, agricultural area) were intersected with the hazard grid in QGIS 3.28. Vulnerability scores were assigned using the Kundak-Dogan framework adapted for Danubian conditions [7] . The final risk index combined hazard, exposure, and vulnerability in equal weights and was mapped on a 100 by 100 m grid. Table 1 shows that the 100-year scenario inundated 72.8% of the total floodplain area, with 31.4% falling in the veryhigh or high classes. Even the 10-year event covered 40.9% of the floodplain, indicating that large portions are exposed to relatively frequent flooding. Figure 2 reveals contrasting vulnerability profiles. The Bratislava region scored highest for population vulnerability (87.3%) and infrastructure exposure (72.1%) because of its dense urban fabric, whereas the Vukovar-Srijem districtlargely rural-had the greatest proportion of agricultural land at risk (71.4%).
Results
Results
Discussion
The coupled 1D-2D modelling approach delivered a calibrated flood simulation that matched the 2013 observed event with a mean absolute water-level error of 0.23 mwell within the 0.3-m benchmark recommended by the ICPDR for planning-grade models [2] . The use of a composite LiDAR DEM from four national datasets introduced some vertical offsets at country borders, but these were corrected to within 0.08 m using common benchmarks along the river centreline. The 100-year hazard map shows that nearly a third of the floodplain lies in the very-high or high zones, a figure that may appear alarming but is consistent with the geomorphology of the middle Danube, where the river has been confined by levees for over a century and the natural floodplain storage has been drastically reduced [3] . Leveeprotected areas that appear dry under normal conditions can experience rapid, deep inundation if levees overtop or breach, and the model captured this binary behaviour well. The risk assessment identified 14 hotspots where hazard, exposure, and vulnerability overlap, and most of these lie at or near the confluences of major tributaries-the Morava, Rába, and Drava-where backwater effects amplify flood depths. Targeted investment in these areas (e.g., setback levees, flood-compatible land use, early-warning sirens) would yield the highest risk-reduction return per unit of expenditure [6] .
Limitations of this research include the assumption of stationary flood frequency, which ignores the effect of climate change on peak discharges. Non-stationary frequency analysis and climate-scenario coupling should be explored in future work.
Conclusion
This research produced calibrated flood hazard and risk maps for a 280-km reach of the middle Danube floodplain, covering three return-period scenarios and integrating hazard with exposure and vulnerability layers. Under the 100-year scenario, 31.4% of the floodplain fell in the veryhigh or high hazard classes, and 14 risk hotspots were identified at tributary confluences and near urban centres. The transboundary modelling approach-harmonising elevation, land-use, and census data from four countriesdemonstrated that technically consistent flood-risk maps can be produced across borders when a shared hydraulic platform and common classification standards are adopted. These maps provide an evidence base for investment prioritisation under the EU Floods Directive and should be updated as new LiDAR data and climate projections become available.
Figures and tables from the paper
References
15 in the original paper- Chow VT, Maidment DR, Mays LW. Applied Hydrology. McGraw-Hill. 1988;New York:572.
- ICPDR. Danube River Basin District Management Plan -Update 2021. International Commission for the Protection of the Danube River. 2021;Vienna:188.
- Blöschl G, Nester T, Komma J, Parajka J, Perdigão RAP. The June 2013 flood in the Upper Danube basin, and comparisons with the 2002, 1954 and 1899 floods. Hydrology and Earth System Sciences. 2013;17(12):5197-5212.
- Brunner GW. HEC-RAS River Analysis System: Hydraulic Reference Manual, Version 6.0. US Army Corps of Engineers Hydrologic Engineering Center. 2021;Davis:547.
- Pappenberger F, Beven K, Horritt M, Blazkova S. Uncertainty in the calibration of effective roughness parameters in HEC-RAS using inundation and downstream level observations. Journal of Hydrology. 2005;302(1-4):46-69.
- Merz B, Kreibich H, Schwarze R, Thieken AH. Review article: Assessment of economic flood damage. Natural Hazards and Earth System Sciences. 2010;10(8):16971724.
- de Moel H, van Alphen J, Aerts JCJH. Flood maps in Europe -methods, availability and use. Natural Hazards and Earth System Sciences. 2009;9(2):289301.
- Ward PJ, Jongman B, Weiland FS, et al. Assessing flood risk at the global scale: Model setup, results, and sensitivity. Environmental Research Letters. 2013;8(4):044019.
- Dottori F, Salamon P, Bianchi A, et al. Development and evaluation of a framework for global flood hazard mapping. Advances in Water Resources. 2016;94:87102.
- Horritt MS, Bates PD. Evaluation of 1D and 2D numerical models for predicting river flood inundation. Journal of Hydrology. 2002;268(1-4):87-99.
- Teng J, Jakeman AJ, Vaze J, et al. Flood inundation modelling: A review of methods, recent advances and uncertainty analysis. Environmental Modelling and Software. 2017;90:201-216.
- Winsemius HC, Van Beek LPH, Jongman B, Ward PJ, Bouwman A. A framework for global river flood risk assessments. Hydrology and Earth System Sciences. 2013;17(5):1871-1892.
- Nones M. Dealing with sediment transport in flood risk management. Acta Geophysica. 2019;67(2):677-685.
- Domeneghetti A, Vorogushyn S, Castellarin A, Merz B, Brath A. Probabilistic flood hazard mapping: Effects of uncertain boundary conditions. Hydrology and Earth System Sciences. 2013;17(8):3127-3140.
- Jonkman SN, Bočkarjova M, Kok M, Bernardini P. Integrated hydrodynamic and economic modelling of flood damage in the Netherlands. Ecological Economics. 2008;66(1):77-90.