
Research article · 2026 · Full text
International Journal of Advanced Chemistry ResearchComparative evaluation of bromocresol green and naphthol blue black based photogalvanic cells for solar energy conversion and storage
Volume 8(4) · Pages 31–37 · DOI: 10.33545/26646781.2026.v8.i4a.645 ↗
Research areasPhotochemistry and Electron Transfer StudiesTiO2 Photocatalysis and Solar CellsOrganic Electronics and Photovoltaics
Abstract
Author-writtenThe comparative performance of photogalvanic cells for solar energy conversion and storage was reported using bromocresol green and naphthol blue black as different photosensitizers, EDTA as a reductant, and Tween 80 as a surfactant in different systems. The maximum photopotentials were 887.0 and 942.0 mV, whereas the photocurrent at equilibrium was 748.0 and 730.0 µA, respectively. The observed conversion efficiencies for bromocresol green and Naphthol Blue Black with EDTA and Tween 80 were 0.96 and 1.03%, respectively. The fill factors of 0.1509 and 0.1572 were experimentally determined at the power point of the cell. The effects of different parameters on the electrical output of the cell were observed, and the current-voltage (I-V) characteristics of the cell were studied in detail.
Summary
Source-checkedPlain-language reading of the full paper, prepared with AI and checked against the text. Each point links to the authors' own words.
Why it matters
- The depletion of natural energy resources makes the utilization of solar energy a necessary alternative for humans. View evidence ↗
- Photogalvanic cells are promising because they can address the intermittent output of photovoltaic cells, which is caused by darkness and clouds. View evidence ↗
- Photogalvanic (PG) cells generate energy through photochemical processes in an electrolyte solution that absorbs light to create high-energy products. View evidence ↗
The question
- The study aims to improve the performance and commercial viability of photogalvanic cells by investigating the use of Naphthol blue black dye as an energy material. View evidence ↗
What they did
- The researchers used Bromocresol green and Naphthol blue black as photosensitizers, EDTA as a reductant, and Tween 80 as a surfactant. View evidence ↗
- The experimental setup consisted of a 25 ml stock solution in an H-type glass tube with a 1.0 x 1.0 cm² platinum foil working electrode and a Saturated Calomel Electrode (SCE) as the counter electrode. View evidence ↗
- The system was illuminated using a 200 W tungsten lamp, with a water filter employed to block thermal radiation. View evidence ↗
What they found
- The Naphthol blue black system achieved a higher open circuit voltage (942.0 mV) compared to the Bromocresol green system (887.0 mV). View evidence ↗
- The Bromocresol green system produced a slightly higher short circuit current (748.0 µA) than the Naphthol blue black system (730.0 µA). View evidence ↗
- The conversion efficiency was higher for the Naphthol blue black system (1.03%) than for the Bromocresol green system (0.96%). View evidence ↗
- Electrical output increased with dye concentration up to a point, after which higher concentrations decreased power because they blocked light from reaching molecules near the electrodes. View evidence ↗
- The system's potential increased with pH until it reached a maximum value, after which further pH increases led to a decrease in potential. View evidence ↗
- Increasing the electrode area increased the maximum photocurrent (imax) but slightly decreased the equilibrium photocurrent (ieq). View evidence ↗
What it means
- The authors conclude that both systems are effective for solar energy conversion, with Naphthol Blue Black showing slightly superior efficiency. View evidence ↗
Visual summary
3 visualsIllustrations explain the paper; charts are replotted from the paper's own table values.
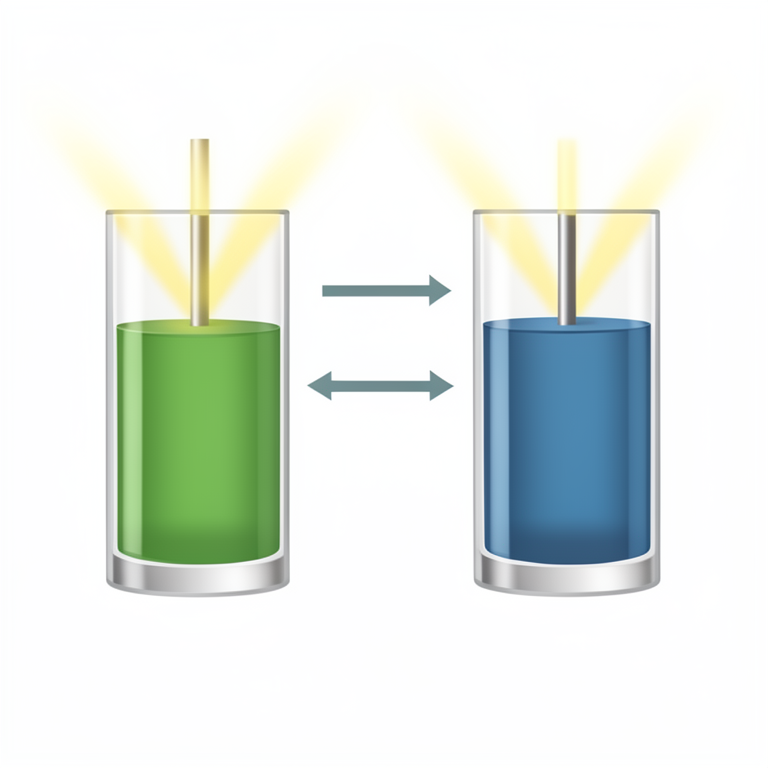
Photogalvanic Energy Cycle
AI-generated conceptual illustration (Photogalvanic cells containing bromocresol green and naphthol blue black dyes in an electrolyte solution). It explains the idea and does not show study data.
View source evidence ↗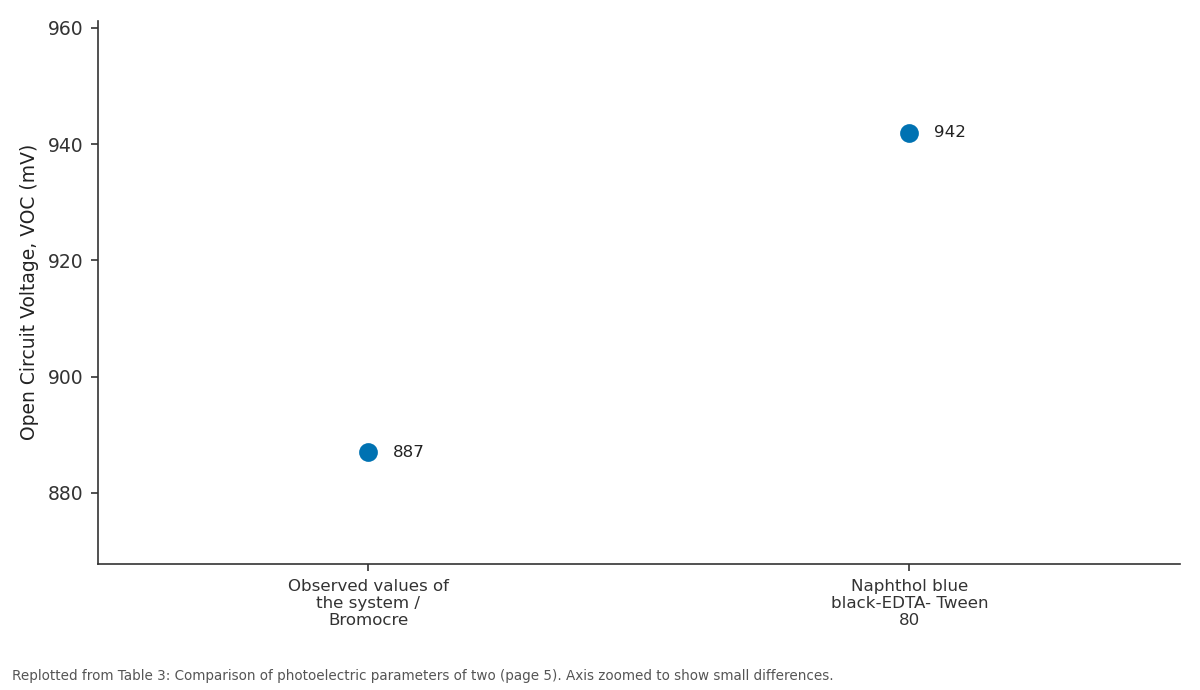
Open Circuit Voltage, VOC (mV): Observed values of the... vs Naphthol blue...
Replotted from Table 3 (page 5) of the original paper. Every bar is the paper's own table value.
View source evidence ↗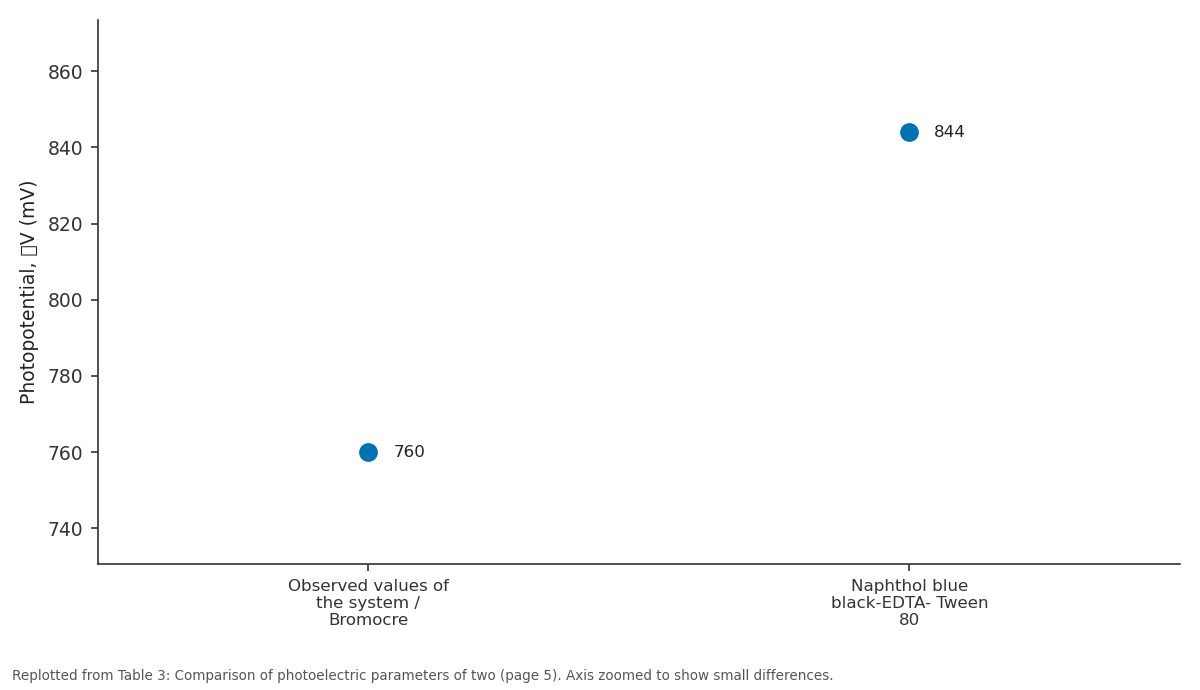
Photopotential, V (mV): Observed values of the... vs Naphthol blue...
Replotted from Table 3 (page 5) of the original paper. Every bar is the paper's own table value.
View source evidence ↗Figures & tables
From the original paper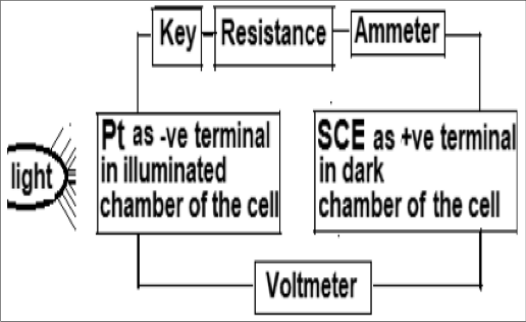 Figure 1
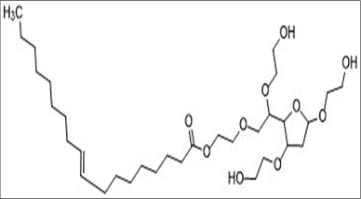 Figure 1
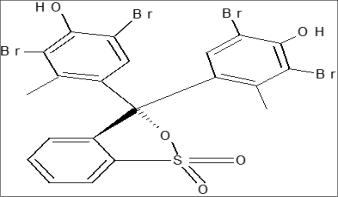 Figure 1
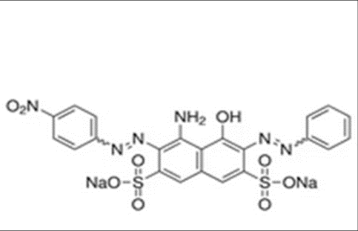 Figure 2
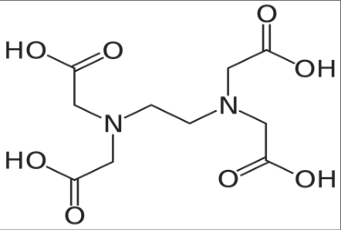 Figure 2
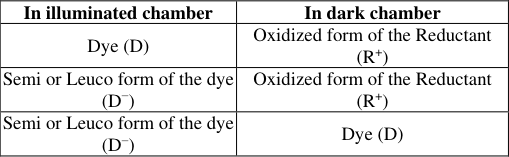 Table 1
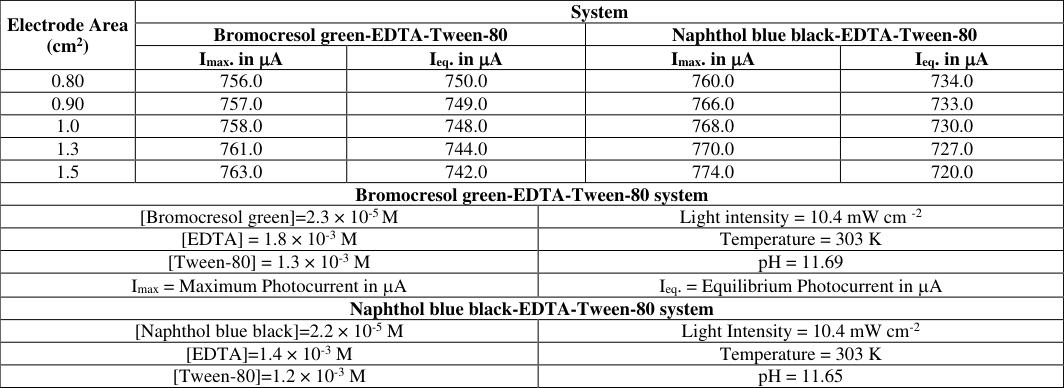 Table 2
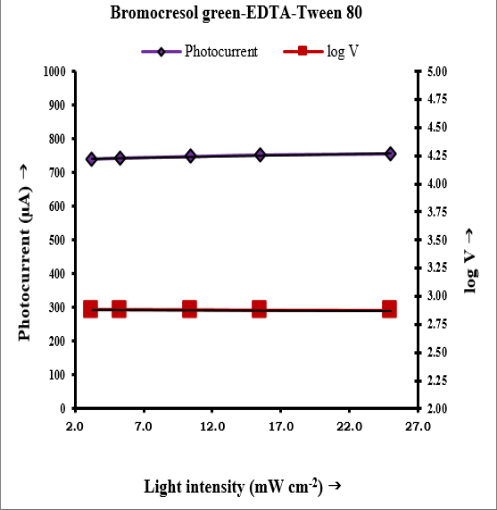 Figure 3
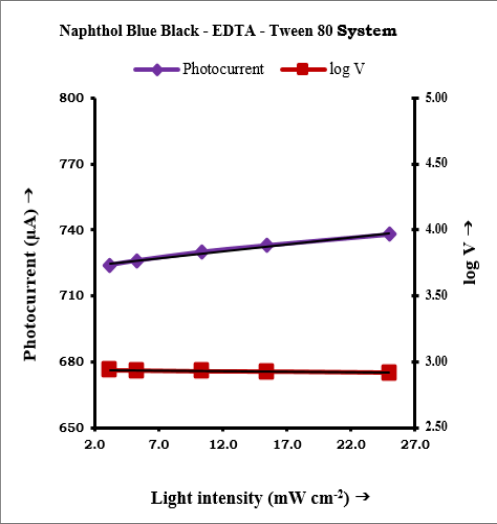 Figure 3
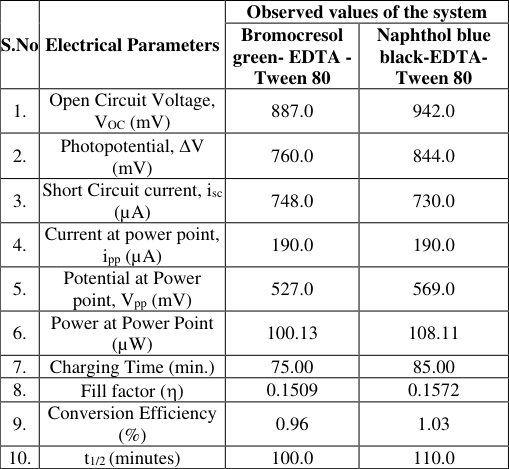 Table 3
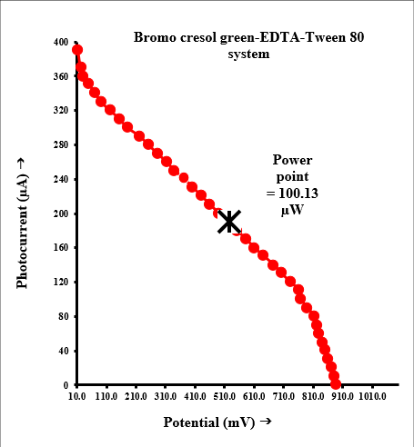 Figure 4
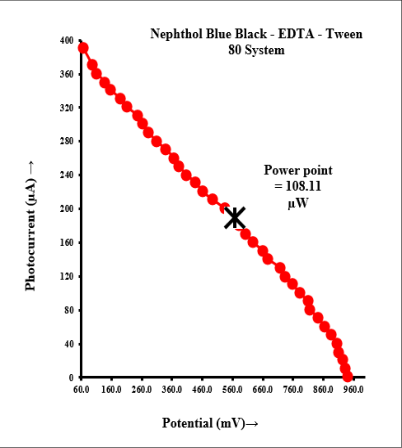 Figure 4
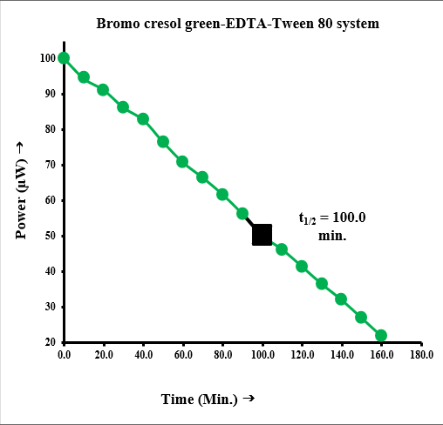 Figure 5
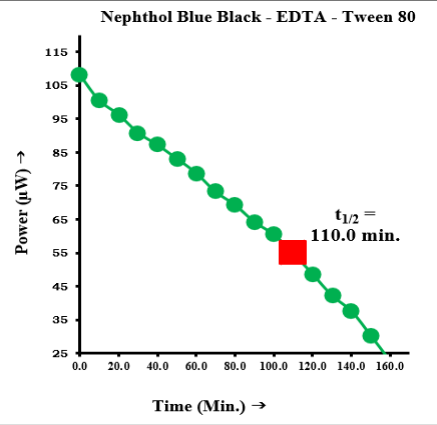 Figure 5
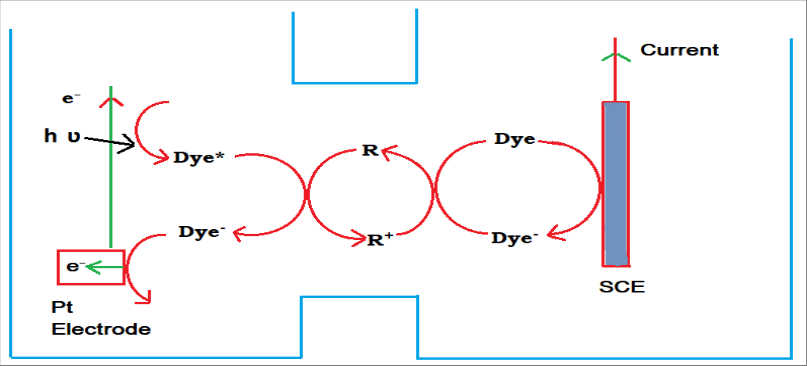 Figure 6
Introduction
As natural resources are being exhausted at an ever-increasing pace, when all natural resources of energy are completely exhausted, humans will have no other alternative but to utilize solar energy. It is not only a new, harmless, and low-cost source of energy, but also an inexhaustible source of energy. Although society's electricity needs are largely continuous, photovoltaic solar cells have an intermittent output due to clouds and darkness. In this regard, photogalvanic cells hold great promise for addressing both issues simultaneously by producing electricity via solar energy conversion. Accordingly, renewable energy resources are attracting considerable attention, and solar energy is one of the most promising future energy resources [1] . Developed and developing countries are focusing on the environmental damage caused by conventional energy sources. Renewable energy sources occur in nature and are regenerative or inexhaustible, such as solar, wind, hydropower, geothermal, biomass, tidal, and wave energy. Photogalvanic (PG) cells are photoelectrochemical systems based on the "photogalvanic effect." A PG cell is a device that produces energy through photochemical processes occurring inside the electrolyte solution upon light absorption within a highly absorbing electrolyte, which gives rise to high-energy products upon excitation by a photon. These energy products electrochemically lose photoenergy to generate electricity. These cells are quite different from other solar cells. Different types of dyes as light-absorbing materials, organic/inorganic chemicals as reductants, and anionic/cationic/neutral surfactants as micelles have been exploited for solar energy conversion and storage using PG cell technology. The Naphthol blue black dye has some characteristics that make it a good photosensitizer for use in solar energy harvesting through PG cells. The conversion of solar energy into electrical energy through photogalvanic cells is the most important and desirable route for obtaining electricity. Becquerel [2] was the first to observe the flow of current between unsymmetrically illuminated metal electrodes in sunlight, and the first report on photogalvanics was by Rideal and Williams [3] , but it was Systematically investigated by Rabinowitch [4][5] . Later on Kaneko and Yamada [6] , Murthy et al. [7] , Rohatgi Mukherjee et al. [8] , Folcher and Paris [9] , Alfredo et al. [10] ,
International Journal of Advanced Chemistry Research https://www.chemistryjournals.net
Dube et al. [11] , Bayer et al. [12] , Matsumoto et al. [13] and Shiroishi et al. [14] have studied some interesting photogalvanic systems. Bisquert et al. [15] have reviewed the physical-chemical principles of dyesensitized solar cells, whereas Mayer [16] has presented the molecular approaches to solar energy conversion. The problems encountered in the development of photogalvanic cells have been discussed previously. Krasnoholovets et al. [17] , Madhwani et al. [18] , Gangotri and Bhimwal [19] , Genwa and Chauhan [20] , Genwa and Singh [21] , Rathode et al. [22][23] . have recently developed photogalvanic systems for solar energy conversion and storage. The scientific community has successfully converted solar energy into electrical energy to the desired extent through various processes, but the storage capacity of solar energy is still not up to the mark for use as and when required. Many of them have used different photosensitizers, surfactants, and reductants in photogalvanic cells, but no attention has been paid to the use of this system containing Naphthol blue black dye as an energy material to enhance the electrical output and performance of the photogalvanic cell. Therefore, the present study was undertaken to achieve better performance and commercial viability of photogalvanic cells.
Materials and methods
Bromocresol green, Naphthol blue black, EDTA, Tween 80 and NaOH of Loba Chemie were used in the present work. Stock solutions of EDTA, dye, Tween 80, and NaOH (1N) were prepared in double-distilled water (conductivity 3.5 × 10 -5 Sm -1 ) and stored in amber-colored containers to protect them from sunlight. A 25 ml stock solution was placed in an H-type glass tube, which was blackened with black carbon paper to protect it from sunlight. A shiny Pt foil electrode (1.0 × 1.0 cm 2 ) was immersed in one limb of the H-tube, and a Saturated Calomel Electrode (SCE) was immersed in the other limb. The Pt electrode acted as the working electrode, and the Saturated Calomel Electrode (SCE) acted as the counter electrode. The entire system was first placed in the dark until a stable potential was attained, and then the limb containing the Pt electrode was exposed to a 200 W tungsten lamp (Philips). A water filter was used to block the thermal radiation. A digital multimeter (HAOYUE DT830D) was used to measure the photopotential and current generated by the system. The i-V characteristics were studied by applying an external load using a carbon pot (log 470 K) connected in the circuit. The Photogalvanic cell setup and chemical structures are shown in Figures 1 and2, respectively.
Results and Discussion
Effect of variation in dye, reductant, and surfactant concentrations The photogalvanic effect was studied in a photogalvanic cell containing two dyes, bromocresol green and naphthol blue black, in the presence of the reductant EDTA and surfactant Tween 80. The concentrations of the dyes bromocresol green and naphthol blue black were kept at 2.3×10 -5 M and 2.2×10 -5 M, respectively. It was observed that there was an increase in photopotential and photocurrent on increasing the concentration of dye. In the lower concentration range of dyes, there are limited dye molecules to absorb the major portion of the light in the path; therefore, the electrical output is low. In contrast, higher dye concentrations do not permit the desired light intensity to reach the molecules near the electrodes; hence, a corresponding decrease in the power of the cell is observed. EDTA was used as a reductant in the photogalvanic cell. The concentration of the reductant was maintained at 1.8×10 -3 M and 1.4×10 -3 M in Bromocresol green-EDTA-Tween-80 and Naphthol blue black-EDTA-Tween-80 systems respectively. With an increase in the concentration of the reductant, the electric output of the photogalvanic cell increased until it reached a maximum value, after which there was a decrease in the photopotential and photocurrent with further increase in the concentration of the reductant. The decrease in power output was also due to the decrease in the concentration of the reductant, which was caused by the lower number of molecules available for electron donation to the dye molecule. On the other hand, the large concentration of reductant again resulted in a decrease in electrical output because the large number of reductant molecules was hindered by the dye molecules reaching the electrode in the desired time limit. Surfactant Tween 80 was used in both photogalvanic cell systems. The concentration of surfactant was kept 1.3×10 -3 M and 1.2×10 - 3 M in Bromocresol green-EDTA-Tween-80 and naphthol blue black-EDTA-Tween-80. The electrical output of the cell increased with increasing surfactant concentration, reaching a maximum value. With a further increase in the surfactant concentration, a decrease in the electrical output was observed. The most important properties of micellar systems are their ability to solubilize a variety of molecules and their substantial catalytic effect on many chemical reactions. The photogalvanic cell exhibited a better electrical output at the critical micelle concentration of the surfactant. Photoinduced electron transfer processes in micellar systems are potentially important for efficient energy conversion and storage because surfactants help achieve separate photoproducts via hydrophilic-hydrophobic interactions of the products with the micellar interface.
Micelles not only solubilized the photosensitizer molecules to a maximum extent around their CMC values but also stabilized the photogalvanic cell systems.
Effect of pH
Photogalvanic cells containing the lissamine green Bascorbic acid-NaLS system, bromocresol green-ascorbic acid-NaLS system, and brilliant blue FCF-ascorbic acid NaLS system were found to be quite sensitive to the pH of the solution. All three systems with three different dyes were observed to work effectively in the strong alkaline range. The working range for the present study was in the pH range of 11.52-12.80. The potential of the system increased with increasing pH. The potential reached a maximum value for a particular pH and then decreased with further increases in pH. It was observed that the pH for optimum conditions for the reductant was related to its pKa value, that is, the desired pH should be slightly higher than their pKa values (pH>pKa). This may be due to the availability of the reductant in its anionic form, which is a better donor.
Effect of diffusion length and electrode area
The diffusion length (i.e., the distance between the SCE and platinum electrode) greatly affects all three systems. The effect of the variation in diffusion length on the electrical output (imax, ieq) and initial rate of generation of current of the photogalvanic cell was observed using H-cells of different dimensions. In the first few minutes of illumination, a sharp increase in the photocurrent was observed, followed by a gradual decrease to a stable photocurrent value. This photocurrent behavior indicates an initial rapid reaction, followed by a slow rate-determining step. The results are also discussed to identify the electroactive species by considering various probable processes and combinations of electroactive species for the electrical output of the photogalvanic cells. The processes and combinations are summarized in Table 1. If the oxidized form of the reductant is formed only in the illuminated chamber and is considered to be the electroactive species in the dark chamber, it must diffuse from the illuminated chamber to the dark chamber to accept an electron from the electrode. Consequently, the maximum photocurrent (i max ) and rate of photocurrent generation should decrease with an increase in the diffusion length; however, this was not observed experimentally. The value of (i eq ) was also observed to be independent of the change in the diffusion length (it decreases slightly). Based on the effect of diffusion path length on the current parameters, it may be concluded that the main electroactive species are the leuco or semi-leuco form of dye (photosensitizers) and the dye in the illuminated and dark chambers, respectively. However, the reductant and its oxidized product act only as electron carriers in this pathway. The effect of the electrode area on the current parameters was also observed in the two systems, and the observations are listed in Table 2. Based on observations, the maximum photocurrent (i max ) was found to increase with increasing electrode area, but the equilibrium photocurrent (i eq ) was affected slightly, rather it was decreased slightly.
| Electrode Area (cm2) | System | — | — | — | — |
|---|---|---|---|---|---|
| Bromocresol green-EDTA-Tween-80 | Naphthol blue black-EDTA-Tween-80 | ||||
| Imax. in A | Ieq. in A | Imax. in A | Ieq. in A | ||
| 0.80 | 756.0 | 750.0 | 760.0 | 734.0 | |
| 0.90 | 757.0 | 749.0 | 766.0 | 733.0 | |
| 1.0 | 758.0 | 748.0 | 768.0 | 730.0 | |
| 1.3 | 761.0 | 744.0 | 770.0 | 727.0 | |
| 1.5 | 763.0 | 742.0 | 774.0 | 720.0 | |
| Bromocresol green-EDTA-Tween-80 system | |||||
| [Bromocresol green]=2.3 × 10⁻⁵ M | Light intensity = 10.4 mW cm -2 | ||||
| [EDTA] = 1.8 × 10⁻³ M | Temperature = 303 K | ||||
| [Tween-80] = 1.3 × 10⁻³ M | pH = 11.69 | ||||
| Imax = Maximum Photocurrent in A | Ieq. = Equilibrium Photocurrent in A | ||||
| Naphthol blue black-EDTA-Tween-80 system | |||||
| [Naphthol blue black]=2.2 × 10⁻⁵ M | Light Intensity = 10.4 mW cm-2 | ||||
| [EDTA]=1.4 × 10⁻³ M | Temperature = 303 K | ||||
| [Tween-80]=1.2 × 10⁻³ M | pH = 11.65 |
Table text extracted from the original PDF; superscript letters are shown inline. The original table image is below.
View original table image
| In illuminated chamber | In dark chamber |
|---|---|
| Dye (D) | Oxidized form of the Reductant (R+) |
| Semi or Leuco form of the dye (D−) | Oxidized form of the Reductant (R+) |
| Semi or Leuco form of the dye (D−) | Dye (D) |
Table text extracted from the original PDF; superscript letters are shown inline. The original table image is below.
View original table image
Effect of light intensity
The intensity of light also affects the electrical output of the cell. The photocurrent exhibited a linear increasing behavior with increasing light intensity, whereas the photopotential increased logarithmically. This increase in electrical output is due to the increase in the number of photons with increasing light intensity (Fig. 1a and1b).
Current-voltage properties of the photogalvanic cell:
The open-circuit voltage (V oc ) and short-circuit current (i sc ) of the photogalvanic cells were measured under continuous illumination of light, with the help of a digital pH meter (keeping the circuit open) and a microammeter (keeping the circuit closed), respectively. The potential and current between these two extreme values (V pp and i pp ) were recorded using a carbon pot (log 407 K) connected to the circuit of the microammeter, through which an external load was applied to the circuit. The I-V characteristics of the cells are shown in the current-potential curves (Fig. 2a andb). The i-V curve deviated from its regular rectangular shape. A point in the I-V curve, called the power point, was determined where the product of the curve of current and potential was maximum. Using the I-V curve, the fill factor was calculated using the following formula:
Where, V pp = Potential at power point (mV) V oc = Open circuit voltage (mV) i pp = Current at power point (µA) i sc = Short circuit current (µA)
Cell performance and conversion efficiency:
The performance of the photogalvanic cell was observed by applying an external load (necessary to have current at power point) after terminating the illumination as soon as the potential reached a constant value. The performance was determined in terms of the t 1/2 , that is, the time required for the output (power) to fall to half its value at the power point. The overall comparative performance of the photogalvanic cells was observed and reached a remarkable level with respect to the electrical output, initial generation of photocurrent, conversion efficiency, and storage capacity of the photogalvanic cell. The comparative performance obtained in both systems is summarized in Table 3 and graphically shown in the time-power curves (Fig. 3a and3b). The conversion efficiency of the cell was determined using the following formula:
Where, An electrode area of Pt-foil electrode
Dark chamber
At the calomel electrode, the dye molecule absorbs an electron from the electrode and is transformed into a semior leuco-form. Finally, the leuco/semi form of the dye and the oxidized form of the reductant mix to generate the original molecules of the dye and the reductant. This cycle of the mechanism is repeated, resulting in the continuous generation of current.
Acknowledgement
AcknowledgementThe Authors are thankful to the Head of the Department of Chemistry for providing the necessary facilities.
Figures and tables from the paper
References
22 in the original paper- Shiroishi H, Kaburagi Y, Seo M, Hoshi T, Nomura T, Tokita S, Kaneko M. J Chem Software. 2002;8:47-47.
- Becquerel K. On electron effects under the influence of solar radiation. Comptes Rendus de l Academie Sciences Paris. 1839;9:561-561.
- Rideal EK, Williams EG. The action of light on the ferrous iodine iodide equilibrium. J Chem Soc Trans. 1925;127:258-269.
- Rabinowitch E. The photogalvanic effect I: the photochemical properties of the thionine-iron system. J Chem Phys. 1940;8:551-559.
- Rabinowitch E. The photogalvanic effect II: the photogalvanic properties of thionine-iron system. J Chem Phys. 1940;8:560-566.
- Kaneko M, Yamada A. Photopotential and photocurrent induced by tolusafranine ethylenediaminetetraacetic acid system. J Phys Chem. 1977;81(12):1213-1215.
- Murthy ASN, Dak AC, Reddy KS. Photogalvanic effect in riboflavin ethylenediaminetetraacetic acid system. Int J Energy Res. 1980;4(4):339-343.
- Rohatgi-Mukherji KK, Roy M, Bhowmik BB. Photovoltage generation of the phenosafranine dye EDTA sandwich cell. Solar Energy. 1983;31:417-418.
- Alfredo O, Georgina P, Sebasteian PJ. Solar Energy Materials & Solar Cells. 1990;59:137-137.
- Dube S, Sharma SL, Ameta SC. Photogalvanic effect in Azur B-NTA system. Energy Conversion and Management. 1997;38(2):101-106.
- Bayer IS, Eroglu I, Turker L. Photogalvanic effect in aqueous methylene blue-nickel mesh system: conversion of light into electricity. Int J Energy Res. 2001;25(3):207-222.
- Matsumoto K, Fujioka S, Mei Y, Wada M, Erabi T. Construction of photogalvanic cell using photosynthetic reaction centre complex and cytochrome C2 from Rhodosprillum rubrum. Electrochemistry. 2001;69(4):340-340.
- Shiroishi H, Kaburagi Y, Seo M, Hoshi T, Nomura T, Tokita S, Kaneko M. Virtual device simulator of bipolar photogalvanic cell. J Chem Software. 2002;8:47-47.
- Bisquert J, Cahen D, Hodes G, Riihle S, Zaban A. J Phys Chem B. 2004;108:8106-8106.
- Meyer GJ. Molecular approaches to solar energy conversion with coordination compounds anchored to semiconductor surfaces. Inorg Chem. 2005;44(20):6852-6864.
- Krasnoholovets V, Kukhtarev N, Kukhtareva T. Int J Mod Phys B. 2006;20:2323-2323.
- Madhwani S, Vardia J, Punjabi PB, Sharma VK. Use of fuschsin basic: EDTA system in photogalvanic cell for solar energy conversion. J Power Energy. 2007;221(1):33-39.
- Gangotri KM, Bhimwal MK. Study on the performance of photogalvanic cells for solar energy conversion and storage: brilliant cresyl blue-D-xylose-NaLS system. Int J Ambient Energy. 2010;31(2):71-80.
- Chouhan A, Genwa KR. Study of electrical parameters and energy efficiency in photogalvanic cell containing erythrosine as a photosensitizer in benzethonium chloride-EDTA system. Energy Sci Tech. 2011;2(1):1824.
- Genwa KR, Singh K. Optimum efficiency of photogalvanic cell for solar energy conversion: lissamine green B-ascorbic acid-NaLS system. Smart Grid Renew Energy. 2013;4(3):306-311.
- Rathore J, Pareek RK, Singh K. Significance of aniline blue in liquid phase dye sensitized photogalvanic cell for solar power generation and storage using ascorbic acid and sodium lauryl sulphate. Res J Chem Environ. 2022;26(3):45-53.
- Rathore J, Pareek RK, Singh K. Natural dye curcumin based photogalvanic solar cell: conversion and storage of solar energy into electrical energy for sustainable development. 2022;9(5):235-247.