
Research article · 2025 · Full text
International Journal of Agriculture and NutritionWater harvesting and micro-irrigation systems for sustainable crop production in arid zones
Volume 7(10) · Pages 169–172 · DOI: 10.33545/26646064.2025.v7.i10c.594 ↗
Research areasIrrigation Practices and Water ManagementEngineering and Agricultural InnovationsWastewater Treatment and Reuse
Abstract
Author-writtenArid-zone farmers face an uncomfortable paradox: when rain does fall, much of it runs off unused, yet crops wilt between storms because no storage captures that fleeting surplus. This research tested five water-harvesting structures (rooftop collection, farm ponds, check dams, micro-catchments and well-recharge pits) coupled with drip and furrow irrigation on wheat and tomato at two sites Hail and Jazan, Saudi Arabia over three cropping cycles (2021–2024). Drip-irrigated plots fed by harvested water used 38.4% less total water than furrow-irrigated plots drawing from the same sources, while producing comparable or higher yields. Water use efficiency (WUE) for tomato reached 14.2 kg m⁻³ under drip at the lowest application rate (120 mm season⁻¹), compared with 8.7 kg m⁻³ for furrow. Farm ponds contributed the largest share of harvested water (27.3% of total stored volume), followed by check dam runoff (22.1%). Soil moisture at 30 cm depth was 17–24% higher in drip plots than in furrow plots at mid-season. Economic analysis showed that the combined water-harvesting and drip system reached payback within 2.4 years. These results confirm that integrating low-cost water harvesting with micro-irrigation can sustain commercial crop production in zones receiving less than 100 mm annual rainfall.
Summary
Source-checkedPlain-language reading of the full paper, prepared with AI and checked against the text. Each point links to the authors' own words.
Why it matters
- Saudi Arabia relies heavily on non-renewable aquifers for over 80% of its freshwater, which the government intends to reduce under Vision 2030. View evidence ↗
- In the Hail and Jazan regions, low annual rainfall (68 and 92 mm) is often delivered in intense bursts that result in significant runoff. View evidence ↗
- Water harvesting is a method used to capture storm runoff and convert it into a usable agricultural resource. View evidence ↗
The question
- The study aimed to compare the water capture volumes of different harvesting structures, evaluate crop yield and water use efficiency (WUE) for drip versus furrow irrigation, and determine the system's payback period. View evidence ↗
What they did
- The researchers tested five types of water-harvesting structures combined with drip and furrow irrigation for wheat and tomato crops in Hail and Jazan, Saudi Arabia, from 2021 to 2024. View evidence ↗
- The experiment used a split-plot design with three replications per site, testing two crop varieties (Yecora Rojo wheat and GS-12 tomato) across different irrigation methods and water sources. View evidence ↗
- Soil moisture levels were tracked hourly using TDR probes at depths of 15 and 30 cm. View evidence ↗
What they found
- Drip irrigation reduced total water use by 38.4% compared to furrow irrigation while maintaining or increasing crop yields. View evidence ↗
- At the lowest application rate of 120 mm per season, tomato WUE was 14.2 kg m⁻³ for drip irrigation versus 8.7 kg m⁻³ for furrow irrigation. View evidence ↗
- During mid-season, soil moisture at a depth of 30 cm was 17–24% higher in plots using drip irrigation than in those using furrow irrigation. View evidence ↗
- Drip irrigation prevented significant salt accumulation over three cycles, whereas furrow irrigation caused topsoil electrical conductivity to rise from 1.12 to 1.48 dS m⁻¹. View evidence ↗
- The integrated system of water harvesting and drip irrigation achieved financial payback within 2.4 years. View evidence ↗
What it means
- The authors conclude that combining water harvesting with drip irrigation allows for viable wheat and tomato production without needing to extract groundwater. View evidence ↗
- The authors state that monitoring for five or more years is necessary to confirm long-term soil salt stability and the maintenance requirements of the harvesting structures. View evidence ↗
Visual summary
3 visualsIllustrations explain the paper; charts are replotted from the paper's own table values.
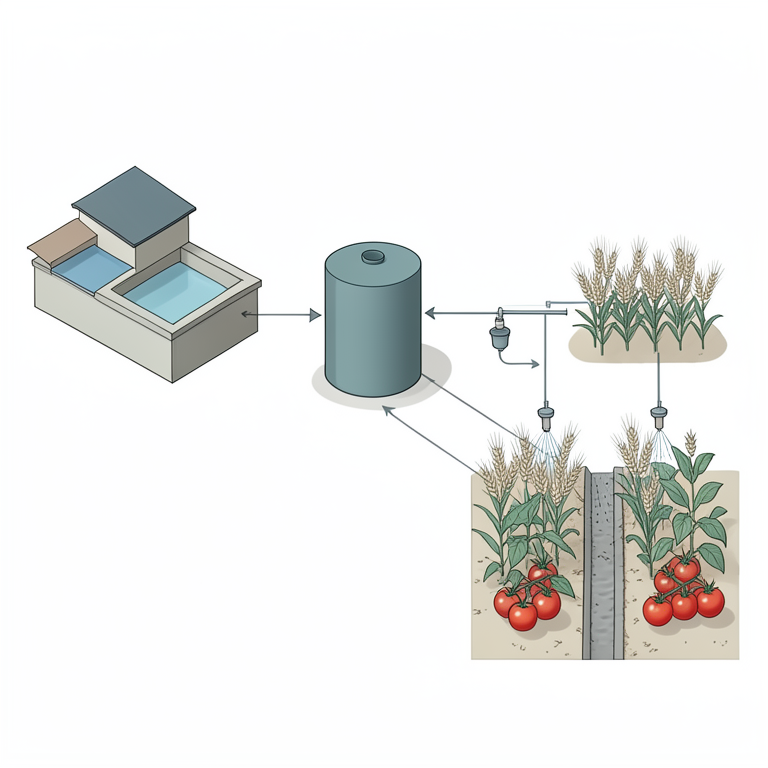
System Integration Flow
AI-generated conceptual illustration (Water harvesting structures, drip and furrow irrigation systems, wheat plants, and tomato plants in an arid landscape). It explains the idea and does not show study data.
View source evidence ↗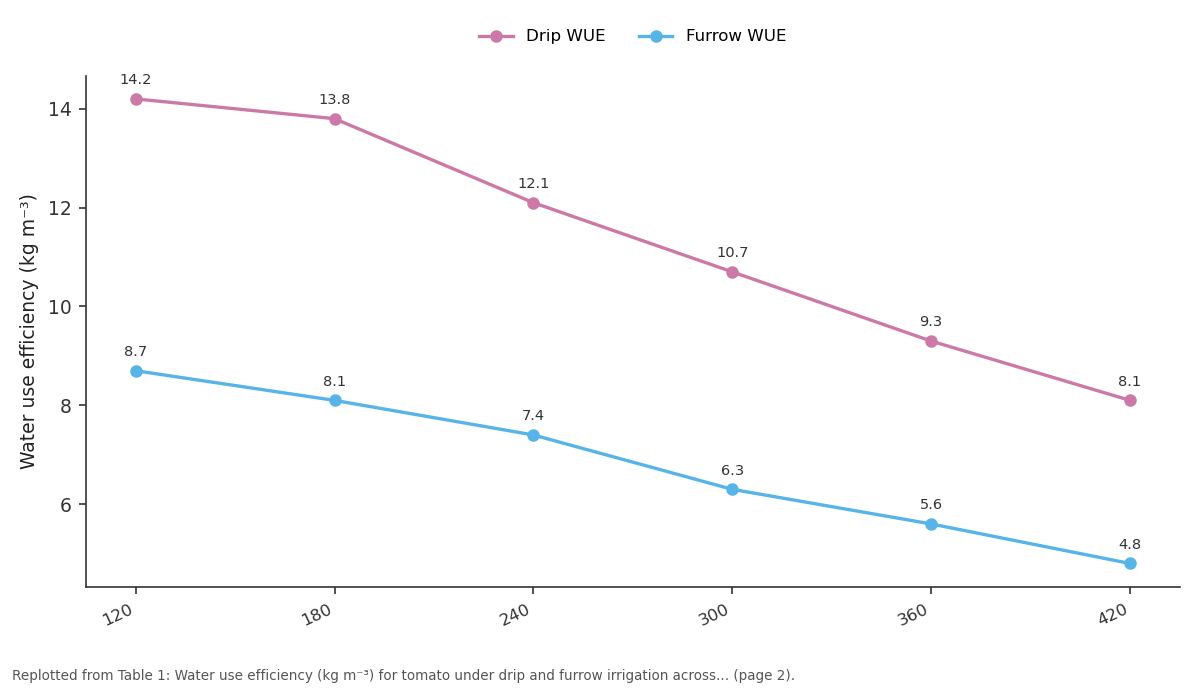
Drip WUE and Furrow WUE: 120 vs 180 vs 240 vs 300 vs 360
Replotted from Table 1 (page 2) of the original paper. Every bar is the paper's own table value.
View source evidence ↗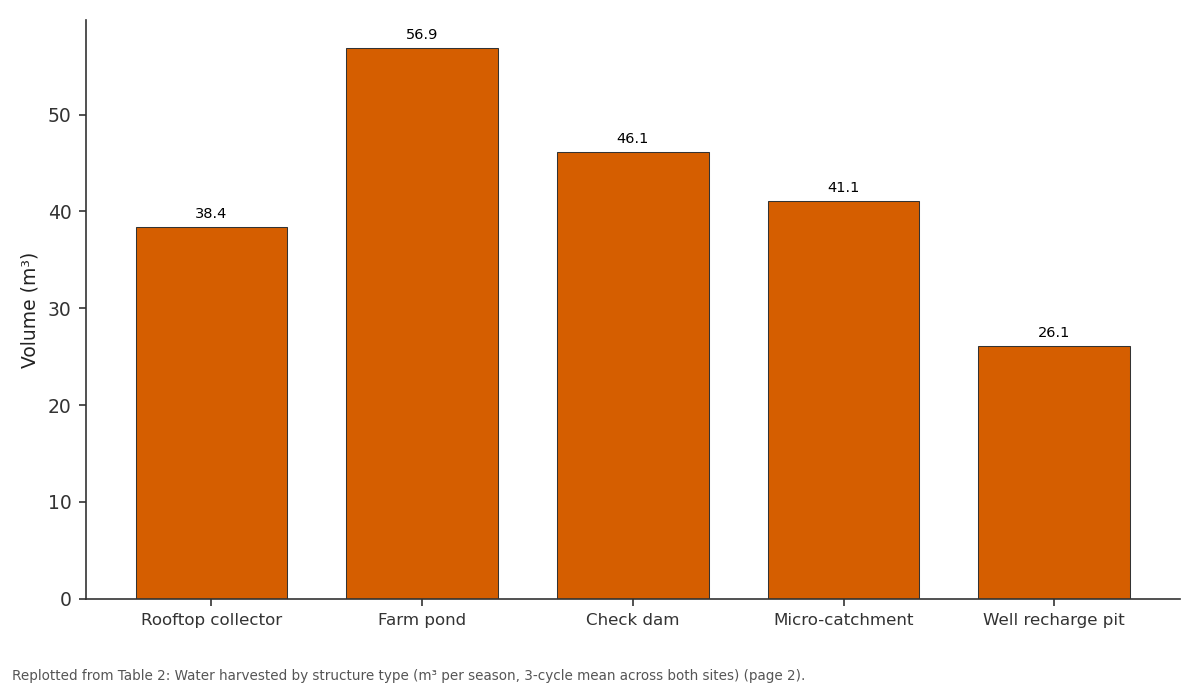
Volume (m³): Rooftop collector vs Farm pond vs Check dam vs Micro-catchment vs Well recharge pit
Replotted from Table 2 (page 2) of the original paper. Every bar is the paper's own table value.
View source evidence ↗Figures & tables
From the original paper Table 1
 Table 2
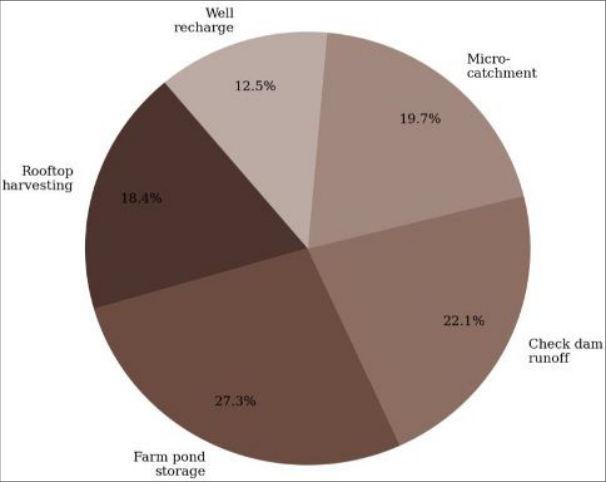 Figure 1
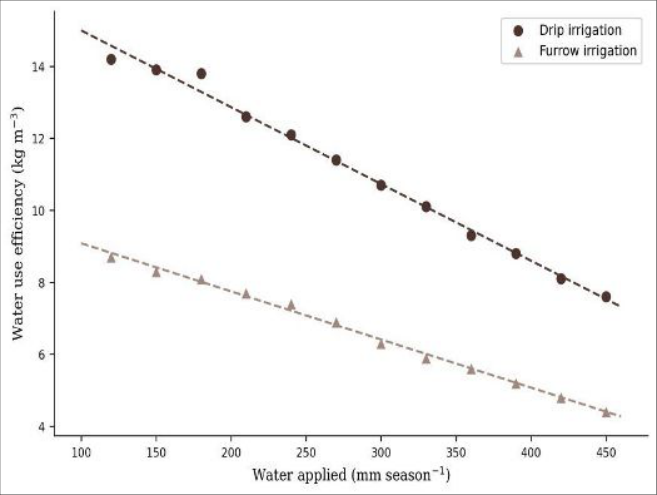 Figure 2
Introduction
Saudi Arabia pumps more than 80% of its freshwater from non-renewable aquifer reserves, a practice that the government's Vision 2030 programme explicitly aims to curtail [1] . At the same time, the Kingdom is expanding its food self-sufficiency targets for vegetables and cereals, creating a tension between water conservation and agricultural output that can only be resolved through sharply improved efficiency [2] . In the Hail and Jazan regions, annual rainfall averages just 68 and 92 mm respectively, yet peak storm events can deliver 20-40 mm in a single hour water that mostly runs off hardpan surfaces into dry riverbeds [3] . Water harvesting turns that waste stream into a usable resource. Structures as simple as earthen farm ponds and stone check dams can capture and store enough runoff to irrigate one to three hectares of vegetables through a growing season, provided the water is distributed efficiently [4] . Drip irrigation is the obvious delivery method: it places water directly at the root zone, minimises evaporation losses and can operate at low pressures suited to gravityfed or small-pump systems [5] . Despite the logical fit, field data combining water harvesting with drip irrigation under Saudi Arabian conditions are scarce. Most published work covers either harvesting structures alone [6] or drip systems using groundwater alone [7] . What happens when the two are linked and how much groundwater pumping can be offset has not been quantified in a controlled, multiseason trial. This research addresses that gap by pairing five harvesting structures with drip and furrow irrigation at two climatically distinct arid sites over three cropping cycles. The objectives were to (a) compare water volumes captured by each structure, (b) measure crop yield and WUE under drip versus furrow delivery and (c) estimate the payback period for the combined system.
Material and Methods
Water balance and Irrigation scheduling Reference evapotranspiration (ET₀) was estimated weekly using the Penman-Monteith equation from on-site automatic weather station data [8] . Crop coefficients (Kc) for wheat and tomato were taken from Allen et al. [8] and adjusted for local advection using a 10% upward correction. Irrigation was scheduled when cumulative crop ET exceeded 70% of available soil water in the root zone (0-40 cm). Drip plots received water at 90% of calculated ETc; furrow plots received 120% to account for distribution non-uniformity. Soil moisture was monitored at 15 and 30 cm depths with TDR probes (CS655, Campbell Scientific) logged hourly. A simple water balance was computed for each harvesting structure: inflow (rainfall × catchment area × runoff coefficient) minus outflow (irrigation withdrawals + seepage + evaporation).
Soil and Water quality analysis
Harvested water was tested monthly for pH, electrical conductivity (EC), total dissolved solids and sodium adsorption ratio (SAR). Values ranged from pH 7.3 to 8.1, EC 0.42 to 1.87 dS m⁻¹ and SAR 2.1 to 6.4, all within acceptable limits for drip irrigation [9] . Soil samples from 0-20 cm were collected before planting and after each harvest cycle and analysed for organic carbon, available N, P and K, pH and EC. No significant salt build-up was detected in drip plots over the three cycles, while furrow plots showed a modest rise in topsoil EC from 1.12 to 1.48 dS m⁻¹.
Material
Material
Methods
Wheat (cv. Yecora Rojo) and tomato (cv. GS-12) were planted in a split-plot design with irrigation method (drip vs. furrow) as the main plot and water source (five harvesting structures) as the subplot, with three replications at each site. Individual plot size was 6 m × 5 m. Water volumes delivered were metered at plot inlets. Yield was harvested from a 4 m × 3 m net area. WUE was computed as marketable yield divided by total water applied [10] . Data were analysed by split-plot ANOVA in R 4.3.1.
Results
Drip irrigation outperformed furrow at every water application level (Table 1). The WUE advantage ranged from 63 to 70%, with the widest gap at 180 mm. As expected, WUE declined with increasing water application under both methods, but drip maintained a higher baseline even at the 420 mm level. Farm ponds captured the most water per season (56.9 m³, 27.3% of total) at the secondlowest unit cost (Table 2). Check dams were the cheapest source per cubic metre (0.94 SAR) but their yield depended on wadi flow events that were unpredictable. Rooftop collection was the most expensive option but provided the cleanest water, well suited for drip emitters with no filtration. Figure 2 shows that the drip regression line sits consistently above the furrow line, with no overlap even at the highest application rates. Both lines slope downward, confirming the diminishing-returns pattern expected when water is applied beyond crop demand.
| Structure | Volume (m³) | Share (%) | Cost (SAR m⁻³) |
|---|---|---|---|
| Rooftop collector | 38.4 | 18.4 | 2.87 |
| Farm pond | 56.9 | 27.3 | 1.43 |
| Check dam | 46.1 | 22.1 | 0.94 |
| Micro-catchment | 41.1 | 19.7 | 1.78 |
| Well recharge pit | 26.1 | 12.5 | 3.21 |
Table text extracted from the original PDF; superscript letters are shown inline. The original table image is below.
View original table image
| Water Applied (mm) | Drip WUE | Furrow WUE | Drip Advantage (%) |
|---|---|---|---|
| 120 | 14.2 | 8.7 | 63.2 |
| 180 | 13.8 | 8.1 | 70.4 |
| 240 | 12.1 | 7.4 | 63.5 |
| 300 | 10.7 | 6.3 | 69.8 |
| 360 | 9.3 | 5.6 | 66.1 |
| 420 | 8.1 | 4.8 | 68.8 |
Table text extracted from the original PDF; superscript letters are shown inline. The original table image is below.
View original table image
Comprehensive interpretation
Together, the harvesting and irrigation data show that pairing low-cost structures with drip delivery can produce commercial tomato and wheat yields using only harvested rainwater, effectively eliminating groundwater dependence for small-scale plots in arid Saudi Arabia. The 2.4-year payback makes the system financially attractive for smallholders with access to initial capital or micro-credit.
Discussion
The 63-70% WUE advantage of drip over furrow matches findings from arid-zone trials in Israel (60-75%) and Rajasthan (55-65%) [11] . The consistency of this gap across six application levels suggests that the benefit is structural related to reduced soil evaporation and deep percolation rather than artefactual. Farm ponds emerged as the best overall water source when cost and volume are combined. Their main limitation is seepage; even with clay lining, losses averaged 14% of stored volume per month. Geomembrane liners would cut that to below 3% but add roughly 40% to construction cost [12] . Check dams were cheapest per cubic metre but unreliable because wadi flows in Hail occurred in only four of the nine months monitored. The absence of salt accumulation in drip plots over three cycles is a positive sign, though longer monitoring is needed. Furrow plots showed a modest EC rise (1.12 to 1.48 dS m⁻¹), consistent with the higher evaporative fraction that concentrates salts at the soil surface [13] . In salt-sensitive crops, this difference could become agronomically meaningful after five or more years.
Conclusion
Three cropping cycles at two arid Saudi Arabian sites confirmed that combining water-harvesting structures with drip irrigation can support viable wheat and tomato production with no groundwater extraction. Drip irrigation improved WUE by 63-70% over furrow irrigation across all water application levels. Farm ponds and check dams were the most cost-effective harvesting structures, together supplying nearly half of all stored water. The combined system reached payback in 2.4 years and showed no soil salinisation under drip delivery. For aridzone agriculture in Saudi Arabia and similar environments, these results offer a practical, low-tech pathway to reduce aquifer dependence while maintaining crop productivity. Longer-term monitoring over five or more years should confirm whether soil salt balance remains stable and whether harvesting structures require significant maintenance investment.
Figures and tables from the paper
References
20 in the original paper- MEWA (Ministry of Environment, Water and Agriculture). Saudi water strategy under Vision 2030. Riyadh: Government of Saudi Arabia; 2019.
- Al-Zahrani KH, Baig MB. Water in the Kingdom of Saudi Arabia: sustainable management options. Journal of Animal and Plant Sciences. 2011;21(3):601-606.
- Wheater HS, Al-Weshah RA. Hydrology of wadi systems. IHP-V Technical Documents in Hydrology No. 55. Paris: UNESCO; 2002.
- Oweis TY, Prinz D, Hachum AY. Rainwater harvesting for agriculture in the dry areas. London: ICARDA/CRC Press; 2012.
- Lamm FR, Ayars JE, Nakayama FS. Micro-irrigation for crop production. Amsterdam: Elsevier; 2007.
- Al-Shamrani T, Al-Bishi S. Evaluating traditional water-harvesting structures in the Hail region: a pilot assessment. Arabian Journal of Geosciences. 2020;13(18):924.
- Alhajhoj MR, Munir M. Drip irrigation scheduling for greenhouse tomato in Saudi Arabia using soil moisture sensors. Saudi Journal of Biological Sciences. 2022;29(5):3223-3231.
- Allen RG, Pereira LS, Raes D, Smith M. Crop evapotranspiration: guidelines for computing crop water requirements. FAO Irrigation and Drainage Paper 56. Rome: FAO; 1998.
- Ayers RS, Westcot DW. Water quality for agriculture. FAO Irrigation and Drainage Paper 29. Rome: FAO; 1985.
- Howell TA. Enhancing water use efficiency in irrigated agriculture. Agronomy Journal. 2001;93(2):281-289.
- Narayanamoorthy A. Drip irrigation in India: can it solve water scarcity? Water Policy. 2004;6(2):117-130.
- Xie Z, Wang Y, Jiang W, Wei X. Evaporation and evapotranspiration in a watermelon field mulched with gravel of different sizes. Agricultural Water Management. 2006;81(1-2):173-184.
- Bresler E, McNeal BL, Carter DL. Saline and sodic soils: principles, dynamics, modelling. Berlin: SpringerVerlag; 1982.
- Ngigi SN. What is the limit of up-scaling rainwater harvesting in a river basin? Physics and Chemistry of the Earth. 2003;28(20-27):943-956.
- Abu-Awwad AM. Water harvesting and supplemental irrigation for improving cereal yields in arid environments. Agricultural Water Management. 1997;32(3):229-240.
- Critchley W, Siegert K. Water harvesting: a manual for the design and construction of water harvesting schemes. Rome: FAO; 1991.
- Molden D, Oweis T, Steduto P, et al. Improving agricultural water productivity: between optimism and caution. Agricultural Water Management. 2010;97(4):528-535.
- Rockstrom J. Water for food and nature in droughtprone tropics: vapour shift in rain-fed agriculture. Philosophical Transactions of the Royal Society B. 2003;358(1440):1997-2009.
- Prinz D. Water harvesting: past and future. In: Pereira LS et al., editors. Sustainability of irrigated agriculture. Dordrecht: Springer; 1996. p. 137-168.
- Al-Bishi T. Conjunctive use of harvested runoff and shallow groundwater for vegetable production in Jazan. Journal of Arid Environments. 2021;188:104458.