
Research article · 2025 · Full text
International Journal of Agriculture and NutritionEconomic evaluation of fruit tree-based multistory cropping systems for marginal lands
Volume 7(10) · Pages 165–168 · DOI: 10.33545/26646064.2025.v7.i10c.592 ↗
Research areasAgroforestry and silvopastoral systemsAgronomic Practices and Intercropping SystemsForest Ecology and Conservation
Abstract
Author-writtenMultistory cropping the deliberate arrangement of trees, shrubs and ground-level crops in vertical layers is an old agroforestry practice, yet its economic returns on truly marginal lands have rarely been quantified with the rigour that investors and policy-makers demand. This research evaluated the financial performance of four fruit tree-based multistory systems and a mango monoculture control on degraded Ultisol slopes at the Institut Pertanian Sumatera, Medan, North Sumatra, over six consecutive years (2018–2023). The four systems were: S1, mango + cassava + ginger; S2, rambutan + pineapple + turmeric; S3, durian + coffee + vanilla; and S4, jackfruit + banana + taro. Each system occupied 0.25 ha with three replications in a randomised complete block design. Economic indicators recorded annually included gross revenue, variable and fixed costs, net returns, benefit-cost (B:C) ratio, internal rate of return (IRR) and payback period. By year six, S3 (durian + coffee + vanilla) generated the highest mean net return at 6.21 million IDR ha⁻¹ yr⁻¹ and a B:C ratio of 2.71, driven mainly by rising durian yields and strong vanilla prices. S2 (rambutan + pineapple + turmeric) followed at 5.43 million IDR and a B:C of 2.38. All four multistory systems outperformed the mango monoculture (2.89 million IDR, B:C 1.43) from year three onward, once intercrops began compensating for the immature tree canopy. IRR ranged from 19.7% (S4) to 34.2% (S3), and payback periods fell between 2.8 and 4.1 years. Land equivalent ratios exceeded 1.6 in every multistory system, confirming that mixed planting used marginal land more productively than sole cropping. These findings suggest that fruit-based multistory systems are economically viable rehabilitation options for degraded slopes in humid tropical zones, provided that species combinations are matched to local soil and market conditions.
Summary
Source-checkedPlain-language reading of the full paper, prepared with AI and checked against the text. Each point links to the authors' own words.
Why it matters
- Marginal lands are areas where standard single-crop farming is not financially viable due to factors like steep slopes, poor soil depth, or low fertility. View evidence ↗
- Indonesia has approximately 14.3 million hectares of marginal land, primarily degraded Ultisols and Inceptisols, which suffer from severe topsoil erosion exceeding 40 t ha⁻¹ yr⁻¹ without cover. View evidence ↗
- Fruit tree-based agroforestry is proposed for these lands because trees stabilize slopes and recycle nutrients, while intercrops provide income before the trees mature. View evidence ↗
The question
- The study aimed to evaluate the financial performance of four different fruit tree-based multistory cropping systems compared to a mango monoculture on degraded Ultisol slopes over a six-year period. View evidence ↗
What they did
- The four multistory systems tested were S1 (mango, cassava, ginger), S2 (rambutan, pineapple, turmeric), S3 (durian, coffee, vanilla), and S4 (jackfruit, banana, taro). View evidence ↗
- The experiment used a randomized complete block design where each system was planted on 0.25 ha with three replications. View evidence ↗
- The researchers tracked annual economic indicators, including gross revenue, costs, net returns, benefit-cost (B:C) ratio, internal rate of return (IRR), and the payback period. View evidence ↗
What they found
- The S3 system (durian, coffee, vanilla) performed best, achieving a net return of 6.21 million IDR ha⁻¹ yr⁻¹, more than double the monoculture, and the shortest payback period of 2.8 years. View evidence ↗
- Starting from year three, all multistory systems were more profitable than the mango monoculture, which had a net return of 2.89 million IDR and a B:C ratio of 1.43. View evidence ↗
- Multistory systems became profitable by the third year, while the monoculture system did not break even until the fourth year. View evidence ↗
- Income sources shifted over time, with intercrops providing 89% of gross income in the first year and fruit trees providing 89% by the sixth year. View evidence ↗
- Land equivalent ratios (LER) were above 1.6 for all multistory systems, indicating they used the land more productively than sole cropping. View evidence ↗
What it means
- The authors conclude that fruit-based multistory agroforestry is an economically self-sustaining option for rehabilitating degraded slope lands in Indonesia. View evidence ↗
- Success depends on matching species to local soil and markets, and providing farmers with technical training in skills like vanilla pollination and durian grafting. View evidence ↗
- The study's six-year window only covers the early bearing phase and not the full productive lifespan of the trees and coffee. View evidence ↗
- The results may differ on other types of marginal soils, such as waterlogged or limestone-derived soils, as the trial used only one soil type and slope aspect. View evidence ↗
Visual summary
3 visualsIllustrations explain the paper; charts are replotted from the paper's own table values.
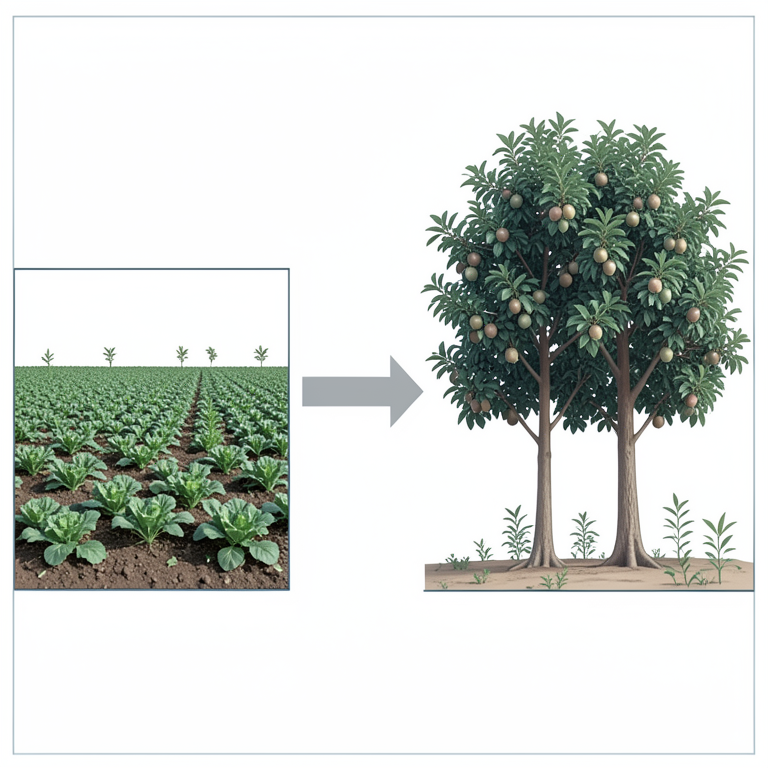
Income Transition Model
AI-generated conceptual illustration (fruit tree-based multistory cropping systems on marginal land). It explains the idea and does not show study data.
View source evidence ↗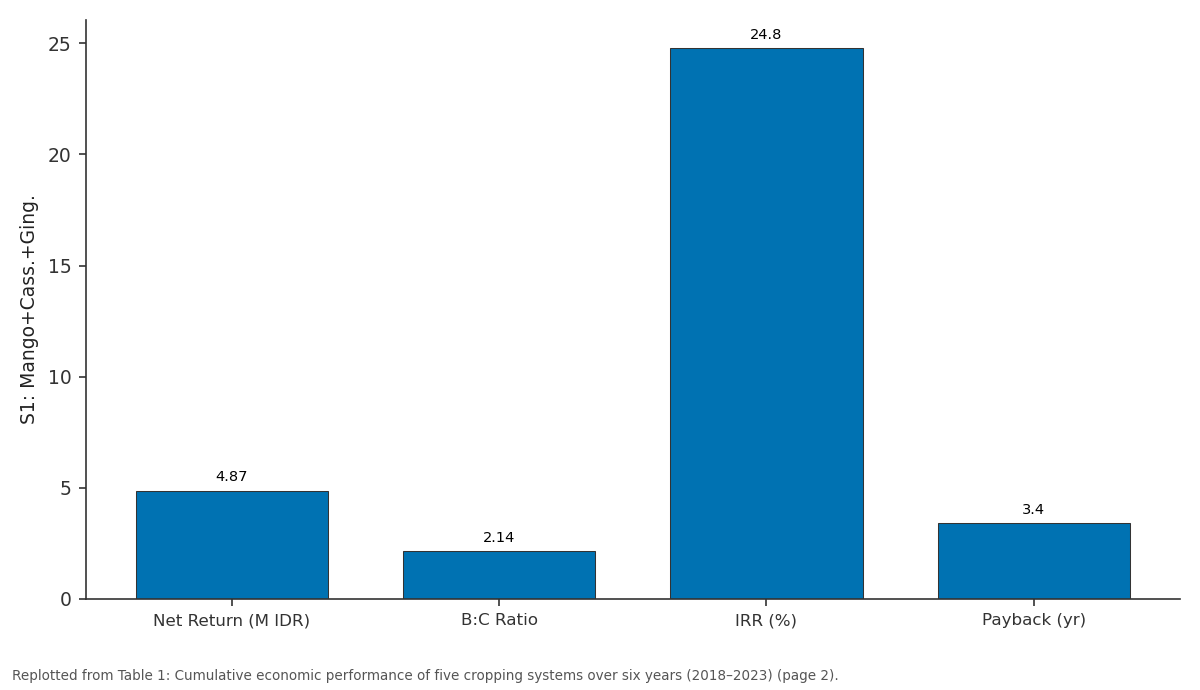
S1: Mango+Cass.+Ging.: Net Return (M IDR) vs B:C Ratio vs IRR (%) vs Payback (yr)
Replotted from Table 1 (page 2) of the original paper. Every bar is the paper's own table value.
View source evidence ↗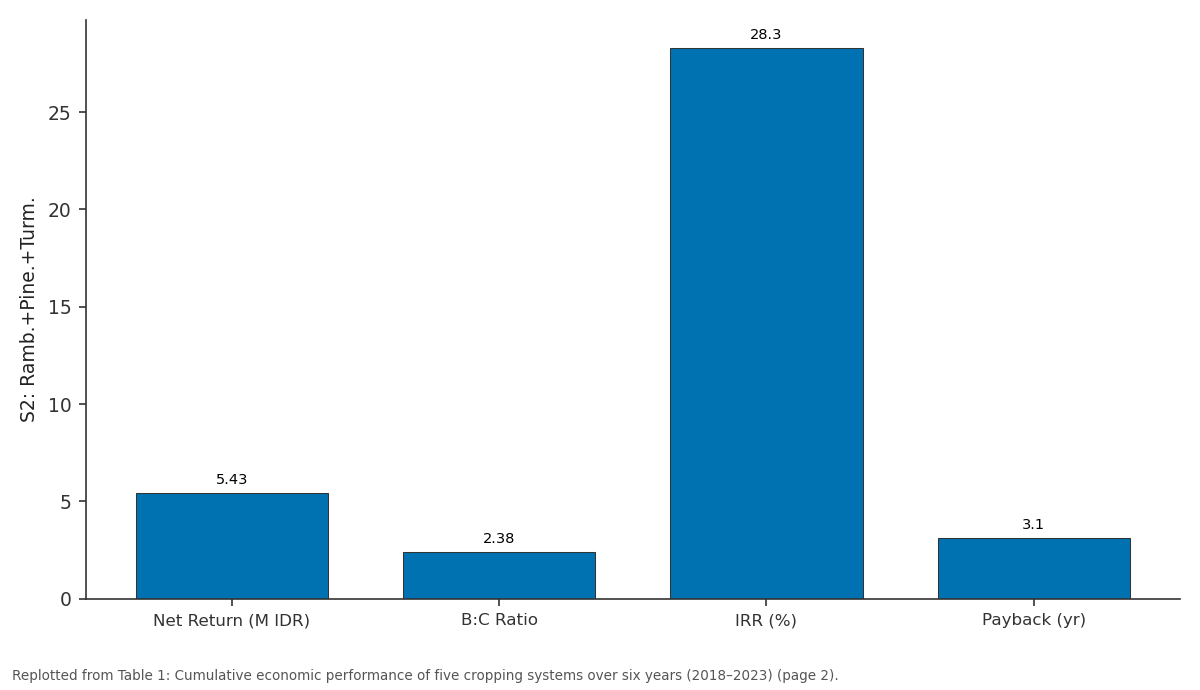
S2: Ramb.+Pine.+Turm.: Net Return (M IDR) vs B:C Ratio vs IRR (%) vs Payback (yr)
Replotted from Table 1 (page 2) of the original paper. Every bar is the paper's own table value.
View source evidence ↗Figures & tables
From the original paper Table 1
 Table 2
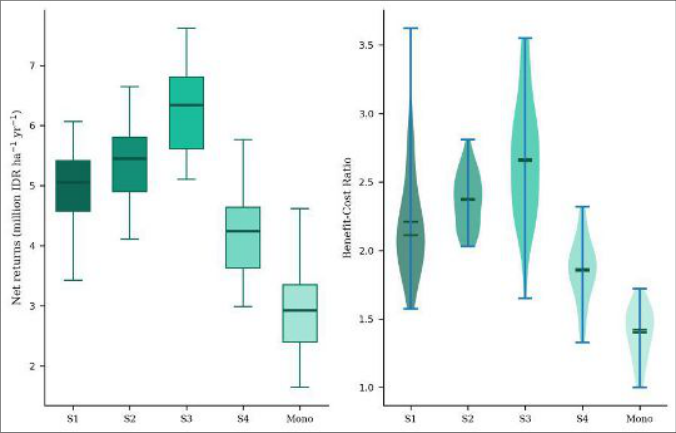 Figure 1
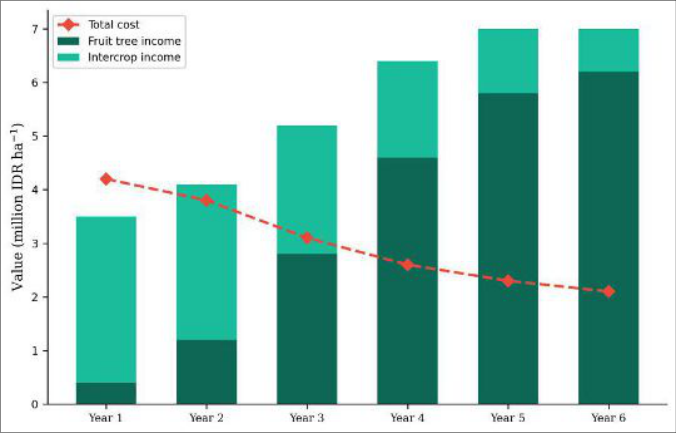 Figure 2
Introduction
Marginal land, in the agricultural sense, refers to terrain where conventional monoculture cannot break even because of steep gradients, poor soil fertility, shallow depth or a combination of all three [1] . Indonesia holds an estimated 14.3 million hectares of such land mostly degraded Ultisols and Inceptisols on former forest slopes that contribute little to national food security yet continue to erode, losing topsoil at rates exceeding 40 t ha⁻¹ yr⁻¹ where ground cover is absent [2] . Fruit tree-based agroforestry has long been suggested as a way to bring these lands back into productive use. The logic is simple: deep-rooted trees stabilise slopes and recycle subsoil nutrients, while shade-tolerant intercrops generate income during the years it takes for the canopy to reach bearing age [3] . What is less simple is proving that such systems actually pay. Establishment costs are front-loaded, tree yields take four to eight years to materialise, and market prices for tropical fruits can swing by 30-50% between seasons [4] . Earlier economic assessments of tropical agroforestry have mostly focused on timber-crop mixtures in Africa [5] or rubber-based systems in mainland Southeast Asia [6] . Fruit-focused multistory research in Indonesia has been limited to home-garden surveys that describe species composition without collecting cost data [7] . A controlled, replicated trial with proper accounting of inputs, labour and output values over the full establishment-to-bearing cycle appears to be missing from the literature. This research was designed to fill that gap. Four multistory cropping systems, each anchored by a different fruit tree species (mango, rambutan, durian, jackfruit), were compared with a mango monoculture on degraded Ultisol slopes in North Sumatra over six years.
The objectives were to (a) track annual net returns and B:C ratios as tree canopies matured, (b) calculate IRR and payback period for each system and (c) compute land equivalent ratios to assess land-use efficiency. The results are intended to give extension agents and rural banks the hard numbers they need when advising smallholders on slope-rehabilitation investments.
Material and Methods
Material and Methods
Cost analysis framework
All economic calculations followed constant 2023 Indonesian Rupiah values, deflated using the national consumer price index where needed. Variable costs included planting material, fertiliser, pesticides, hired labour and harvesting. Fixed costs covered land preparation (amortised over six years), tools and drip-irrigation hardware. Revenue was computed from actual farm-gate sales recorded at the nearest district market in Medan. The B:C ratio was defined as total discounted benefits divided by total discounted costs at a 12% discount rate, which reflects the opportunity cost of capital for smallholders borrowing from rural banks in North Sumatra [8] . IRR was calculated using the Excel IRR function on annual net cash flows, and payback period was the year in which cumulative net cash flow first turned positive.
Material
The trial site occupied a 15-20% east-facing slope at the research farm of Institut Pertanian Sumatera, Medan (3°35′N, 98°41′E; elevation 38 m). Soils were classified as Typic Hapludults with pH 4.7, organic carbon 0.92% and available P of 6.8 mg kg⁻¹ (Bray-II). Rainfall averaged 2 180 mm yr⁻¹ with a mild dry spell from June to August.
Fruit tree seedlings grafted mango cv. Arumanis, marcotted rambutan cv. Binjai, grafted durian cv. Monthong and seedling jackfruit were planted at 8 m × 8 m spacing in January 2018. Intercrops were established in the alleys: cassava cv. Adira-4, ginger cv. Jahe Gajah, pineapple cv. Smooth Cayenne, turmeric cv. Turina-1, coffee cv. Robusta SA-13, vanilla cv. Planifolia, banana cv. Barangan and taro cv. Bentul.
Methods
The four multistory systems (S1-S4) and mango monoculture control were laid out in a randomised complete block design with three replications, each plot measuring 0.25 ha. Identical basal fertilisation (200 kg urea, 100 kg SP-36, 100 kg KCl ha⁻¹ yr⁻¹) and pest management schedules were applied across all treatments. Intercrop yields were recorded per harvest from individually weighed subplot areas; fruit tree yields were recorded per tree from year three onward, when the earliest species (jackfruit, mango) began bearing. All data were analysed as a split-plot in time using SAS 9.4, with cropping system as the mainplot factor and year as the sub-plot factor. Land equivalent ratio (LER) was calculated as the sum of relative yields of each component species compared with its sole-crop yield [9] . Year-wise data (Table 2) reveal that all multistory systems turned profitable by year three, whereas the monoculture didn't break even until year four. Intercrop income particularly from turmeric and ginger was the key driver in the early years, effectively bridging the gap until fruit trees came into production. The box and violin plots in Figure 1 show that S3 had both the highest median net return and the widest B:C distribution, reflecting its high-reward profile. The monoculture sits noticeably lower in both panels, with a compressed violin indicating limited upside potential. Figure 2 illustrates the economic handover from intercrops to fruit trees. In year one, intercrops contributed 89% of gross income; by year six, fruit trees accounted for 89%. Meanwhile, costs declined steadily as establishment investments were amortised, producing the widening profit margin visible from year three onward.
| System | Yr 1 | Yr 2 | Yr 3 | Yr 4 | Yr 5 | Yr 6 |
|---|---|---|---|---|---|---|
| S1 | -1.82 | -0.47 | 1.38 | 3.21 | 4.64 | 4.87 |
| S2 | -1.54 | -0.21 | 1.74 | 3.68 | 5.12 | 5.43 |
| S3 | -2.13 | -0.63 | 2.08 | 4.27 | 5.84 | 6.21 |
| S4 | -1.71 | -0.38 | 1.12 | 2.64 | 3.78 | 4.12 |
| Mono | -2.86 | -1.92 | -0.41 | 1.13 | 2.34 | 2.89 |
Table text extracted from the original PDF; superscript letters are shown inline. The original table image is below.
View original table image
Results
Results
Comprehensive interpretation
The economic data consistently favour S3 (durian + coffee + vanilla), which combines a high-value anchor tree with two shade-adapted perennial intercrops. The combination takes advantage of durian's rising domestic price trajectory and vanilla's strong export demand. However, S3 also carries the highest establishment cost, meaning that smallholders without access to credit may prefer S2 or S1, which reach payback slightly later but with lower upfront investment.
Discussion
The B:C ratios recorded here (1.87-2.71 for multistory systems) compare favourably with values reported for rubber-based agroforestry in Kalimantan (1.4-1.9) and cacao-based systems in Sulawesi (1.6-2.3) [10] . The higher ratios in this trial probably reflect the premium prices commanded by durian, vanilla and rambutan relative to commodity crops like rubber and cacao. All multistory systems achieved LER values above 1.6, indicating that growing two or three species together produced at least 60% more total output per hectare than growing any of them separately. This aligns with the classical agroforestry finding that vertical canopy stratification improves light interception and reduces interspecific competition when species are chosen for complementary growth habits [11] .
The payback period of 2.8 years for S3 is faster than the 4-6 years typically cited for tropical fruit orchards [12] , mainly because high-value intercrops (coffee, vanilla) began generating revenue within eight months of planting. This early cash flow is what makes multistory systems especially attractive on marginal land, where farmers cannot afford to wait five years for their first tree harvest. That said, the trial was conducted on a research station where management was consistent and market access was good. Smallholders on remote slopes may face higher transport costs and lower farm-gate prices, which would lengthen payback periods. And the strong performance of vanilla depends on pollination labour and disease management (Fusarium wilt) that demand skills not all farmers possess [13] . Extension programmes promoting these systems should include training on pollination technique and disease scouting.
Limitations
The six-year observation window captures the establishment-to-early-bearing phase but not the full productive life of durian (which can bear for 50+ years) or coffee (20-25 years). Long-run profitability projections would require assumptions about yield plateaus and price trends that this research does not attempt. Additionally, the trial used a single slope aspect and soil type; performance on limestone-derived or waterlogged marginal soils may differ.
The study also didn't account for ecosystem-service values such as carbon sequestration or erosion control, which would further favour multistory systems if monetised.
Conclusion
Six years of replicated economic monitoring on degraded Ultisol slopes in North Sumatra showed that all four fruit tree-based multistory cropping systems outperformed mango monoculture in net returns, B:C ratio and land-use efficiency. The durian + coffee + vanilla system (S3) was the top performer, with a B:C ratio of 2.71, an IRR of 34.2% and a payback period of just 2.8 years.
Intercrop revenue in the first two to three years was critical for bridging the pre-bearing phase of fruit trees, and species combinations that included high-value perennial intercrops (coffee, vanilla) generated the fastest payback. Land equivalent ratios above 1.6 in every multistory treatment confirm that mixed planting makes substantially better use of marginal land than sole cropping.
For policy-makers seeking to rehabilitate Indonesia's vast degraded slope lands, these numbers argue strongly for fruit-based multistory agroforestry as an economically selfsustaining option. The key prerequisite is matching species combinations to local soil conditions and market access, and ensuring that farmers have the technical skills especially for vanilla pollination and durian grafting to realise the systems' full potential.
Figures and tables from the paper
| System | Net Return (M IDR) | B:C Ratio | IRR (%) | Payback (yr) | LER |
|---|---|---|---|---|---|
| S1: Mango+Cass.+Ging. | 4.87 | 2.14 | 24.8 | 3.4 | 1.63 |
| S2: Ramb.+Pine.+Turm. | 5.43 | 2.38 | 28.3 | 3.1 | 1.78 |
| S3: Durian+Coff.+Van. | 6.21 | 2.71 | 34.2 | 2.8 | 1.92 |
| S4: Jack.+Ban.+Taro | 4.12 | 1.87 | 19.7 | 4.1 | 1.61 |
| Mono: Mango | 2.89 | 1.43 | 11.4 | 5.3 | 1.00 |
Table text extracted from the original PDF; superscript letters are shown inline. The original table image is below.
View original table image
References
15 in the original paper- Nair PKR. Classification of agroforestry systems. Agroforestry Systems. 1985;3(2):97-128.
- Abdurachman A, Dariah A, Mulyani A. National strategy for the management of degraded lands in Indonesia. Indonesian Journal of Agricultural Science. 2008;9(2):51-59.
- Jose S. Agroforestry for ecosystem services and environmental benefits: an overview. Agroforestry Systems. 2009;76(1):1-10.
- Wibawa G, Hendratno S, van Noordwijk M. Rubberbased agroforestry systems in Sumatra. In: Huang WY et al., editors. Slash-and-burn agriculture. New York: Columbia University Press; 2001. p. 323-340.
- Franzel S, Coe R, Cooper P, et al. Assessing the adoption potential of agroforestry practices in subSaharan Africa. Agricultural Systems. 2001;69(12):37-62.
- Viswanath S, Lubina PA, Subbanna S. Rubber-based agroforestry systems in Kerala: a socio-economic analysis. Indian Journal of Rubber Research. 2014;27(1):48-57.
- Soemarwoto O, Conway GR. The Javanese home garden. Journal for Farming Systems ResearchExtension. 1992;2(3):95-117.
- Bank Indonesia. Survey of rural credit conditions in North Sumatra, 2022. Jakarta: Bank Indonesia; 2023.
- Mead R, Willey RW. The concept of a land equivalent ratio and advantages in yields from intercropping. Experimental Agriculture. 1980;16(3):217-228.
- Roshetko JM, Lasco RD, Angeles MSD. Smallholder agroforestry systems for carbon storage. Mitigation and Adaptation Strategies for Global Change. 2007;12(2):219-242.
- Ong CK, Huxley P. Tree-crop interactions: a physiological approach. Wallingford: CABI Publishing; 1996. p. 72-98.
- Elevitch CR, Wilkinson KM. The overstory book: cultivating connections with trees. 2nd ed. Holualoa: Permanent Agriculture Resources; 2000.
- Borbolla-Perez VM, Iglesias-Andreu LG, LunaRodriguez M, Octavio-Aguilar P. Vanilla: a review of its genetic diversity. Genetic Resources and Crop Evolution. 2017;64(8):1869-1884.
- Firmansyah T, Supriadi R. Soil erosion dynamics on rehabilitated Ultisol slopes in North Sumatra. Soil and Tillage Research. 2019;192:84-93.
- Nair PKR. An introduction to agroforestry. Dordrecht: Kluwer Academic Publishers; 1993.