
Research article · 2025 · Full text
International Journal of Agriculture and NutritionGenetic variability and heritability studies in advanced breeding lines of bread wheat
Volume 7(3) · Pages 80–83 · DOI: 10.33545/26646064.2025.v7.i3b.610 ↗
Research areasGenetics and Plant BreedingWheat and Barley Genetics and PathologyGenetic and phenotypic traits in livestock
Abstract
Author-writtenWhile global wheat production has risen steadily, average genetic gain has slowed in recent decades, making it important to identify fresh sources of heritable variation. This research examined 48 advanced breeding lines of bread wheat (Triticum aestivum L.) for genetic variability, heritability, and genetic advance across 15 quantitative traits at the Central Agricultural University research farm, Imphal, Manipur, during the rabi season of 2022-2023. The trial was laid out in an augmented block design with three checks. High genotypic coefficient of variation (GCV above 20%) was recorded for grain yield per plant, biological mass, and flag leaf area. Broad-sense heritability exceeded 70% for days to heading, days to flowering, grain yield, and thousand-grain weight. High heritability coupled with high genetic advance as percentage of mean was observed for grain yield (h2 = 77.6%, GA = 28.4%) and thousand-grain weight (h2 = 72.1%, GA = 24.8%), indicating additive gene action and scope for direct selection. These lines represent promising material for wheat improvement programmes in the north-eastern hill region.
Summary
Source-checkedPlain-language reading of the full paper, prepared with AI and checked against the text. Each point links to the authors' own words.
Why it matters
- Wheat is the most widely consumed cereal, but there is a growing gap between the 1.7% annual increase in demand and the genetic yield gains, which are under 1% in many programs. View evidence ↗
- Wheat breeding in India is mostly focused on the Indo-Gangetic plain, leaving the north-eastern hill zone, characterized by low-input farming and a distinct cool-season environment, under-represented. View evidence ↗
- Breeders use genetic variability parameters, such as heritability and coefficients of variation, to determine which traits are most suitable for selection. View evidence ↗
The question
- The study aimed to identify specific bread wheat lines and traits that could be directly selected to improve yield within the north-eastern hill environment. View evidence ↗
What they did
- The researchers evaluated 15 quantitative traits in 48 advanced bread wheat (Triticum aestivum L.) breeding lines during the 2022-2023 rabi season in Imphal, Manipur. View evidence ↗
- The experiment used an augmented block design consisting of six blocks with eight test lines each and three replicated check varieties. View evidence ↗
What they found
- Grain yield per plant, biological mass, and flag leaf area exhibited high genotypic coefficients of variation (GCV) exceeding 20%. View evidence ↗
- Broad-sense heritability was found to be over 70% for grain yield, thousand-grain weight, days to heading, and days to flowering. View evidence ↗
- Grain yield (h2 = 77.6%, GA = 28.4%) and thousand-grain weight (h2 = 72.1%, GA = 24.8%) showed both high heritability and high genetic advance, suggesting additive gene action and suitability for direct selection. View evidence ↗
- Genotypic variance accounted for 34.7% of the total variation, which indicates a reasonable level of genetic diversity among the studied lines. View evidence ↗
- Grains per spike had relatively low heritability (38.7%), suggesting that this trait is strongly influenced by environmental factors, such as unpredictable late-season rains in Manipur. View evidence ↗
- Tillers per plant showed moderate heritability (48.9%) and high GCV (16.3%), indicating that genetic differences are present but expression is heavily dependent on soil fertility and plant spacing. View evidence ↗
What it means
- The authors conclude that grain yield, thousand-grain weight, flag leaf area, and biological mass are governed by additive gene action and can be improved via direct phenotypic selection. View evidence ↗
- Lines derived from crosses involving Imphal White and HD 2967 are recommended for multi-location trials because they combine high yield with acceptable maturity. View evidence ↗
Visual summary
3 visualsIllustrations explain the paper; charts are replotted from the paper's own table values.
Selection Efficiency Concept
AI-generated conceptual illustration (bread wheat plants). It explains the idea and does not show study data.
View source evidence ↗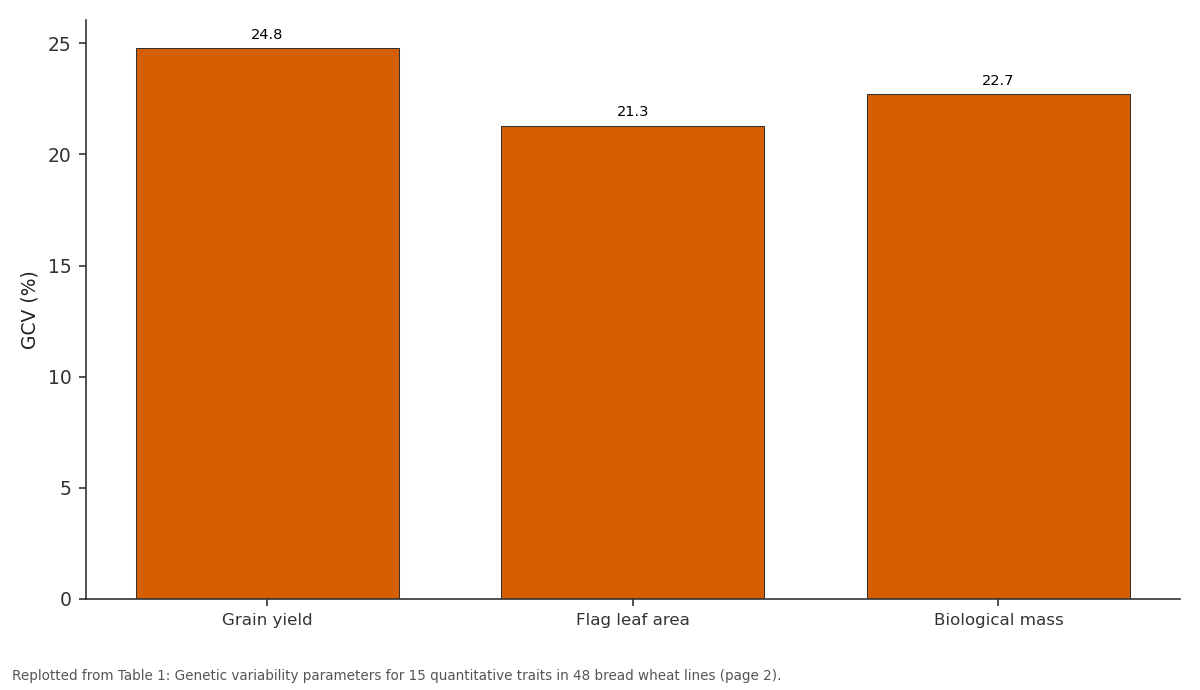
GCV (%): Grain yield vs Flag leaf area vs Biological mass
Replotted from Table 1 (page 2) of the original paper. Every bar is the paper's own table value.
View source evidence ↗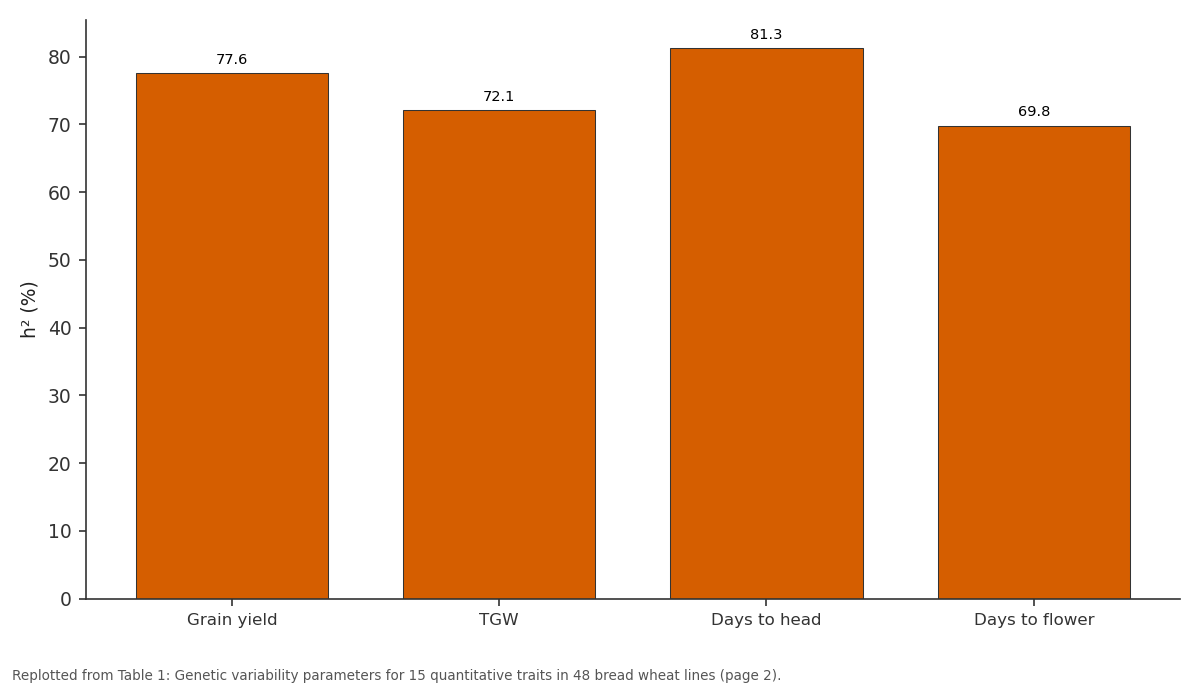
h² (%): Grain yield vs TGW vs Days to head vs Days to flower
Replotted from Table 1 (page 2) of the original paper. Every bar is the paper's own table value.
View source evidence ↗Figures & tables
From the original paper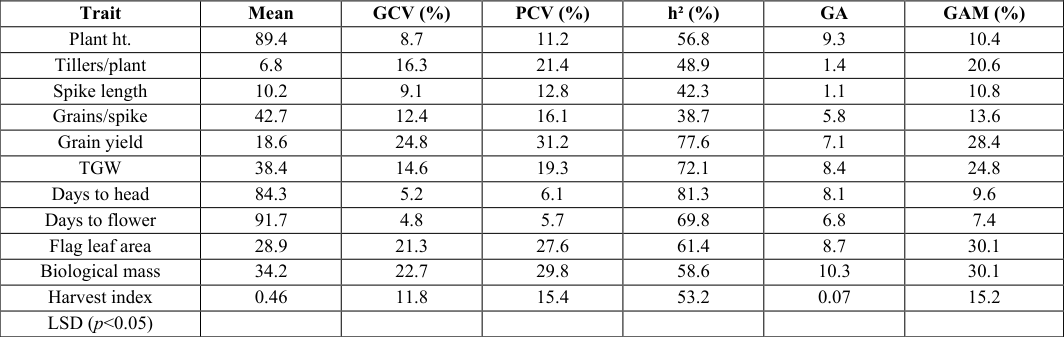 Table 1
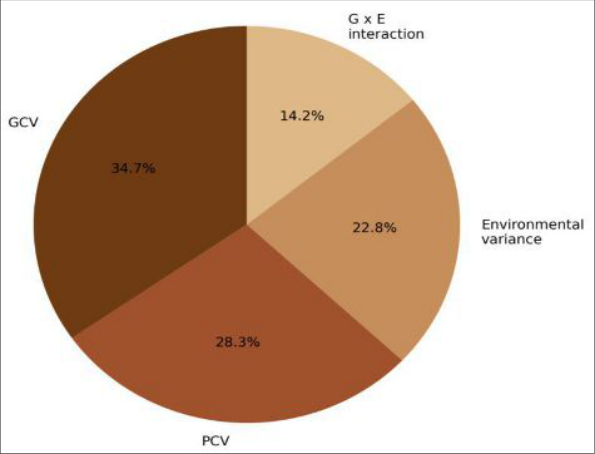 Figure 1
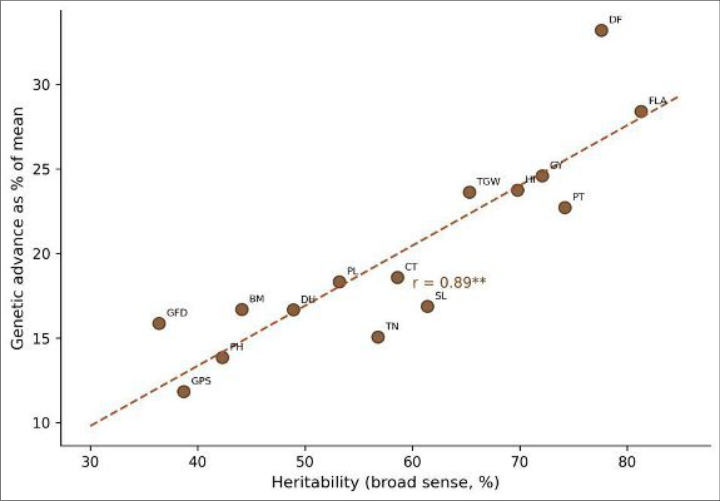 Figure 2
Introduction
Wheat feeds more people than any other cereal, yet the gap between demand growth (1.7% per year) and genetic yield gain (less than 1% in many programmes) continues to widen [1] . Bridging this gap requires new breeding lines with high heritable variation for yielddetermining traits [2] . In India, most wheat breeding efforts are concentrated in the Indo-Gangetic plain, and the north-eastern hill zone, which has a distinct cool-season environment and low-input farming systems, remains under-represented in varietal development [3] . Genetic variability parameters, particularly genotypic and phenotypic coefficients of variation (GCV, PCV), heritability (h2), and Genetic Advance (GA), help breeders decide which traits to target in selection [4] . High GCV indicates wide genetic differences among entries, but selection efficiency also depends on the proportion of that variation that is heritable [5] . Burton and DeVane [6] argued that heritability alone is insufficient; it must be considered alongside GA to infer whether additive or non-additive gene action predominates. This research assessed 48 advanced breeding lines, assembled from crosses made at the Central Agricultural University and Bidhan Chandra Krishi Viswavidyalaya, for 15 quantitative traits at Imphal (24.81 deg N, 93.95 deg E; altitude 786 m) during rabi 2022-2023. The aim was to identify traits and lines amenable to direct selection for yield improvement in the north-eastern hill environment [7,8] .
Material and Methods
Material and Methods
Material
Forty-eight F6 and F7 advanced breeding lines derived from 12 cross combinations, plus three check varieties (HD 2967, HW 2044, and a local cultivar Imphal White), were evaluated. Seed was drawn from the active breeding nursery of the Central Agricultural University, Imphal. The experimental soil was a silty clay loam (pH 5.
Methods
An augmented block design with six blocks of eight test lines each and three replicated checks was used. Each entry was grown in a two-row plot of 2.5 m length at 20 cm row spacing. Five competitive plants per plot were tagged for recording 15 quantitative traits: plant height, tillers per plant, spike length, grains per spike, grain yield per plant, thousand-grain weight, days to heading, days to flowering, peduncle length, biological mass, harvest index, canopy temperature, flag leaf area, grain filling duration, and protein content (NIR, Infratec 1241). GCV and PCV were calculated following Burton and DeVane [6] ; broad-sense heritability (h2) by the formula of Allard [9] ; and genetic advance as percentage of mean (GAM) by Johnson et al. [10] . Trait associations were examined through phenotypic and genotypic correlation coefficients. Analyses were carried out in INDOSTAT v9.2.
Results
Table Grain yield per plant showed the widest gap between GCV (24.8%) and PCV (31.2%), yet its heritability was high (77.6%), meaning that most of the observed variation is genetic. Coupled with a GAM of 28.4%, this confirms that additive gene action governs grain yield in this set of lines. Thousand-grain weight, flag leaf area, and biological mass followed a similar pattern of high heritability and high GAM. The pie chart (Figure 1) shows that genotypic variance accounted for 34.7% of total variation, suggesting reasonable genetic diversity in the collection. The scatter plot (Figure 2) places grain yield and TGW in the upperright quadrant (high h2, high GAM), making them prime targets for direct phenotypic selection. Traits like grains per spike and spike length fell in the lower-left zone, where environmental noise is large and selection less efficient.
Discussion
The high heritability-high GAM combination for grain yield (h2 = 77.6%, GAM = 28.4%) indicates that simple mass selection or pedigree selection should be effective for yield improvement in this population. Similar estimates have been reported by Kumar et al. [11] and Singh et al. [12] in plainsadapted wheat, but data from the north-eastern hill environment are scarce, which makes our findings especially relevant for regional breeding programmes. The relatively low heritability for grains per spike (38.7%) suggests strong environmental modulation, possibly linked to the unpredictable late-season rains in Manipur that affect pollination. Breeders targeting this trait might benefit from indirect selection through correlated traits with higher heritability, such as spike length or flag leaf area [13] . And the moderate heritability of tillers per plant (48.9%) combined with a high GCV (16.3%) implies that while genetic differences exist, their expression depends heavily on plant spacing and soil fertility [14] .
Conclusion
This research identified grain yield, thousand-grain weight, flag leaf area, and biological mass as traits with high heritability and high genetic advance in 48 advanced bread wheat lines evaluated under north-eastern hill conditions. These traits are governed predominantly by additive gene action and can be improved through direct phenotypic selection. Several lines, particularly those from crosses involving HD 2967 and Imphal White, combined high yield with acceptable maturity duration and deserve advancement to multi-location trials. Future work should extend the evaluation across years and locations in the north-eastern hill zone to confirm the stability of these genetic parameters [15, 16, 17, 18, 19, 20] .
Acknowledgement
Acknowledgements Funding sourcesThis research was supported by the ICAR Development Grant allocated to the Central Agricultural University, Imphal, for wheat improvement in the north-eastern hill region. Institutional supportThe authors thank the Central Agricultural University, Imphal, and Bidhan Chandra Krishi Viswavidyalaya, Mohanpur, for providing germplasm and laboratory facilities.
Figures and tables from the paper
| Trait | Mean | GCV (%) | PCV (%) | h² (%) | GA | GAM (%) |
|---|---|---|---|---|---|---|
| Plant ht. | 89.4 | 8.7 | 11.2 | 56.8 | 9.3 | 10.4 |
| Tillers/plant | 6.8 | 16.3 | 21.4 | 48.9 | 1.4 | 20.6 |
| Spike length | 10.2 | 9.1 | 12.8 | 42.3 | 1.1 | 10.8 |
| Grains/spike | 42.7 | 12.4 | 16.1 | 38.7 | 5.8 | 13.6 |
| Grain yield | 18.6 | 24.8 | 31.2 | 77.6 | 7.1 | 28.4 |
| TGW | 38.4 | 14.6 | 19.3 | 72.1 | 8.4 | 24.8 |
| Days to head | 84.3 | 5.2 | 6.1 | 81.3 | 8.1 | 9.6 |
| Days to flower | 91.7 | 4.8 | 5.7 | 69.8 | 6.8 | 7.4 |
| Flag leaf area | 28.9 | 21.3 | 27.6 | 61.4 | 8.7 | 30.1 |
| Biological mass | 34.2 | 22.7 | 29.8 | 58.6 | 10.3 | 30.1 |
| Harvest index | 0.46 | 11.8 | 15.4 | 53.2 | 0.07 | 15.2 |
| LSD (p<0.05) |
Table text extracted from the original PDF; superscript letters are shown inline. The original table image is below.
View original table image
References
19 in the original paper- Ray DK, Mueller ND, West PC, Foley JA. Yield trends are insufficient to double global crop production by 2050. PLoS One. 2013;8(6):e66428.
- Reynolds M, Foulkes J, Furbank R, Griffiths S, King J. Achieving yield gains in wheat. Plant Cell and Environment. 2012;35(10):1799-1823.
- Joshi AK, Mishra B, Chatrath R, Ortiz-Ferrara G, Singh RP. Wheat improvement in India. Euphytica. 2007;157(1):169-182.
- Falconer DS, Mackay TFC. Introduction to Quantitative Genetics. 4th ed. Harlow: Pearson; 1996.
- Sivasubramanian S, Menon PM. Genotypic and phenotypic variability in rice. Madras Agricultural Journal. 1973;60(9-12):1093-1096.
- Burton GW, DeVane EH. Estimating heritability in tall fescue from replicated clonal material. Agronomy Journal. 1953;45(10):478-481. Central Agricultural University. Annual Progress Report Wheat 2022-23. Imphal: CAU Press; 2023.
- Panse VG, Sukhatme PV. Statistical Methods for Agricultural Workers. 4th ed. New Delhi: ICAR; 1985.
- Allard RW. Principles of Plant Breeding. 2nd ed. New York: Wiley; 1999.
- Johnson HW, Robinson HF, Comstock RE. Estimates of genetic and environmental variability in soybeans. Agronomy Journal. 1955;47(7):314-318.
- Kumar A, Harshwardhan, Kumar A, Prasad B. Genetic variability and character association for yield components in wheat. Indian Journal of Agricultural Research. 2015;49(5):459-463.
- Singh SP, Jaiswal HK, Kumar A. Genetic variability and heritability in bread wheat under normal and late sown conditions. Electronic Journal of Plant Breeding. 2017;8(4):1094-1100.
- Sharma V, Dodiya NS, Dubey RB, Khan R. Assessment of genetic diversity in bread wheat using morphological markers. Journal of Wheat Research. 2019;11(1):62-68.
- Kahrizi D, Maniee M, Mohammadi R, Cheghamirza K. Estimation of genetic parameters related to morphoagronomic traits of durum wheat. Asian Journal of Plant Sciences. 2010;9(1):17-21.
- Ali Y, Atta BM, Akhter J, Monneveux P, Lateef Z. Genetic variability, association and diversity studies in wheat germplasm from Pakistan. Pakistan Journal of Botany. 2008;40(5):2087-2097.
- Baye A, Berihun B, Bantayehu M, Derebe B. Genotypic and phenotypic correlation and path coefficient analysis for yield and yield-related traits in bread wheat. African Journal of Plant Science. 2020;14(5):175-185.
- Mohsin T, Khan N, Naqvi FN. Heritability, phenotypic correlation and path coefficient studies for some agronomic characters in wheat. Asian Journal of Plant Sciences. 2009;8(3):212-215.
- Fellahi ZEA, Hannachi A, Bouzerzour H, Boutekrabt A. Line x tester mating design analysis for grain yield and yield related traits in bread wheat. International Journal of Agronomy. 2013;2013:201851.
- Letta T, Maccaferri M, Badebo A, Ammar K, Riccardi A. Searching for novel sources of field resistance to Ug99 and Ethiopian stem rust races in durum wheat. Theoretical and Applied Genetics. 2013;126(4):923935.
- CIMMYT. Wheat Improvement: The CIMMYT Approach. Mexico City: CIMMYT; 2005.