
Research article · 2026 · Full text
International Journal of Agriculture and NutritionDistribution Analysis of Soil Organic Carbon Fractions across Different Soil Textures in Panipat District
Volume 8(4) · Pages 97–101 · DOI: 10.33545/26646064.2026.v8.i4a.596 ↗
Research areasSoil Carbon and Nitrogen DynamicsSoil Geostatistics and MappingSoil Management and Crop Yield
Abstract
Author-writtenThis study investigated the distribution of soil organic carbon (SOC) fractions across different soil textures in the Panipat district of Haryana, India. A total of 250 soil samples from five blocks were analyzed for SOC fractions viz. Very Labile Carbon (VLC), Labile Carbon (LC), Less Labile Carbon (LLC), and Recalcitrant Carbon (RC). Soil textures were classified as sandy loam, loamy sand, loam, and clay loam, with clay loam being the dominant texture. The results indicate that finer-textured soils, such as clay loam, have higher proportions of stable carbon fractions (LLC and RC), contributing to long-term carbon sequestration and soil structural stability. Conversely, sandy loam soils exhibited higher labile carbon fractions (VLC and LC), reflecting a more dynamic organic matter turnover. The overall organic carbon content was predominantly medium, influenced by the semi-arid climate and the prevalent rice-wheat cropping system. The spatial variability of soil texture across blocks significantly affected the SOC fraction distribution, underscoring the need for texture-specific soil management practices. Recommendations include enhancing organic inputs and minimizing decomposition in sandy soils, while preserving the soil structure in clay loam soils to maintain carbon stability. This study provides critical insights into sustainable soil fertility management and carbon sequestration strategies in semi-arid agroecosystems.
Summary
Source-checkedPlain-language reading of the full paper, prepared with AI and checked against the text. Each point links to the authors' own words.
Why it matters
- Soil organic carbon (SOC) is essential for maintaining soil fertility and structure, and it helps mitigate climate change by sequestering carbon. View evidence ↗
- Soil texture is a key factor that determines how organic matter is stabilized and decomposed in the soil. View evidence ↗
- In semi-arid regions like Panipat, high temperatures and low rainfall speed up the decomposition of organic matter and limit carbon inputs, making soil management difficult. View evidence ↗
The question
- The study aimed to investigate how different soil textures in the Panipat district affect the spatial distribution of soil organic carbon (SOC) fractions. View evidence ↗
- The researchers sought to understand the influence of soil texture on the amount and stability of SOC pools within the region's specific semi-arid conditions and cropping systems. View evidence ↗
What they did
- The researchers collected 250 random soil samples from five blocks at a depth of 0-15 cm. View evidence ↗
- Soil textures were classified into five categories (clay loam, loam, loamy sand, sand, and sandy loam) using the feel method. View evidence ↗
- SOC fractions were analyzed using the Walkley-Black wet oxidation technique with different concentrations of sulfuric acid to separate the carbon pools. View evidence ↗
What they found
- Clay loam was the most common soil texture among the 250 samples, appearing 95 times. View evidence ↗
- Sandy loam soils had the highest mean Very Labile Carbon (0.09%), while clay loam soils had the lowest (0.05%). View evidence ↗
- The highest mean Less Labile Carbon was found in loam soils (0.22%), followed by clay loam (0.21%). View evidence ↗
- Recalcitrant Carbon was most abundant in clay loam soils (mean 0.45%) and least abundant in sandy loam soils (mean 0.22%). View evidence ↗
- Total Organic Carbon (TOC) increased with finer textures, with the lowest mean in sandy loam (0.53%) and the highest in clay loam (0.84%). View evidence ↗
- About 74.6% of the analyzed soil samples were classified as having a medium level of organic carbon. View evidence ↗
What it means
- The authors recommend residue retention and cover cropping for sandy loam soils to increase carbon, while emphasizing the prevention of erosion in clay loam soils to preserve stable carbon. View evidence ↗
- The study concludes that soil texture is a significant driver of the distribution and stability of SOC fractions in the Panipat district. View evidence ↗
- The authors state that future research should integrate land use, cropping patterns, and management interventions to better understand carbon cycling. View evidence ↗
Visual summary
1 visualsIllustrations explain the paper; they do not show study data.
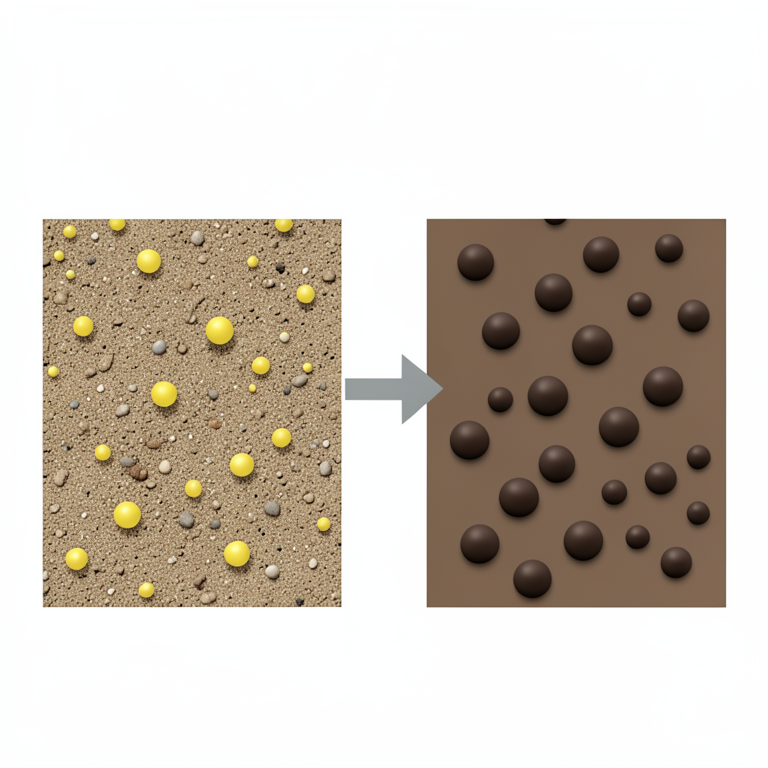
Carbon Fraction Distribution by Texture
AI-generated conceptual illustration (Soil profiles of sandy loam and clay loam textures). It explains the idea and does not show study data.
View source evidence ↗Figures & tables
From the original paper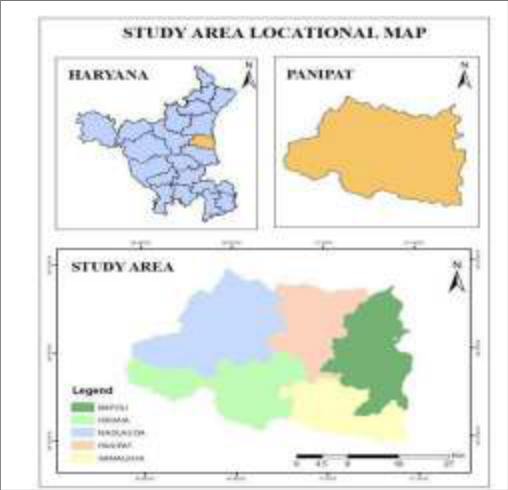 Figure 1
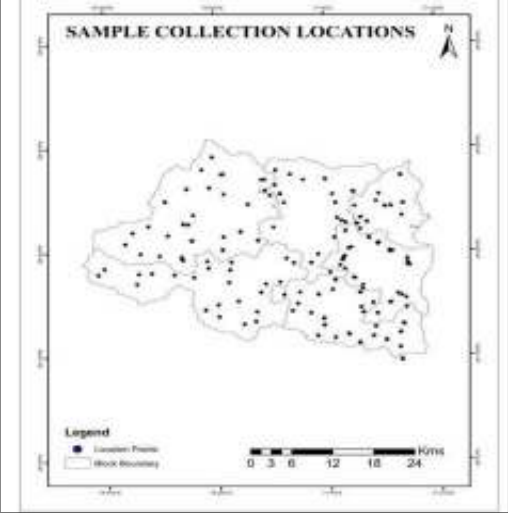 Figure 2
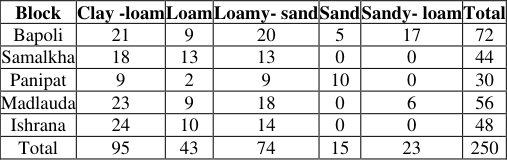 Table 1
 Table 2
Introduction
Soil organic carbon (SOC) plays a fundamental role in sustaining soil fertility, improving soil structure, and contributing significantly to climate change mitigation through carbon sequestration (Chudasama et [4,8,12,17] . The behavior and dynamics of SOC are governed by various factors, with soil texture emerging as a critical determinant because of its influence on organic matter stabilization and decomposition mechanisms (Bajgai et al., 2014; Nn et al., 2025) [2,10] . Soil textures vary widely, from coarse sandy soils to fine clayey soils, each exhibiting unique capacities to retain and protect different organic carbon fractions (Curtin et al., 2015; Plante et al., 2006) [5,13] . These variations directly impact the size, composition, and turnover rates of the soil carbon pool, thereby influencing soil productivity and carbon cycling processes (Post et al., 1996) [15] . In semi-arid agroecosystems, such as those prevalent in the Panipat district of Haryana, India, the distribution and stability of SOC fractions are particularly important. The climatic conditions in these regions, characterized by high temperatures and limited precipitation, accelerate organic matter decomposition while simultaneously restricting carbon inputs, thereby posing significant challenges for sustainable soil management (Nonomura et al., 2020; Srinivasarao et al., 2019) [11,16] . Additionally, the dominant rice-wheat cropping system influences organic carbon dynamics by providing continuous organic residue inputs. These residues interact with the physical properties of the soil, especially its texture, to modulate the potential for carbon sequestration and nutrient retention (Hu et al., 2025; Zhang et al., 2012) [7,18] . It is important to recognize that SOC is not a homogeneous entity but comprises multiple fractions that differ in their lability and stability. These fractions include very labile, labile, less labile, and recalcitrant carbon pools, which collectively represent a continuum from readily decomposable organic matter that supports microbial activity and nutrient cycling to highly stable carbon forms that contribute to long-term soil carbon storage and maintenance of soil structural integrity (Chudasama et al., 2023) [4] . Evaluating the distribution of these fractions across varying soil textures provides critical insights into the mechanisms underlying organic matter stabilization and decomposition (Post et al., 1996) [15] . Such understanding is essential for developing targeted soil management practices aimed at enhancing soil health, improving fertility, and maximizing carbon sequestration in the long term. This study was designed to investigate the spatial distribution of soil organic carbon fractions across the principal soil textures found within the Panipat district. This study sought to elucidate how soil texture influences both the quantity and stability of SOC pools under semi-arid conditions and cropping systems characteristic of the region. By characterizing the heterogeneity of soil textures and their associated organic carbon fractions, this study aims to generate knowledge that can inform the formulation of sustainable, site-specific soil management strategies. These strategies are intended to optimize soil fertility, enhance carbon sequestration capacity, and support climate-resilient agricultural practices, thereby contributing to the long-term sustainability of semi-arid agroecosystems.
Materials and Methods
Materials and Methods
Description of Study Area
The research was carried out in five blocks of the Panipat district in Haryana, specifically Bapoli, Israna, Madlauda, Panipat, and Samalkha. Geographically, the Panipat district is situated between the latitudes of 29.2315°N and 29.5667°N and the longitudes of 76.7220°E and 77.2996°E (Fig. 1). The district experiences a semi-arid climate typical of North India, with hot summers and cool winter. The summer season, which lasts from April to June, sees temperatures soaring up to 45°C. The monsoon period, spanning July to September, accounts for the bulk of the annual rainfall, averaging 534.7 mm. Winter extends from December to February, with temperatures dropping to approximately 2°C and frequent occurrences of dense fog. These climatic conditions significantly affect the region's cropping patterns, with wheat, rice, sugarcane, and mustard being the main crops suited to the semi-arid climate.
Soil Characteristics of the Study Area
In total, 250 soil samples were randomly gathered from farmers' fields across five blocks at a depth of 0-15 cm using a post-hole auger. The latitude and longitude of each sampling location were recorded using a portable GPS device, and the sites are illustrated in Fig. 2. The samples were then taken to the Regional Soil Testing Laboratory at KVK Karnal, where they were spread out on plastic sheets to air dry. After drying, the samples were crushed with wooden tools and a mortar and pestle and passed through a 2 mm sieve to achieve a consistent particle size. The prepared soil samples were stored in cloth or plastic bags with proper labeling for future analyses.
Soil Sample Collection and Preparation
In total, 250 soil samples were randomly gathered from farmers' fields across five blocks, at a depth of 0-15 cm, using a post-hole auger. The latitude and longitude of each sampling location were recorded with a portable GPS device, and these sites are illustrated in Fig. 2. The samples were then taken to the Regional Soil Testing Laboratory at KVK Karnal, where they were spread out on plastic sheets to air-dry. After drying, the samples were crushed with wooden tools and a mortar and pestle, then passed through a 2 mm sieve to achieve a consistent particle size. The prepared soil samples were stored in cloth or plastic bags with proper labeling for future analysis.
Experimental Plan
The soil textures of all samples were initially determined using the feel method. Based on the texture distribution, the major soil texture classes of the district were selected for a detailed analysis of different soil organic carbon fractions. Less frequent soil textures were excluded from subsequent fractionation analyses.
Soil Texture Analysis
Soil texture classification was performed using the feel method, categorizing soils into clay loam, loam, loamy sand, sand, and sandy loam. The distribution of these textures across the five blocks was tabulated and analyzed to understand the spatial variability.
Determination of Soil Organic Carbon Fractions
The soil organic carbon (SOC) fractions were analyzed following the method described by Chan et al. (2001) Carbon -residual organic carbon after reaction with 24 N H₂SO₄ (calculated as TOC minus carbon oxidized by 24 N H₂SO₄).
The oxidation of carbon by varying concentrations of H2SO4 (Fraction I-IV) was assessed using the wet digestion technique as described by Walkley and Black in 1934. In this procedure, a 1-gram soil sample was placed in a 500 ml conical flask, followed by the addition of 10 ml of potassium dichromate and 20 ml of sulfuric acid with normalities of 12, 18, and 24 N. The mixture was swirled and allowed to react for 30 min. Subsequently, the suspension was diluted with 200 ml of distilled water, 0.5 g of sodium fluoride (NaF), and 1 ml of diphenylamine indicator, which imparts a violet hue. Finally, the soil organic carbon was quantified by titrating the excess potassium dichromate with 0.5 N ferrous ammonium sulfate solution.
Data Analysis
The range and mean values of the organic carbon fractions were calculated for each soil texture class. The distribution of soil textures and their corresponding organic carbon fractions were statistically analyzed to assess the variability across the Panipat district.
Result and Discussion
The study conducted in the Panipat district provides an extensive analysis of the distribution of soil organic carbon (SOC) fractions across various soil textures, revealing critical insights into the variability and stability of carbon pools influenced by soil physical characteristics. The findings, as detailed in Table 2, underscore the significant role of soil texture in regulating organic matter dynamics, with implications for soil fertility management and carbon sequestration strategies in semi-arid agroecosystems.
| Texture | VL (Very Labile) | L (Labile) | LL (Less Labile) | RC (Recalcitrated Carbon) | TOC (Total Organic Carbon) | — | — | — | — | — |
|---|---|---|---|---|---|---|---|---|---|---|
| Range | Mean | Range | Mean | Range | Mean | Range | Mean | Range | Mean | |
| Sandy- loam | 0.01-0.13 | 0.09 | 0.05-0.19 | 0.06 | 0.11-0.23 | 0.15 | 0.13-0.28 | 0.22 | 0.42-0.68 | 0.53 |
| Loamy- sand | 0.04-0.13 | 0.08 | 0.04-0.12 | 0.10 | 0.14-0.21 | 0.18 | 0.16-0.39 | 0.32 | 0.48-0.74 | 0.69 |
| Loam | 0.03-0.09 | 0.06 | 0.08-0.15 | 0.12 | 0.16-0.28 | 0.22 | 0.35-0.46 | 0.41 | 0.66-0.89 | 0.82 |
| Clay -loam | 0.04-0.07 | 0.05 | 0.09-0.14 | 0.13 | 0.18-0.25 | 0.21 | 0.38-0.55 | 0.45 | 0.73-0.88 | 0.84 |
Table text extracted from the original PDF; superscript letters are shown inline. The original table image is below.
View original table image
Organic Carbon Fractions
The investigation measured four SOC fractions-Very Labile Carbon (VLC), Labile Carbon (LC), Less Labile Carbon (LLC), and Recalcitrant Carbon (RC)-across sandy loam, loamy sand, loam, and clay loam soils, each representing distinct pools of organic carbon with varying degrees of decomposability and stability.
Very Labile Carbon (VLC): VLC, the most readily decomposable fraction, ranged from 0.01 to 0.13% in sandy loam soils, with a mean value of 0.09%, indicating a relatively high proportion of easily mineralizable carbon. Loamy sand soils showed a similar range (0.04-0.13%) and mean (0.08%), followed by loam (0.03-0.09%, mean 0.06%) and clay loam soils (0.04-0.07%, mean 0.05%). The elevated VLC content in sandy loam soils can be attributed to their coarser texture and lower clay content, which promote faster organic matter turnover owing to enhanced aeration and reduced protection of organic compounds (Amin et al., 2021; Liao et al., 2014) [1,9] . This dynamic carbon pool is crucial for immediate microbial activity and nutrient release, but is susceptible to rapid depletion under intensive cultivation or erosion. Labile Carbon (LC): LC fractions ranged from 0.05 to 0.19% in sandy loam, 0.04 to 0.12% in loamy sand, 0.08 to 0.15% in loam, and 0.09 to 0.14% in clay loam soils, with mean values increasing from sandy loam (0.06%) to clay loam (0.13%). This trend contrasts with that observed for VLC, highlighting that finer-textured soils have a greater capacity to retain labile carbon fractions. The physical protection offered by clay particles and soil aggregates likely stabilizes these moderately labile carbon pools, which play a vital role in nutrient cycling and the sustainability of soil microbial biomass. Less Labile Carbon (LLC): LLC, representing more stable organic carbon pools with slower turnover rates, ranged from 0.11 to 0.23% in sandy loam, 0.14 to 0.21% in loamy sand, 0.16 to 0.28% in loam, and 0.18 to 0.25% in clay loam soils. The mean LLC values were highest in loam soils (0.22%), followed closely by clay loam (0.21%), indicating that these soil textures provide optimal conditions for the accumulation and persistence of intermediate-stability carbon fractions. The balanced particle size distribution in loam likely facilitates aggregate formation and moderate organic matter protection, whereas the higher clay content in clay loam enhances chemical stabilization (Buchmann & Schaumann, 2018) [3] . Recalcitrant Carbon (RC): RC, the most resistant and stable SOC fraction, showed a clear increase with finer soil textures, ranging from 0.13-0.28% in sandy loam to 0.38-0.55% in clay loam soils. The mean RC values were lowest in sandy loam (0.22%) and highest in clay loam (0.45%), emphasizing the critical role of clay minerals and soil aggregation in protecting organic carbon from microbial decomposition. This fraction contributes significantly to long-term carbon sequestration and soil structural stability, making clay loam soils particularly important for sustainable carbon management (Chudasama et al., 2023) [4] . Total Organic Carbon (TOC): TOC values followed the pattern of increasing organic carbon content with finer soil textures: sandy loam (0.42-0.68%, mean 0.53%), loamy sand (0.48-0.74%, mean 0.69%), loam (0.66-0.89%, mean 0.82%), and clay loam (0.73-0.88%, mean 0.84%). This gradient highlights the influence of soil texture on the soil's capacity to accumulate and stabilize organic carbon, with clay-rich soils favoring higher carbon stocks owing to better physical and chemical protection mechanisms.
The distribution of SOC fractions across textures suggests that sandy loam soils, with higher proportions of labile carbon fractions (VLC and LC), are characterized by more dynamic organic matter pools that rapidly cycle nutrients but may be vulnerable to carbon losses. In contrast, clay loam soils harbor greater amounts of less labile and recalcitrant carbon fractions, indicating more stable and persistent carbon pools that contribute to long-term soil health and carbon sequestration potential (Table 2).
Soil Texture Distribution and Spatial Variability
The analysis of 250 soil samples across five blocks in the Panipat district (Bapoli, Samalkha, Panipat, Madlauda, and Ishrana) revealed a heterogeneous spatial distribution of soil textures (Table 1). Clay loam was the dominant texture, followed by loamy sand, loam, sandy loam, and sand. Bapoli block, with the highest number of samples (72), predominantly contained clay loam and loamy sand soils, reflecting diverse soil formation processes and parent materials. Samalkha (44 samples) was primarily composed of clay loam and loam soils, notably lacking sand and sandy loam textures, which may influence organic carbon dynamics due to finer textures favoring carbon stabilization. The Panipat block (30 samples) exhibited a relatively higher presence of sand and clay loam soils, indicating variability in soil erosion and deposition patterns. Madlauda (56 samples) showed a balanced distribution of clay loam, loam, and loamy sand soils, suggesting a mosaic of soil properties within the block. Ishrana (48 samples) was dominated by clay loam soils, consistent with district-wide trends and indicative of soils with a higher carbon stabilization potential.
| Block | Clay -loam | Loam | Loamy- sand | Sand | Sandy- loam | Total |
|---|---|---|---|---|---|---|
| Bapoli | 21 | 9 | 20 | 5 | 17 | 72 |
| Samalkha | 18 | 13 | 13 | 0 | 0 | 44 |
| Panipat | 9 | 2 | 9 | 10 | 0 | 30 |
| Madlauda | 23 | 9 | 18 | 0 | 6 | 56 |
| Ishrana | 24 | 10 | 14 | 0 | 0 | 48 |
| Total | 95 | 43 | 74 | 15 | 23 | 250 |
Table text extracted from the original PDF; superscript letters are shown inline. The original table image is below.
View original table image
This spatial variability in soil texture is a key driver of the observed differences in SOC fractions and underscores the importance of site-specific soil management practices to optimize carbon retention and soil fertility.
Organic Carbon Status and Environmental Implications
The organic carbon content across the district was predominantly in the low to medium range, with approximately 74.6% of the samples classified as having medium organic carbon content. This status reflects the semi-arid climatic conditions of Panipat, characterized by high temperatures and limited rainfall, which accelerate organic matter decomposition and restrict organic-C inputs. However, the prevalent rice-wheat cropping system likely contributes to maintaining medium organic carbon levels by providing continuous organic residue inputs that replenish soil carbon pools. The dominance of labile carbon fractions in sandy soils suggests a more rapid organic matter turnover, which can enhance nutrient availability but may also lead to carbon depletion under intensive land use conditions. Conversely, higher proportions of less labile and recalcitrant carbon fractions in clay loam soils indicate enhanced carbon stabilization, which is essential for long-term soil productivity and mitigation of greenhouse gas emissions through carbon sequestration.
Management Recommendations and Future Perspectives
This study highlights the critical influence of soil texture on the distribution and stability of SOC fractions, suggesting that soil management strategies in the Panipat district should be tailored accordingly. For sandy loam soils, practices that increase organic matter inputs and reduce decomposition rates, such as residue retention, cover cropping, and reduced tillage, could enhance carbon sequestration and soil fertility.
Conclusions
This study demonstrated that soil texture significantly influences the distribution and stability of soil organic carbon (SOC) fractions in the semi-arid agroecosystem of the Panipat district. Finer-textured soils, particularly clay loams, exhibit higher proportions of stable carbon fractions (Less Labile Carbon and Recalcitrant Carbon), which enhance long-term carbon sequestration and soil structural stability. In contrast, coarser sandy loam soils contained greater amounts of labile carbon fractions (Very Labile Carbon and Labile Carbon), indicating more dynamic organic matter turnover but greater vulnerability to carbon loss. The spatial variability of soil textures across the district further affects SOC fraction distribution, emphasizing the need for site-specific soil management strategies. Recommendations include increasing organic inputs and minimizing decomposition in sandy soils and preserving soil structure in clay loam soils to maintain carbon stability. These findings provide valuable insights for developing sustainable soil fertility and carbon management practices tailored to semi-arid agroecosystems, thereby contributing to improved soil health and climate resilience.
References
17 in the original paper- Amin M, Salamba HN, Juita N. Role of labile fraction of carbon for soil quality assessment (A Review). IOP Conference Series: Earth and Environmental Science. 2021;807(3):032095. Available from: https://doi.org/10.1088/1755-1315/807/3/032095
- Bajgai Y, Kristiansen P, Hulugalle N, Mchenry M. Factors and mechanisms regulating soil organic carbon in agricultural systems. In: CRC; 2014. p. 41-56. Available from: https://doi.org/10.1201/b17775-3
- Buchmann C, Schaumann GE. The contribution of various organic matter fractions to soil-water interactions and structural stability of an agriculturally cultivated soil. Journal of Plant Nutrition and Soil Science. 2018;181(4):586-99. Available from: https://doi.org/10.1002/jpln.201700437
- Chudasama SD, Kaswala AR, Usadadia VP, Singh S, Chaudhary AD, Shiyal VN. Organic carbon stock in soil and its management. Current Advances in Agricultural Sciences (An International Journal). 2023;15(spl):249-54. Available from: https://doi.org/10.5958/2394-4471.2023.00044.8
- Curtin D, Beare MH, Qiu W. Texture effects on carbon stabilisation and storage in New Zealand soils containing predominantly 2:1 clays. Soil Research. 2015;54(1):30-7. Available from: https://doi.org/10.1071/sr14292
- Giannetta B, Plaza C, Vischetti C, Cotrufo MF, Zaccone C. Distribution and thermal stability of physically and chemically protected organic matter fractions in soils across different ecosystems. Biology and Fertility of Soils. 2018;54(5):671-81. Available from: https://doi.org/10.1007/s00374-018-1290-9
- Hu X, Qin J, Ma F, Sun H, Tang Y. Factors affecting soil organic carbon sequestration in rice fields: A metaanalysis. Soil Use and Management. 2025;41(1). Available from: https://doi.org/10.1111/sum.70051
- Kimble J, Cerri C, Bernoux M, Lal R, Etchevers J, Cerri E. Advances in models to measure soil carbon: Can soil carbon really be measured? In: CRC; 2006. p. 505-18. Available from: https://doi.org/10.1201/9781482298031-33
- Liao HK, Li J, Long J, Zhang WJ, Liu LF. Effects of land use and abandonment on soil labile organic carbon in the Karst region of southwest China. Huan Jing Ke Xue= Huanjing Kexue. 2014;35(1):240-7.
- Nn A, Murthy RK, N B, Mn S, K G, Sn UK. Understanding soil organic carbon dynamics in dryland ecosystems: A comprehensive review. International Journal of Advanced Biochemistry Research. 2025;9(1):623-30. Available from: https://doi.org/10.33545/26174693.2025.v9.i1h.3572
- Nziguheba G, Vargas R, Bationo A, Black H, Buschiazzo D, Brogniez D de, Joosten H, Melillo J, Richter D, Termansen M. Soil carbon: a critical natural resource -wide-scale goals, urgent actions. In: Cabi; 2014. p. 10-25. Available from: https://doi.org/10.1079/9781780645322.0010
- Plante AF, Conant RT, Stewart CE, Paustian K, Six J. Impact of soil texture on the distribution of soil organic matter in physical and chemical fractions. Soil Science Society of America Journal. 2006;70(1):287-96. Available from: https://doi.org/10.2136/sssaj2004.0363
- Post WM. Organic matter: Global distribution in world ecosystems. In: CRC; 2020. p. 559-66. Available from: https://doi.org/10.1201/9780429346255-71
- Post WM, King AW, Wullschleger SD. Soil organic matter models and global estimates of soil organic carbon. In: Springer Berlin Heidelberg; 1996. p. 20122. Available from: https://doi.org/10.1007/978-3-64261094-3_14
- Srinivasarao C, Sharma KL, Kundu S. Potential soil carbon sequestration in different land use and management systems in Peninsular India. In: Springer Singapore; 2019. p. 3-21. Available from: https://doi.org/10.1007/978-981-13-9628-1_1
- Vargas-Rojas R, Cuevas-Corona R, Yigini Y, Tong Y, Bazza Z, Wiese L. Unlocking the potential of soil organic carbon: A feasible way forward. In: Springer; 2019. p. 373-95. Available from: https://doi.org/10.1007/978-3-030-00758-4_18
- Zhang W, Xu M, Wang X, Huang Q, Nie J, Li Z, Li S, Hwang SW, Lee KB. Effects of organic amendments on soil carbon sequestration in paddy fields of subtropical China. Journal of Soils and Sediments. 2012;12(4):45770. Available from: https://doi.org/10.1007/s11368011-0467-8