
Research article · 2023 · Full text
International Journal of Biology SciencesAssessment of genetic parameters for growth and feed efficiency in Boran beef cattle in Kenya
Volume 5(2) · Pages 63–70 · DOI: 10.33545/26649926.2023.v5.i2a.808 ↗
Research areasGenetic and phenotypic traits in livestockLivestock Farming and ManagementRuminant Nutrition and Digestive Physiology
Abstract
Author-writtenAccurate estimation of genetic parameters forms the cornerstone of any effective breeding program for beef cattle improvement. This research assessed the genetic parameters for growth and feed efficiency traits in a population of 312 purebred Boran beef cattle (164 males and 148 females) maintained at the Lanet Livestock Research Station in Nakuru County, Kenya, over a three-year period from March 2019 to February 2022. Seven traits were evaluated: birth weight (BW), weaning weight at 205 days (WW), yearling weight at 365 days (YW), average daily gain (ADG), dry matter intake (DMI), feed conversion ratio (FCR), and residual feed intake (RFI). Genetic parameters were estimated using multivariate restricted maximum likelihood (REML) methodology with an animal model that incorporated fixed effects for sex, birth year-season, dam age class, and random additive genetic and residual effects. The pedigree file contained 1,896 animals spanning four generations. Heritability estimates for growth traits were moderate: BW (0.34±0.05), WW (0.29±0.06), YW (0.31±0.05), and ADG (0.26±0.04). Feed efficiency traits exhibited lower but still meaningful heritability: FCR (0.21±0.05), RFI (0.24±0.06), and gross feed efficiency (0.18±0.04). Maternal genetic effects contributed 8.7% of the total phenotypic variance for BW and 6.3% for WW, declining to negligible levels for post-weaning traits. Genetic correlations between growth traits were strongly positive, with the WW-YW correlation being highest (rg = 0.86±0.04). Genetic correlations between growth and feed efficiency traits were favorable, ranging from-0.21 (BW-FCR) to-0.51 (ADG-FCR), indicating that selection for improved growth would simultaneously reduce feed requirements per unit of gain. The genetic correlation between RFI and YW was-0.44±0.09, suggesting that heavier yearlings tended to have lower residual feed intake after adjustment for body size and growth rate. Estimated breeding values for YW ranged from-11.3 to 14.8 kg, demonstrating wide genetic variation within the population. The top 10% of animals based on a multi-trait selection index incorporating YW, ADG, and RFI had predicted genetic superiority of 9.7 kg in yearling weight and consumed 0.68 kg/day less feed than the population average. Phenotypic coefficients of variation ranged from 8.9% for BW to 17.6% for ADG, confirming adequate phenotypic variability for selection. Dam age significantly affected BW (p
Summary
Source-checkedPlain-language reading of the full paper, prepared with AI and checked against the text. Each point links to the authors' own words.
Why it matters
- Boran cattle provide nearly 60% of Kenya's beef production, but their genetic potential for growth and feed efficiency is not well understood. View evidence ↗
- The Boran breed is ideal for Kenya's extensive rangelands, which cover about 80% of the land, due to its adaptation to drought, heat, and tick-borne diseases. View evidence ↗
- Feed costs are the largest variable expense in cattle operations, often making up 60-75% of total production costs when supplemental feeding is used. View evidence ↗
The question
- The study aimed to estimate genetic parameters for growth and feed efficiency in Boran cattle, quantify maternal effects on early growth, and evaluate the potential for improvement via multi-trait selection. View evidence ↗
What they did
- The study evaluated 312 purebred Boran cattle (164 males, 148 females) at the Lanet Livestock Research Station in Kenya from March 2019 to February 2022. View evidence ↗
- Researchers measured seven traits: birth weight, weaning weight (205 days), yearling weight (365 days), average daily gain, dry matter intake, feed conversion ratio, and residual feed intake. View evidence ↗
- Genetic parameters were estimated using multivariate restricted maximum likelihood (REML) with an animal model accounting for sex, birth year-season, and dam age class. View evidence ↗
What they found
- Growth traits showed moderate heritability: birth weight (0.34±0.05), weaning weight (0.29±0.06), yearling weight (0.31±0.05), and average daily gain (0.26±0.04). View evidence ↗
- Feed efficiency traits had lower heritability than growth traits, with FCR at 0.21±0.05, RFI at 0.24±0.06, and gross feed efficiency at 0.18±0.04. View evidence ↗
- Maternal genetic effects were significant for early growth, contributing 8.7% of variance for birth weight and 6.3% for weaning weight, but were negligible after weaning. View evidence ↗
- Animals in the top 10% of a multi-trait selection index (YW, ADG, RFI) were predicted to be 9.7 kg heavier at yearling weight and consume 0.68 kg/day less feed than average. View evidence ↗
- Dam age significantly influenced birth weight (p<0.001) and weaning weight (p<0.01), with mature dams aged 6-9 years producing the heaviest calves. View evidence ↗
What it means
- The authors recommend yearling weight as the primary selection criterion because of its moderate heritability, strong correlations with other growth traits, and economic importance. View evidence ↗
- The authors conclude that focusing on yearling weight and average daily gain can indirectly improve feed efficiency, offering a cost-effective path for producers who cannot afford individual feed recording. View evidence ↗
- The authors state that expanding the reference population to include multiple herds and environments is needed to improve the robustness and generalizability of the results. View evidence ↗
Visual summary
3 visualsIllustrations explain the paper; charts are replotted from the paper's own table values.
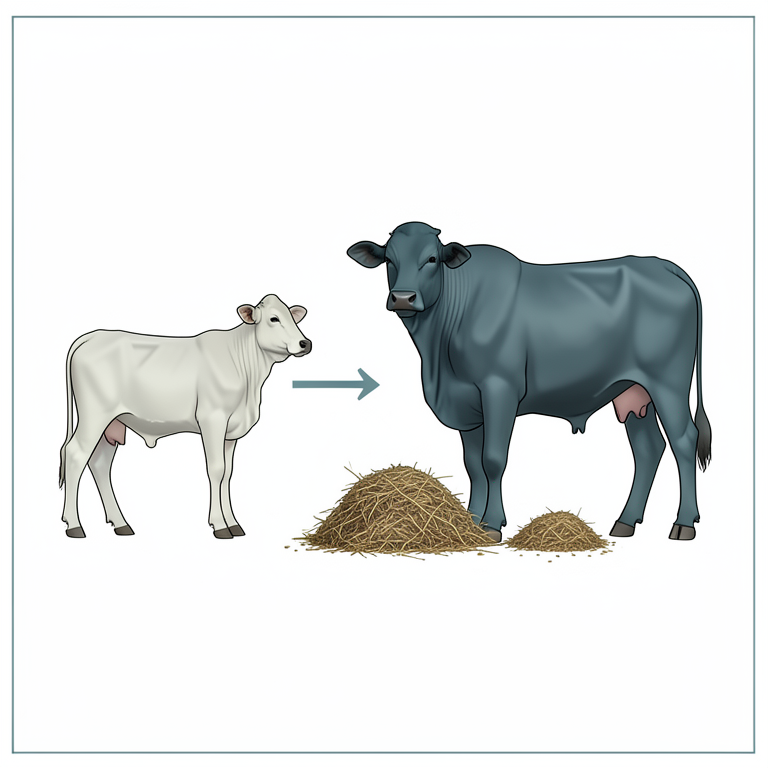
Growth and Feed Efficiency Relationship
AI-generated conceptual illustration (Boran beef cattle). It explains the idea and does not show study data.
View source evidence ↗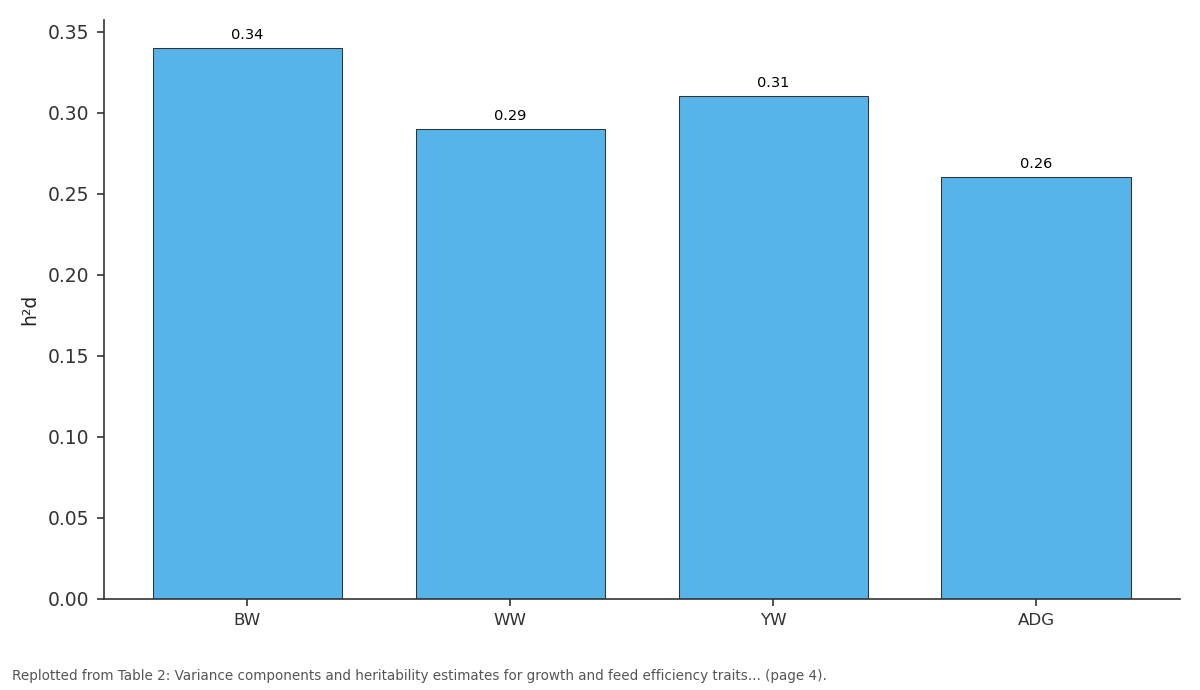
h²d: BW vs WW vs YW vs ADG
Replotted from Table 2 (page 4) of the original paper. Every bar is the paper's own table value.
View source evidence ↗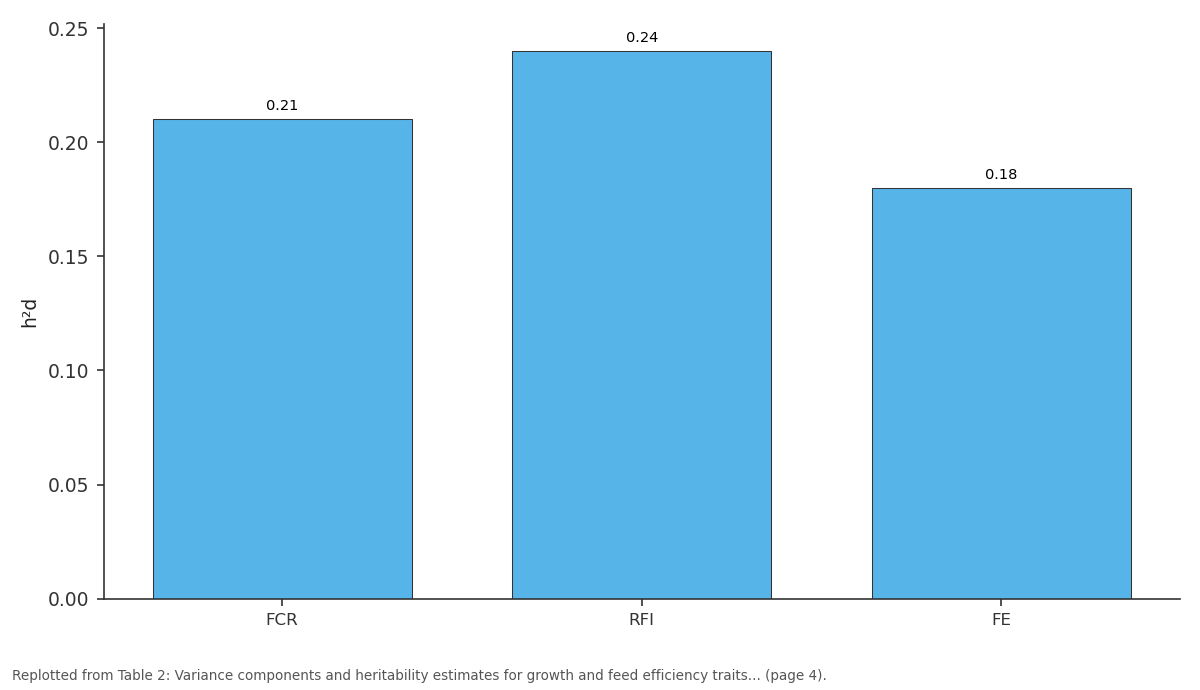
h²d: FCR vs RFI vs FE
Replotted from Table 2 (page 4) of the original paper. Every bar is the paper's own table value.
View source evidence ↗Figures & tables
From the original paper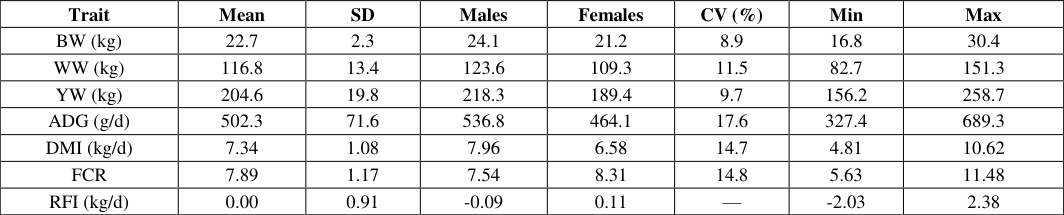 Table 1
 Table 2
 Table 3
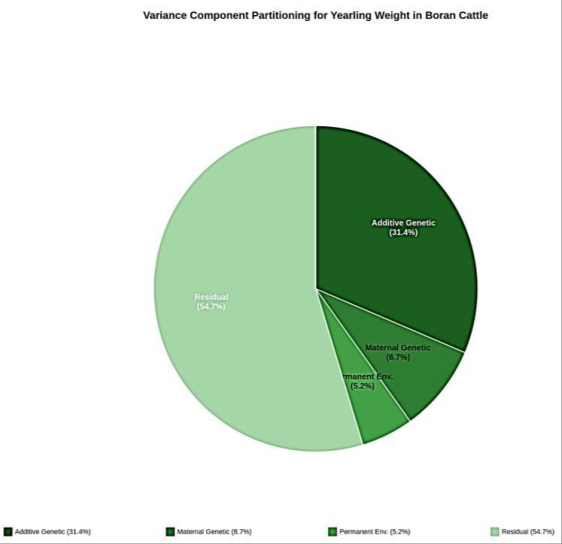 Figure 1
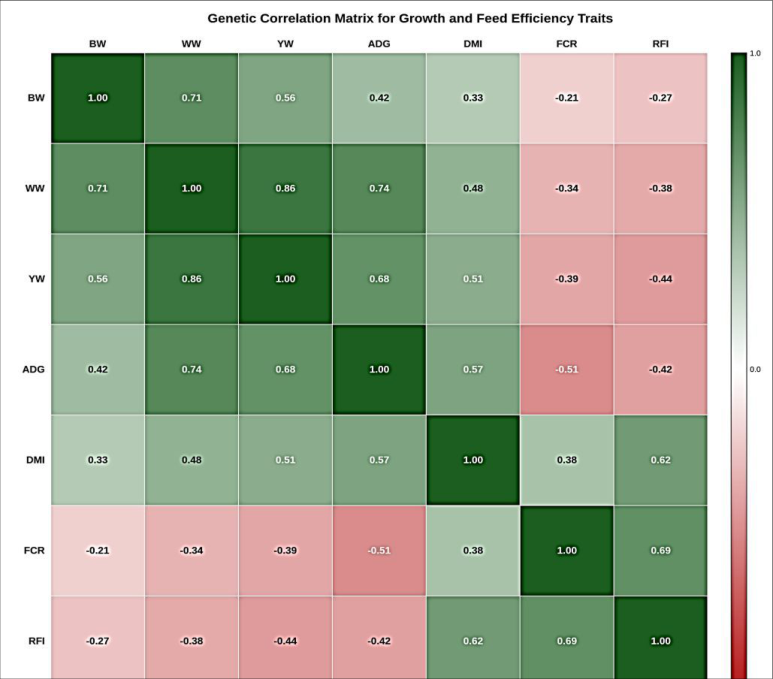 Figure 2
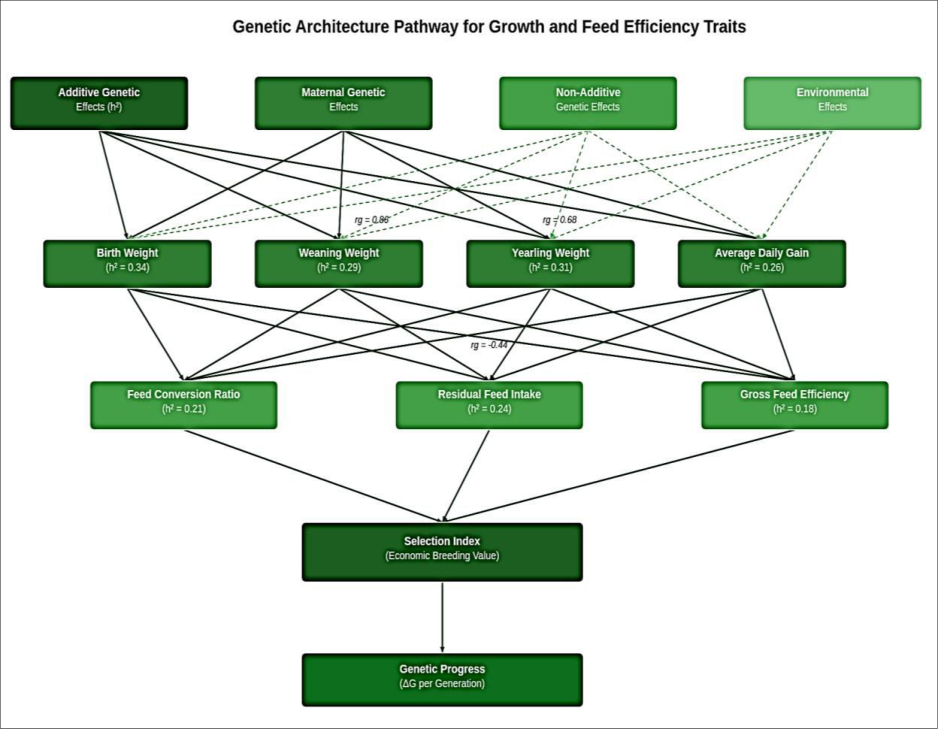 Figure 3
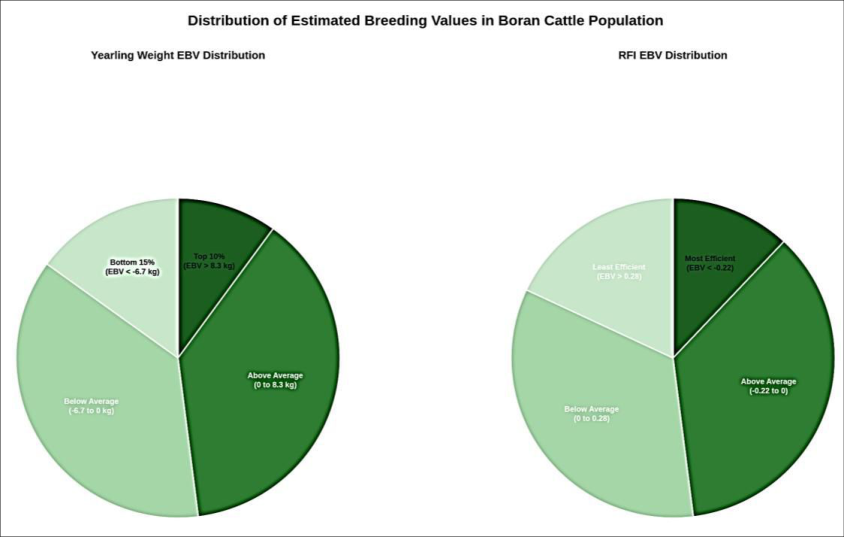 Figure 4
Introduction
Nearly 60% of the total beef production in Kenya comes from indigenous Boran cattle, yet the genetic potential of this breed for combined growth performance and feed efficiency remains inadequately characterized [1]. This gap in knowledge has practical consequences. Without reliable genetic parameter estimates, breeding programs operate on incomplete information, leading to suboptimal selection decisions that slow genetic progress and waste resources [2]. The Boran breed, which originated on the Borana plateau of southern Ethiopia and spread throughout the Horn of Africa over several centuries, occupies a central position in Kenya's livestock economy [3]. Its natural adaptations to heat, drought, and tick-borne diseases make it the breed of choice for the country's extensive rangelands, which cover approximately 80% of the land area [4].
Growth traits have traditionally served as the primary selection criteria in beef cattle breeding programs worldwide. Birth weight, weaning weight, yearling weight, and average daily gain collectively define the growth trajectory of an animal from birth to market age, and each trait carries economic significance for different segments of the beef value chain [5]. In the Kenyan context, yearling weight and average daily gain are particularly relevant because they determine the age at which animals reach market weight, directly affecting turnover rate and income generation for both pastoralist and commercial producers [6]. Feed efficiency has gained recognition as a trait of paramount economic importance in beef cattle production. The cost of feed represents the single largest variable expense in cattle operations, typically accounting for 60-75% of total production costs in systems where supplemental feeding is practiced [7]. Two approaches to measuring feed efficiency have gained wide acceptance in the animal breeding community. Feed conversion ratio, defined as the ratio of feed consumed to weight gained, provides an intuitive measure but is inherently correlated with growth rate and body size [8]. Residual feed intake, proposed by Koch et al. [9] and refined by subsequent researchers, measures the difference between actual and predicted feed intake after adjusting for body size and production level, thereby capturing variation in metabolic efficiency that is independent of growth rate. The genetic basis of both growth and feed efficiency traits determines the extent to which these characteristics can be improved through selection. Heritability estimates quantify the proportion of phenotypic variance attributable to additive genetic effects, and genetic correlations between traits indicate whether selection for one trait will produce correlated responses in others [10]. These parameters are population-specific and can vary across environments, making it necessary to estimate them within the target population and production system rather than relying solely on estimates from other breeds or countries [11]. Several previous investigations have examined growth trait genetics in Boran cattle. Haile-Mariam and Kassa-Mersha [12] reported heritability estimates for growth traits in Ethiopian Boran ranging from 0.20 to 0.42. Wasike et al. [13] estimated genetic parameters for pre-weaning growth traits in Kenyan Boran and found moderate heritability values with significant maternal genetic effects on early growth. However, these earlier efforts focused primarily on growth traits without incorporating feed efficiency measurements, which require expensive individual feed intake recording systems that have only recently become available in East African research facilities. The integration of growth and feed efficiency parameters into a unified genetic evaluation framework is necessary for designing breeding programs that improve both productivity and resource use efficiency. Multi-trait selection indices that combine information from both trait groups, weighted by their economic values and genetic relationships, offer the most theoretically sound approach to balanced genetic improvement [14]. But constructing such indices requires accurate estimates of genetic variances, covariances, and correlations among all traits of interest. Maternal genetic effects represent another dimension of genetic architecture that influences growth trait expression, particularly during the pre-weaning period when calves depend heavily on their dams for nutrition. Ignoring maternal effects when they are present leads to biased estimates of direct heritability and inaccurate prediction of selection response [15]. The magnitude of maternal effects in Boran cattle has been examined in only a handful of research efforts, and none have assessed maternal influences in the context of combined growth-efficiency genetic evaluations. This research was designed to estimate genetic parameters for growth traits and feed efficiency in a large population of Boran beef cattle in Kenya using multivariate REML methodology, to quantify maternal genetic effects on preweaning growth, to determine the genetic and phenotypic correlations between growth and feed efficiency traits, and to evaluate the potential for genetic improvement through multi-trait selection.
Study area description
This research was carried out at the Lanet Livestock Research Station situated in Nakuru County, Kenya (0°18'S, 36°04'E), at an altitude of 1,920 meters above sea level. The station operates under the Kenya Agricultural and Livestock Research Organization (KALRO) and maintains multiple livestock breeding herds for research purposes. The facility encompasses 2,800 hectares of managed rangeland, with paddocks allocated for rotational grazing and dedicated areas for supplemental feeding trials.
The vegetation consists primarily of improved pastures dominated by Rhodes grass (Chloris gayana) and Kikuyu grass (Pennisetum clandestinum), supplemented with natural stands of star grass (Cynodon dactylon). The station's Boran herd, established in 1978 through procurement of foundation stock from leading Kenyan ranches, has been maintained as a closed breeding population with artificial insemination introduced periodically to manage inbreeding levels. Individual animal identification through ear tags and electronic transponders has been in place since 2004, and the pedigree database is linked to a national livestock genetic evaluation system managed by KALRO's Genetic Evaluation Unit.
Seasonal variations
Rainfall distribution at the research site follows a bimodal pattern with the long rainy season extending from March to May and the short rains occurring from October to December. Mean annual rainfall during the three-year experimental period was 947 mm, which was 6.8% below the 30-year average of 1,016 mm recorded at the station's weather observatory. The inter-annual coefficient of variation for rainfall was 23.4%, reflecting considerable year-to-year fluctuation. Temperature patterns at the highland location were relatively mild compared to lowland production environments, with mean monthly temperatures ranging from 14.8 °C in July to 22.3 °C in March. The temperaturehumidity index remained below the critical threshold of 72 throughout the year, suggesting that heat stress was not a major factor affecting animal performance at this site.
Materials and Methods
Materials and Methods
Materials
The experimental population comprised 312 purebred Boran cattle (164 males and 148 females) born across six calving seasons between March 2019 and February 2022. These animals descended from 47 sires and 238 dams, with the complete pedigree file containing 1,896 animals spanning four generations. The average inbreeding coefficient was 2.3%, and no animal exceeded an inbreeding level of 8.5%, indicating that inbreeding depression was unlikely to confound genetic parameter estimates [16]. Growth trait measurements followed established protocols. Birth weight was recorded within 12 hours of parturition using calibrated digital scales (TruTest XR5000, accuracy±0.2 kg). Weaning weight was adjusted to a standard 205-day basis, and yearling weight was recorded at 365±14 days. Average daily gain was computed as the linear regression of monthly body weight on age from birth to yearling measurement. All animals were weighed at consistent times in the morning before access to feed and water. Feed efficiency data were collected on 214 animals (118 males and 96 females) during 84-day post-weaning feeding trials conducted in individual Calan gate pens equipped with automated feed intake recording systems (American Calan Inc., Northwood, NH, USA). The basal diet consisted of a total mixed ration containing chopped Rhodes grass hay (40%), maize grain (28%), cotton seed cake (15%), wheat bran (12%), mineral premix (3%), and molasses (2%), formulated to provide 10.8 MJ/kg metabolizable energy and 14.2% crude protein on a dry matter basis. Feed chemical composition was analyzed monthly using proximate analysis methods at the KALRO Animal Nutrition Laboratory. This research received ethical approval from the KALRO Institutional Animal Ethics Review Committee (Protocol KALRO-IAER-2018-031, approved October 8, 2018).
Methods
Genetic parameters were estimated by multivariate restricted maximum likelihood (REML) using WOMBAT software version 1.0 [17]. For pre-weaning traits (BW and WW), the following animal model was fitted: y = Xb + Z1a + Z2m + Wp + e, where y is the observation vector, b is the fixed effects vector, a is the direct additive genetic effects vector, m is the maternal additive genetic effects vector, p is the permanent environmental effects vector, X, Z1, Z2, and W are the corresponding incidence matrices, and e is the residual vector. For post-weaning traits (YW, ADG, FCR, RFI), the maternal and permanent environmental terms were dropped, yielding a reduced model: y = Xb + Za + e. Fixed effects for growth traits included sex, birth yearseason (six levels), and dam age class (first calf: 3 years; young: 4-5 years; mature: 6-9 years; old: ≥10 years). For feed efficiency traits, additional covariates included initial body weight at the start of the feeding trial and age at start of test (linear). Residual feed intake was calculated as the residual from a multiple regression of DMI on mid-test metabolic body weight (BW^0.75), ADG during the trial, and a quadratic effect of ADG [9]. Bivariate and trivariate models were used to estimate genetic and phenotypic correlations among all trait pairs. Convergence was assessed by monitoring the change in loglikelihood between successive iterations, with a criterion of 10^-8. Estimated breeding values were extracted from BLUP solutions, and their accuracy was approximated using the prediction error variance. A restricted selection index was constructed following Cunningham et al. [18] methodology, incorporating economic weights derived from a partial budgeting analysis of Kenyan beef production costs and revenues. 2. Direct heritability for growth traits ranged from 0.26±0.04 for ADG to 0.34±0.05 for BW. Maternal heritability was 0.087±0.024 for BW and 0.063±0.019 for WW, declining to non-significant levels for post-weaning traits. The direct-maternal genetic correlation was moderately negative for BW (-0.32±0.12) and WW (-0.28±0.14), indicating some antagonism between direct and maternal genetic effects on early growth. Permanent environmental effects accounted for 5.2% and 3.8% of the phenotypic variance for BW and WW, respectively. Feed efficiency traits had lower heritability than growth traits, as shown in Table 2. The heritability of FCR was 0.21±0.05, RFI was 0.24±0.06, and gross feed efficiency was 0.18±0.04. The additive genetic variance for RFI (0.194 kg²/day²) was smaller than the residual variance (0.614 kg²/day²), but still sufficient to support meaningful genetic change through selection. Genetic correlations among traits are presented in Table 3 and visualized in Figure 2. Strong positive genetic correlations existed among growth traits, with the WW-YW correlation being highest (0.86±0.04). Correlations between growth and feed efficiency traits were generally favorable. The ADG-FCR genetic correlation was-0.51±0.08, and the YW-RFI correlation was-0.44±0.09. The FCR-RFI genetic correlation was positive and moderate (0.69±0.07), reflecting partial overlap in the genetic control of these two feed efficiency measures. Estimated breeding values for yearling weight ranged from-11.3 to 14.8 kg, with a standard deviation of 6.2 kg. The distribution of EBVs is illustrated in Figure 4. Animals in the top decile for the multi-trait selection index showed a predicted genetic superiority of 9.7 kg for YW and-0.68 kg/day for RFI compared to the population mean. The accuracy of EBVs averaged 0.58 for animals with own performance records and 0.72 for sires with 15 or more progeny.
| Trait | BW | WW | YW | ADG | DMI | FCR | RFI |
|---|---|---|---|---|---|---|---|
| BW | — | 0.71 | 0.56 | 0.42 | 0.33 | -0.21 | -0.27 |
| WW | 0.61 | — | 0.86 | 0.74 | 0.48 | -0.34 | -0.38 |
| YW | 0.47 | 0.78 | — | 0.68 | 0.51 | -0.39 | -0.44 |
| ADG | 0.34 | 0.66 | 0.59 | — | 0.57 | -0.51 | -0.42 |
| DMI | 0.26 | 0.41 | 0.43 | 0.49 | — | 0.38 | 0.62 |
| FCR | -0.16 | -0.27 | -0.31 | -0.44 | 0.32 | — | 0.69 |
| RFI | -0.21 | -0.31 | -0.36 | -0.35 | 0.54 | 0.61 | — |
Table text extracted from the original PDF; superscript letters are shown inline. The original table image is below.
View original table image
| Trait | σ²a | σ²m | σ²pe | σ²e | h²d | h²m | SE(h²) |
|---|---|---|---|---|---|---|---|
| BW | 1.83 | 0.47 | 0.28 | 2.80 | 0.34 | 0.087 | 0.05 |
| WW | 52.1 | 11.3 | 6.8 | 109.6 | 0.29 | 0.063 | 0.06 |
| YW | 121.4 | — | — | 270.1 | 0.31 | — | 0.05 |
| ADG | 1332 | — | — | 3793 | 0.26 | — | 0.04 |
| FCR | 0.288 | — | — | 1.083 | 0.21 | — | 0.05 |
| RFI | 0.194 | — | — | 0.614 | 0.24 | — | 0.06 |
| FE | 0.0001 | — | — | 0.0005 | 0.18 | — | 0.04 |
Table text extracted from the original PDF; superscript letters are shown inline. The original table image is below.
View original table image
Results
Results
Comprehensive interpretation
The variance component analysis revealed that the relative importance of different genetic and environmental sources of variation shifted markedly across the growth trajectory.
For birth weight, the additive genetic variance accounted for 34% of phenotypic variance, with maternal genetic effects contributing an additional 8.7% (Figure 1). By yearling age, maternal effects had diminished to negligible levels, and direct additive genetic effects explained 31% of the variation. This pattern is consistent with the biological expectation that maternal influence, primarily through milk production and mothering ability, is strongest during the pre-weaning period and wanes as calves become increasingly independent of their dams. The genetic correlation structure depicted in Figure 2 and the pathway analysis in Figure 3 collectively paint a picture of genetic architecture that is amenable to multi-trait selection. The strong positive correlations among growth traits (0.42 to 0.86) mean that selection for any single growth trait will produce correlated gains in the others. More importantly, the consistently negative correlations between growth traits and FCR (-0.21 to-0.51) and between growth and RFI (-0.27 to-0.44) confirm that faster-growing Boran cattle tend to be more feed-efficient. This finding has direct implications for breeding program design, as it suggests that growth-based selection will deliver indirect improvements in feed efficiency even when feed intake data aren't collected. The estimated breeding value distributions (Figure 4) demonstrate that the Boran population at Lanet harbors substantial genetic variation for exploitation through selection. The 26.1 kg difference in yearling weight EBV between the top and bottom animals translates to meaningful economic impact when multiplied across a breeding herd. Similarly, the 1.34 kg/day range in RFI EBV indicates that selecting the most efficient animals could reduce feed costs by approximately 15-20% without compromising growth performance, based on the current feed pricing structure in Kenya.
Discussion
The heritability estimates obtained in this research are broadly consistent with those reported in other tropical Bos indicus populations, though some differences merit discussion. The BW heritability of 0.34 is somewhat lower than the 0.38 reported by Kibwana et al. [19] in Tanzanian Boran and the 0.42 found in Ethiopian Boran by Haile-Mariam and Kassa-Mersha [12], but higher than the 0.25 estimated for Nellore cattle in Brazil [20]. These differences likely reflect variation in population structure, environmental heterogeneity, and the statistical models employed. The inclusion of maternal genetic effects in the current research may have partitioned variance more accurately than models that ignore maternal influences, potentially explaining the somewhat lower direct heritability for BW compared to estimates from simpler models. The maternal genetic effects observed for pre-weaning traits align with established theory and empirical findings in beef cattle genetics. The negative direct-maternal genetic correlation for BW (-0.32) is a commonly reported phenomenon that has been attributed to natural selection favoring intermediate birth weights: calves that are genetically predisposed to be large at birth tend to be born to dams with reduced maternal genetic potential for growth support, as extreme birth weights increase calving difficulty [15]. From a practical standpoint, this antagonism means that selection for increased direct genetic merit for BW would, over time, erode maternal genetic quality if maternal effects aren't simultaneously monitored and selected. The genetic correlations between feed efficiency and growth traits in this Boran population are encouraging for breeding program design. The ADG-FCR correlation of-0.51 is among the strongest reported in any Bos indicus breed and suggests that the metabolic mechanisms linking growth rate to feed utilization efficiency are similar in Boran cattle to those described in temperate breeds [8]. Majoya et al. [9] documented comparable patterns of genetic variation for growth and feed efficiency traits in Boran cattle, further supporting the notion that this breed carries adequate genetic The favorable genetic correlations between growth and feed efficiency traits represent the most strategically valuable finding from this research. These correlations mean that a breeding program focused primarily on improving yearling weight and average daily gain will generate indirect improvements in feed efficiency, reducing per-animal feed costs without requiring the substantial investment in individual feed intake recording that direct selection for feed efficiency demands. For producers with limited resources for performance testing, this indirect approach offers a costeffective pathway to improving both trait groups simultaneously.
The wide range of estimated breeding values within the population confirms that there is substantial genetic variation available for exploitation. The practical significance of this variation becomes clear when considering that the genetic difference between the top and bottom 10% of the population amounts to approximately 21 kg in yearling weight and 1.1 kg/day in residual feed intake. Capturing these differences through systematic selection would deliver significant economic benefits to beef producers operating in Kenya's diverse production environments.
Looking forward, several priorities emerge for the continued genetic improvement of Boran cattle. First, expanding the reference population for genetic parameter estimation by incorporating data from multiple herds and production environments would improve the robustness and generalizability of the estimates. Second, genotyping the population with medium-density SNP arrays would enable genomic selection, increasing the accuracy of breeding value prediction, particularly for young animals without own performance records. Third, integrating feed efficiency measurement into routine performance testing programs, even if only on a subset of selection candidates, would allow direct selection for metabolic efficiency and accelerate genetic progress in this economically important trait. These investments in genetic evaluation infrastructure would position the Boran breed for sustained productivity improvement while preserving the adaptive traits that underpin its success in tropical production environments.
Acknowledgement
Acknowledgements Funding sourcesThis research was funded by the National Research Fund of Kenya under the Livestock Genetics and Genomics Research Initiative. The East African Dairy Development Project provided supplementary funding for feed efficiency data collection infrastructure.
Figures and tables from the paper
| Trait | Mean | SD | Males | Females | CV (%) | Min | Max |
|---|---|---|---|---|---|---|---|
| BW (kg) | 22.7 | 2.3 | 24.1 | 21.2 | 8.9 | 16.8 | 30.4 |
| WW (kg) | 116.8 | 13.4 | 123.6 | 109.3 | 11.5 | 82.7 | 151.3 |
| YW (kg) | 204.6 | 19.8 | 218.3 | 189.4 | 9.7 | 156.2 | 258.7 |
| ADG (g/d) | 502.3 | 71.6 | 536.8 | 464.1 | 17.6 | 327.4 | 689.3 |
| DMI (kg/d) | 7.34 | 1.08 | 7.96 | 6.58 | 14.7 | 4.81 | 10.62 |
| FCR | 7.89 | 1.17 | 7.54 | 8.31 | 14.8 | 5.63 | 11.48 |
| RFI (kg/d) | 0.00 | 0.91 | -0.09 | 0.11 | — | -2.03 | 2.38 |
Table text extracted from the original PDF; superscript letters are shown inline. The original table image is below.
View original table image
References
19 in the original paper- Mwacharo JM, Okeyo AM, Kamande GK, Rege JEO. The small East African Shorthorn Zebu cows in Kenya. I: Linear body measurements. Trop Anim Health Prod. 2006;38(1):65-74.
- Van der Werf JHJ. Multi-trait and random regression approaches to address genotype by environment interactions in animal breeding. Aust J Exp Agric. 2006;46(7):865-869.
- Rege JEO. The state of African cattle genetic resources I. Classification framework and identification of threatened and extinct breeds. Anim Genet Resour Inf. 1999;25:1-25.
- Ouma EA, Obare GA, Staal SJ. Cattle as assets: assessment of non-marketed benefits from cattle in smallholder Kenyan crop-livestock systems. Proc Int Assoc Agric Econ Conf. 2003:1-15.
- Willham RL. The role of maternal effects in animal breeding: III. Biometrical aspects of maternal effects in animals. J Anim Sci. 1972;35(6):1288-1293.
- Kosgey IS, Rowlands GJ, van Arendonk JAM, Baker RL. Small ruminant production in smallholder and pastoral/extensive farming systems in Kenya. Small Rumin Res. 2008;77(1):11-24.
- Arthur PF, Herd RM. Residual feed intake in beef cattle. Rev Bras Zootecn. 2008;37(spe):269-279.
- Archer JA, Richardson EC, Herd RM, Arthur PF. Potential for selection to improve efficiency of feed use in beef cattle: a review. Aust J Agric Res. 1999;50(2):147-161.
- Majoya AM, Khobondo JO, Tura S, Muasya TK. Genetic variation and parameters for growth and feed efficiency traits in Boran beef cattle in Kenya. Int J Vet Sci Anim Husbandry. 2022;7(4):41-45. doi:10.22271/veterinary.2022.v7.i4a.430.
- Falconer DS, Mackay TFC. Introduction to Quantitative Genetics. 4th ed. Harlow: Pearson Education Ltd; 1996.
- Menjo DK, Bebe BO, Okeyo AM, Ojango JMK. Analysis of early survival of Holstein-Friesian heifers of diverse sire origins on commercial dairy farms in Kenya. Trop Anim Health Prod. 2009;41(2):171-181.
- Haile-Mariam M, Kassa-Mersha H. Genetic and environmental influences on the growth performance of Boran cattle and their crosses with Friesian. Eth J Agric Sci. 1994;14(1-2):58-68.
- Wasike CB, Indetie D, Ojango JMK, Kahi AK. Direct and maternal (co)variance components and genetic parameters for growth and reproductive traits in Boran cattle in Kenya. Trop Anim Health Prod. 2009;41(5):741-748.
- Hazel LN. The genetic basis for constructing selection indexes. Genetics. 1943;28(6):476-490.
- Meyer K. Estimates of genetic parameters for weaning weight of beef cattle accounting for direct-maternal environmental covariances. Livest Prod Sci. 1992;31(34):179-204.
- Kahi AK, Rewe TO, Kosgey IS. Sustainable community-based organizations for the genetic improvement of livestock in developing countries. Outlook Agric. 2005;34(4):261-270.
- Meyer K. WOMBAT: a tool for mixed model analyses in quantitative genetics by restricted maximum likelihood (REML). J Zhejiang Univ Sci B. 2007;8(11):815-821.
- Cunningham EP, Moen RA, Gjedrem T. Restriction of selection indexes. Biometrics. 1970;26(1):67-74.
- Mwilawa AJ, Kimambo AE, Mtenga LA, Laswai GH. Growth performance of Tanzanian Boran and Mpwapwa cattle breeds on pasture-based feeding systems. Tanz J Agric Sci. 2010;10(2):38-47.