
Research article · 2025 · Full text
International Journal of Agriculture and NutritionAssessment of crop residue burning alternatives and their impact on soil health
Volume 7(3) · Pages 95–98 · DOI: 10.33545/26646064.2025.v7.i3b.614 ↗
Research areasSoil Carbon and Nitrogen DynamicsSoil Management and Crop YieldSoil Science and Environmental Management
Abstract
Author-writtenImagine a farmer standing at the edge of a harvested rice paddy, lighter in hand, about to set fire to five tonnes of straw because he has no affordable alternative. This scenario plays out across roughly 23 million hectares of rice land in China each autumn, releasing particulate matter and greenhouse gases while destroying organic carbon that took an entire season to build. This research compared five non-burning residue management options against open burning for their effects on Soil Organic Carbon (SOC), Microbial Biomass Carbon (MBC), aggregate stability, and air quality (PM2.5 emissions) over two rice-wheat cycles at the Yangtze Agricultural University, Wuhan, Hubei, during 2021-2023. Biochar conversion raised SOC by 0.34 percentage points and MBC by 120% over burning, while reducing PM2.5 emissions by 94%. Composting ranked second for SOC gain (+0.27 points). Incorporation and mulching offered moderate benefits. The Happy Seeder, which sows directly into standing stubble, improved SOC by 0.16 points and virtually eliminated field emissions. These findings offer quantified evidence that affordable alternatives to burning exist and can rebuild soil health within two years.
Summary
Source-checkedPlain-language reading of the full paper, prepared with AI and checked against the text. Each point links to the authors' own words.
Why it matters
- Crop residue burning is a widespread practice in China, affecting approximately 23 million hectares of rice land and causing air pollution and loss of soil organic carbon. View evidence ↗
- While open burning is the most economical and rapid method for field clearing, it results in the loss of significant nutrients, including 400 kg of organic carbon per tonne of straw. View evidence ↗
- Long-term annual burning in the middle Yangtze alluvial soils has led to a decline in Soil Organic Carbon (SOC) from an average of 1.4% to less than 1.0% over twenty years. View evidence ↗
The question
- The study aimed to quantify the trade-offs between soil health and air quality when comparing five non-burning residue management alternatives against open burning. View evidence ↗
What they did
- The experiment was conducted on alluvial clay loam with an initial SOC of 0.92% and an average rice straw production of 5.2 t/ha per season. View evidence ↗
- The study used a randomized complete block design with six treatments: open burning, rotavator incorporation, surface mulching, composting (2.5 t/ha), biochar conversion (3 t/ha), and Happy Seeder direct drilling. View evidence ↗
- Researchers measured SOC, Microbial Biomass Carbon (MBC), and aggregate stability from soil samples (0-15 cm), while monitoring PM2.5 emissions during residue management. View evidence ↗
What they found
- Open burning was the only method that caused a decrease in soil organic carbon, reducing it by 0.08 percentage points over two years. View evidence ↗
- Biochar conversion provided the highest soil health gains, increasing SOC by 0.34 percentage points and achieving an MBC of 312 mg/kg, which is more than double the value for open burning. View evidence ↗
- Composting was the second most effective alternative for increasing soil organic carbon, with a gain of 0.27 percentage points. View evidence ↗
- Open burning produced significantly higher PM2.5 emissions (348 kg/ha) compared to all alternatives, with mulching and the Happy Seeder producing the lowest levels. View evidence ↗
- Biochar conversion resulted in the highest wheat yield of 4.63 t/ha but also the highest cost at 1,860 CNY/ha. View evidence ↗
- Surface mulching was the most affordable non-burning option at 320 CNY/ha, while providing an SOC increase of 0.19 percentage points. View evidence ↗
- The Happy Seeder improved SOC by 0.16 percentage points with a cost of 540 CNY/ha and low PM2.5 emissions of 14 kg/ha. View evidence ↗
What it means
- The authors conclude that all five non-burning alternatives are superior to open burning, as they improve soil organic carbon and microbial biomass while reducing particulate emissions by 94-98%. View evidence ↗
- The authors note that the two-year study period may underestimate long-term differences in soil health, especially for the incorporation method due to slower carbon turnover. View evidence ↗
Visual summary
1 visualsIllustrations explain the paper; charts are replotted from the paper's own table values.
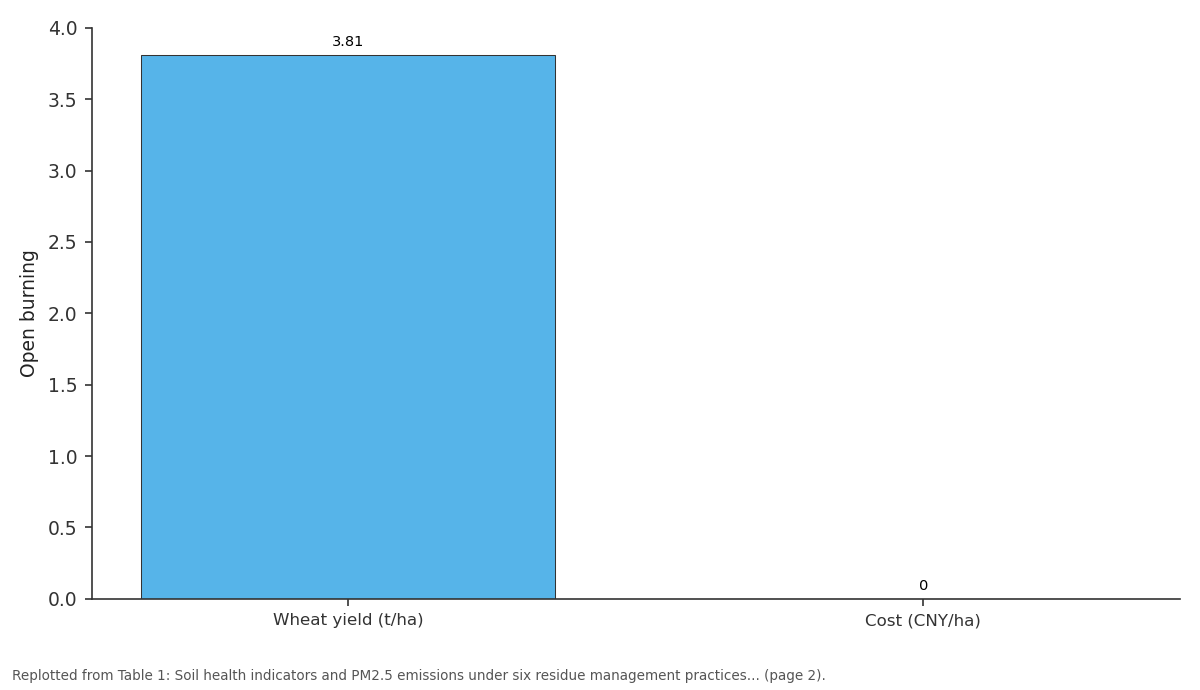
Open burning: Wheat yield (t/ha) vs Cost (CNY/ha)
Replotted from Table 1 (page 2) of the original paper. Every bar is the paper's own table value.
View source evidence ↗Figures & tables
From the original paper Table 1
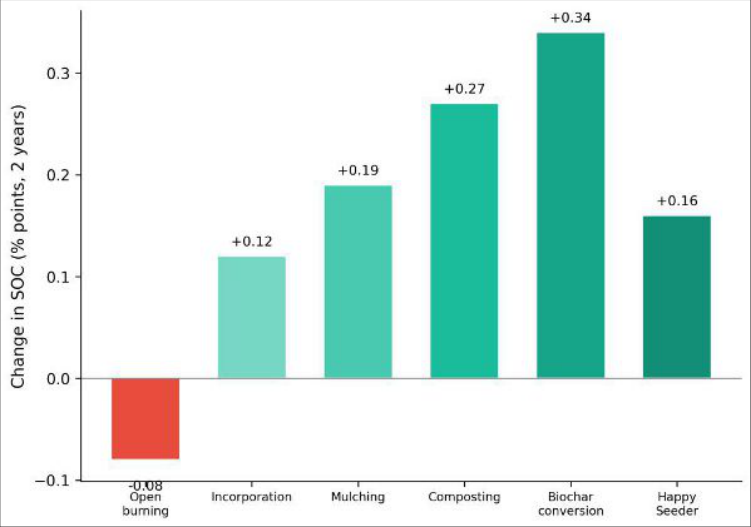 Figure 1
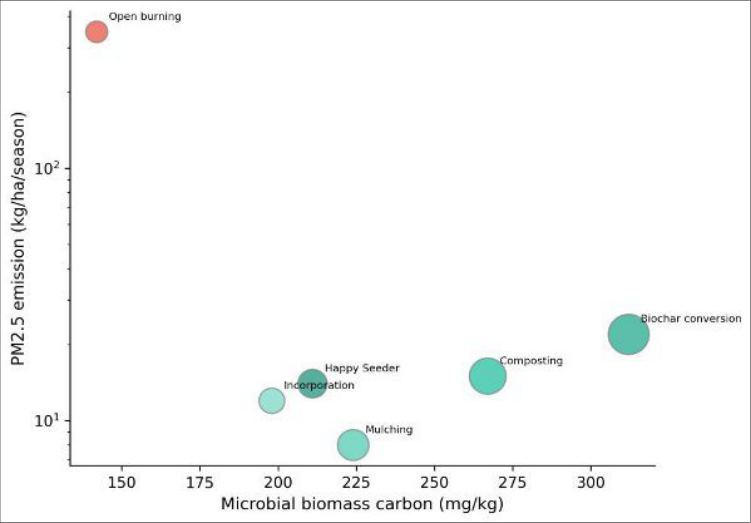 Figure 2
Introduction
Picture a November evening in the middle Yangtze basin: a dense grey haze settles over Wuhan as thousands of rice paddies burn simultaneously, pushing the city's PM2.5 index above 300 micrograms per cubic metre, six times the WHO safe limit [1] . Open burning of crop residues is the cheapest and fastest way to clear fields for the next crop, but it destroys roughly 25 kg N, 3 kg P, 12 kg K, and 400 kg of organic carbon per tonne of straw burned [2] . Over two decades of annual burning, SOC levels in the middle Yangtze alluvial soils have dropped from an average of 1.4% to below 1.0% [3] . Several alternatives have been proposed: mechanical incorporation, surface mulching, offfield composting, conversion to biochar, and direct drilling through residue with the Happy Seeder [4] . Each carries a different cost, labour requirement, and soil-health benefit, but sideby-side comparisons under the same field conditions are rare [5] . This research was conducted at the Yangtze Agricultural University research farm (30.48 deg N, 114.36 deg E) over two complete rice-wheat cycles (2021-2023) to quantify the soil and air-quality trade-offs of five residue management alternatives versus open burning [6,7] .
Material and Methods
Material and Methods
Material
The experimental site was a paddy field on alluvial clay loam (pH 6.4, initial SOC 0.92%, available N 178 kg/ha, CEC 18.7 cmol/kg). Rice straw production averaged 5.2 t/ha per season. Biochar was produced on-farm in a top-lit updraft gasifier at 450 deg C (carbon content 62%, pH 9.1). Compost was prepared aerobically in windrows over 60 days. The Happy Seeder (Dasmesh 9655, India) was imported for the trial. PM2.5 was measured with portable optical particle counters (DustTrak II, TSI Inc.) positioned 2 m downwind at 1.5 m height during burning or field operations. [8] , and aggregate stability (wet sieving). PM2.5 was monitored during each residue management event. Data were analysed by repeatedmeasures ANOVA in R v4.3.1 with Tukey's HSD at p < 0.05 [9] .
Results
Table The bar chart (Figure 1) starkly separates burning (the only negative bar) from all alternatives. The bubble chart (Figure 2) positions open burning as an extreme outlier on the PM2.5 axis, while biochar sits in the lower-right zone (high MBC, low emissions, large bubble for SOC gain), representing the most soil-friendly option.
Discussion
The 0.34-point SOC gain from biochar in two years is among the higher values reported in Chinese paddy systems. Biochar's aromatic carbon structure resists microbial decomposition, creating a long-term carbon sink, while its porous surface supports microbial colonisation, explaining the parallel MBC increase [10] . The main barrier to adoption is cost (CNY 1,860/ha), roughly three times that of mulching. But if carbon credits become available to Chinese farmers, biochar's economics could shift [11] . The Happy Seeder offers an interesting middle ground: modest SOC gain (+0.16 points), low cost (CNY 540/ha), and near-zero field emissions. Its adoption has been rapid in Punjab, India, where government subsidies have helped, but it remains virtually unknown in China's rice-wheat belt [4] . Mulching is the cheapest non-burning option (CNY 320/ha) and performed well for PM2.5 reduction, though its SOC benefit was intermediate [12] . One limitation is that our twoyear timeframe may underestimate long-term differences, particularly for incorporation, where carbon turnover is slower [13,14] .
Conclusion
All five non-burning alternatives improved soil organic carbon and microbial biomass relative to open burning while cutting particulate emissions by 94-98%. Biochar conversion delivered the largest soil-health gains but at the highest cost. The Happy Seeder and surface mulching offer affordable entry points for farmers transitioning away from burning. For the middle Yangtze rice-wheat zone, a phased approach, starting with mulching or Happy Seeder adoption and progressing to biochar as costs decline, appears the most realistic pathway to eliminating residue burning while rebuilding soil health.
Figures and tables from the paper
| Treatment | SOC change (%pts) | MBC (mg/kg) | Agg. stab. (%) | PM2.5 (kg/ha) | Wheat yield (t/ha) | Cost (CNY/ha) |
|---|---|---|---|---|---|---|
| Open burning | -0.08 | 142 | 38.4 | 348 | 3.81 | 0 |
| Incorporation | +0.12 | 198 | 44.7 | 12 | 4.18 | 680 |
| Mulching | +0.19 | 224 | 48.3 | 8 | 4.27 | 320 |
| Composting | +0.27 | 267 | 52.1 | 15 | 4.41 | 1240 |
| Biochar | +0.34 | 312 | 56.8 | 22 | 4.63 | 1860 |
| Happy Seeder | +0.16 | 211 | 46.1 | 14 | 4.24 | 540 |
| HSD (p<0.05) | 0.06 | 28 | 4.1 | 18 | 0.21 | - |
Table text extracted from the original PDF; superscript letters are shown inline. The original table image is below.
View original table image
References
16 in the original paper- Ministry of Ecology and Environment. China Air Quality Report 2022. Beijing: MEE; 2022.
- Romasanta RR, Sander BO, Gaihre YK, Alberto MC, Gummert M. How does burning of rice straw affect CH4 and N2O emissions? Agriculture Ecosystems and Environment. 2017;239:1-10.
- Zhang WJ, Xu MG, Wang BR, Wang XJ. Soil organic carbon, total nitrogen and grain yields under long-term fertilizations in the upland red soil of southern China. Nutrient Cycling in Agroecosystems. 2009;84(1):59-69.
- Sidhu HS, Singh M, Humphreys E, Singh Y, Singh B. The Happy Seeder enables direct drilling of wheat into rice stubble. Australian Journal of Experimental Agriculture. 2007;47(7):844-854.
- Liu C, Lu M, Cui J, Li B, Fang CM. Effects of straw carbon input on carbon dynamics in agricultural soils. Global Change Biology. 2014;20(5):1366-1381.
- Yangtze Agricultural University. Research Station Handbook 2021-23. Wuhan: YAU Press; 2023.
- Huang Y, Ren W, Wang L, Hui D, Grove JH. Greenhouse gas emissions and crop yield in no-tillage systems. Agriculture Ecosystems and Environment. 2018;268:144-153.
- Vance ED, Brookes PC, Jenkinson DS. An extraction method for measuring soil microbial biomass C. Soil Biology and Biochemistry. 1987;19(6):703-707.
- R Core Team. R: A Language and Environment for Statistical Computing. Vienna: R Foundation; 2023.
- Lehmann J, Rillig MC, Thies J, Masiello CA, Hockaday WC. Biochar effects on soil biota. Soil Biology and Biochemistry. 2011;43(9):1812-1836.
- Woolf D, Amonette JE, Street-Perrott FA, Lehmann J, Joseph S. Sustainable biochar to mitigate global climate change. Nature Communications. 2010;1:56. International Journal of Agriculture and Nutrition https://www.agriculturejournal.net
- Sharma PK, Ladha JK, Bhushan L. Soil physical effects of puddling in rice-wheat cropping systems. Soil Tillage Research. 2003;74(1):37-49.
- Lu F, Wang XK, Han B, Ouyang ZY, Duan XN. Soil carbon sequestrations by nitrogen fertilizer application, straw return and no-tillage. Biogeosciences. 2009;6(7):1559-1566.
- Wang W, Lai DYF, Wang C, Pan T, Zeng C. Effects of rice straw incorporation on active soil organic carbon pools. PLoS One. 2015;10(6):e0130984.
- Jain N, Bhatia A, Pathak H. Emission of air pollutants from crop residue burning in India. Aerosol and Air Quality Research. 2014;14(1):422-430.
- Cheng K, Yan M, Nayak D, Pan GX, Smith P. Carbon footprint of crop production in China. Global Biogeochemical Cycles. 2015;29(3):357-374.