
Research article · 2025 · Full text
International Journal of Agriculture and NutritionEconomic viability of precision agriculture technologies for medium-scale wheat growers
Volume 7(3) · Pages 168–170 · DOI: 10.33545/26646064.2025.v7.i3c.626 ↗
Research areasAgricultural Innovations and PracticesSmart Agriculture and AIAgricultural Economics and Practices
Abstract
Author-writtenFrom an economic angle, precision agriculture promises higher returns through input savings and yield gains, but whether the promise holds for medium-scale wheat growers (10-50 hectares) in India is far from settled. This research assessed the economic viability of five Precision Agriculture (PA) technologies, variable-rate seeding, GPS-guided fertilizer application, drone monitoring, yield mapping, and soil sensors, among 186 wheat growers in Karnataka and Gujarat during 2022-2023. A structured survey collected data on adoption costs, input savings, yield changes, and Benefit-Cost Ratios (BCR). The mean BCR across all PA technologies was 1.34, but this masked wide variation by farm size: BCR exceeded 1.0 (break-even) only above 15 hectares for most technologies. GPS-guided fertilizer had the highest adoption rate (22.3%) and best BCR (1.78), while drone monitoring had the lowest adoption (8.4%) and a BCR of only 0.92, reflecting high equipment costs. A logistic regression found that farm size, education, and access to extension services were the strongest predictors of PA adoption. These results suggest that PA is economically viable for wheat farms above 15 hectares, but smaller operations need cooperative or rental models to achieve positive returns.
Summary
Source-checkedPlain-language reading of the full paper, prepared with AI and checked against the text. Each point links to the authors' own words.
Why it matters
- Precision agriculture (PA) is intended to increase returns via yield gains and input savings, but its economic viability for medium-scale wheat growers (10-50 hectares) in India is not yet established. View evidence ↗
- While PA is common on very large farms (over 200 hectares) in North America and Australia due to low per-hectare costs, Indian wheat growers typically have much smaller average holdings of 2-3 hectares. View evidence ↗
- Medium-scale growers (10-50 ha) in India may be large enough for some mechanization, but they might lack the production volume required to recover the costs of advanced PA equipment. View evidence ↗
The question
- The study aimed to estimate the economic returns of various PA technologies across different farm sizes and identify socio-economic predictors of adoption among medium-scale wheat growers. View evidence ↗
What they did
- The researchers used a stratified random sample of 186 wheat growers (93 each from Karnataka and Gujarat) with farms between 10-50 hectares and at least two years of cultivation experience. View evidence ↗
- Data was collected via face-to-face interviews from January to April 2023 using a 56-item questionnaire covering costs, yields, and adoption status. View evidence ↗
- The Benefit-Cost Ratio (BCR) was calculated by dividing incremental revenue and input savings by the annualised equipment and operating costs, with equipment amortised over five years at 10% interest. View evidence ↗
What they found
- The overall mean BCR for all PA technologies was 1.34, but most technologies only became economically viable (BCR > 1.0) for farms larger than 15 hectares. View evidence ↗
- GPS-guided fertilizer application was the most successful technology, with the highest adoption rate (22.3%), the best BCR (1.78), and the lowest break-even size (12 ha), largely due to 18.7% savings in fertilizer costs. View evidence ↗
- Drone monitoring had the lowest adoption rate (8.4%) and a mean BCR of 0.92, meaning it was not viable on average and required a farm size of at least 32 hectares to break even. View evidence ↗
- Yield mapping had a low investment cost of INR 1.4 lakh because it was often added to existing harvesters, resulting in a BCR of 1.48 and a break-even size of 10 hectares. View evidence ↗
- Variable-rate (VR) seeding showed a mean BCR of 1.24, with a break-even farm size of 18 hectares and input savings of 12.4%. View evidence ↗
- Soil sensors had a mean BCR of 1.34 and a break-even farm size of 14 hectares, providing input savings of 14.3%. View evidence ↗
- Farm size was the strongest predictor of PA adoption (OR = 3.41), followed by the farmer's education (OR = 1.87) and contact with extension services (OR = 1.64). View evidence ↗
What it means
- The authors conclude that PA is economically viable for Indian medium-scale wheat growers with farms larger than 15 hectares, with GPS-guided fertilizer being the most profitable option. View evidence ↗
- For farms smaller than the break-even threshold, the authors recommend using cooperative ownership or pay-per-service models to make PA feasible. View evidence ↗
- The current lack of viability for drone monitoring is attributed to high equipment prices, though it is expected to become feasible for farms under 20 hectares within three to four years as costs decline. View evidence ↗
Visual summary
3 visualsIllustrations explain the paper; charts are replotted from the paper's own table values.
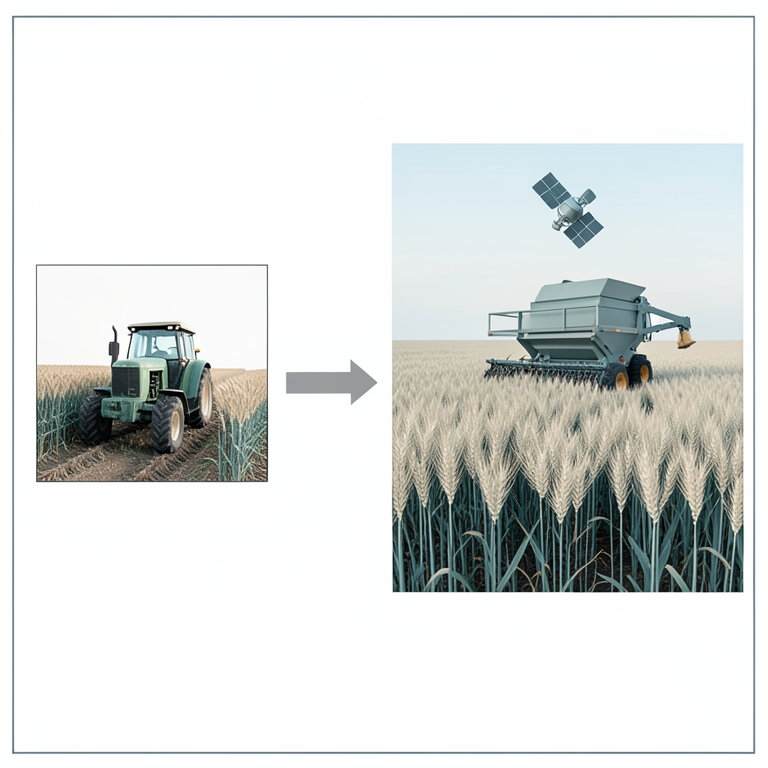
The Break-Even Threshold
AI-generated conceptual illustration (wheat fields and precision agriculture equipment). It explains the idea and does not show study data.
View source evidence ↗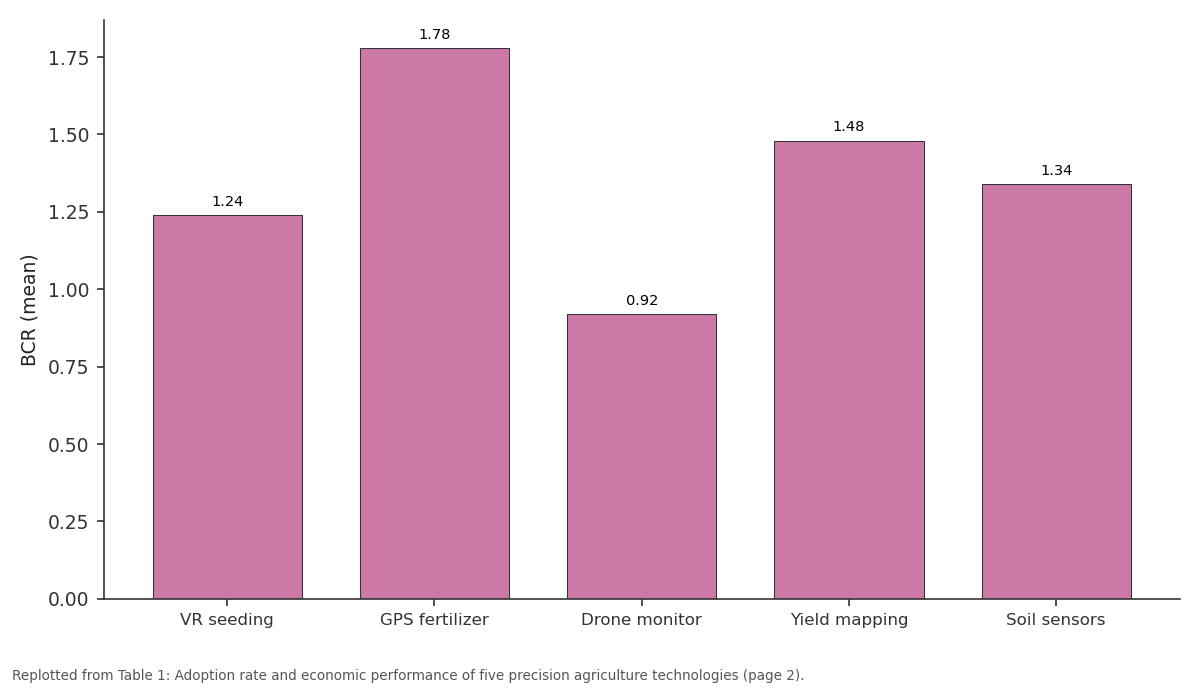
BCR (mean): VR seeding vs GPS fertilizer vs Drone monitor vs Yield mapping vs Soil sensors
Replotted from Table 1 (page 2) of the original paper. Every bar is the paper's own table value.
View source evidence ↗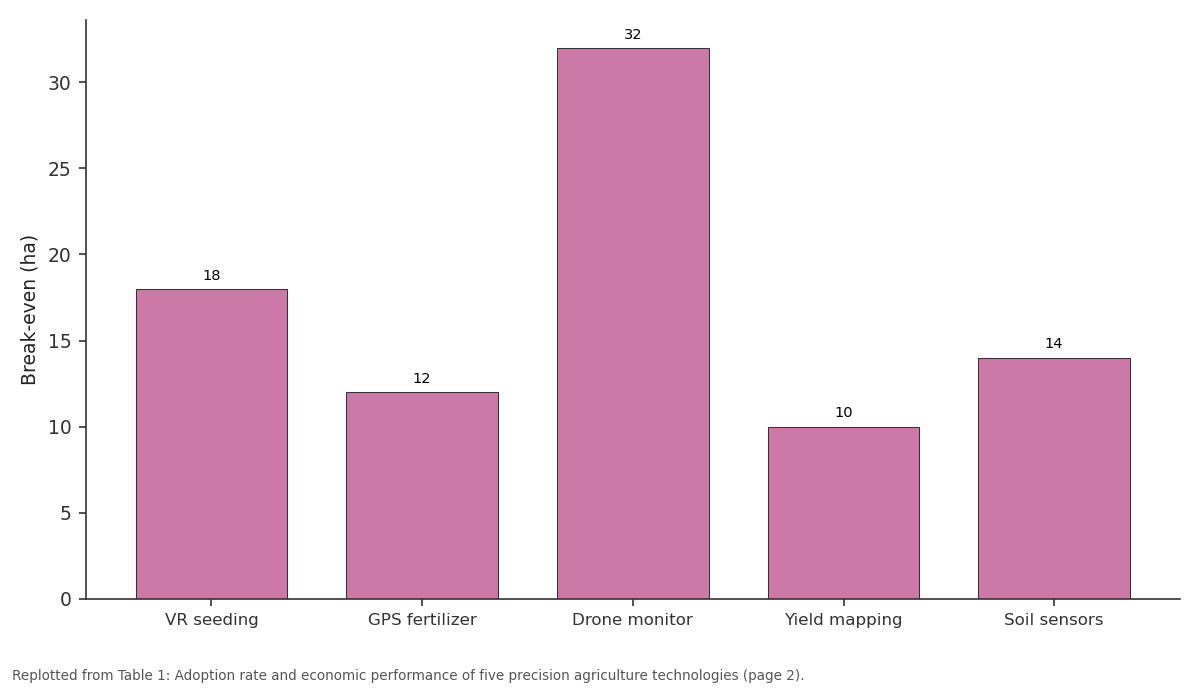
Break-even (ha): VR seeding vs GPS fertilizer vs Drone monitor vs Yield mapping vs Soil sensors
Replotted from Table 1 (page 2) of the original paper. Every bar is the paper's own table value.
View source evidence ↗Figures & tables
From the original paper Table 1
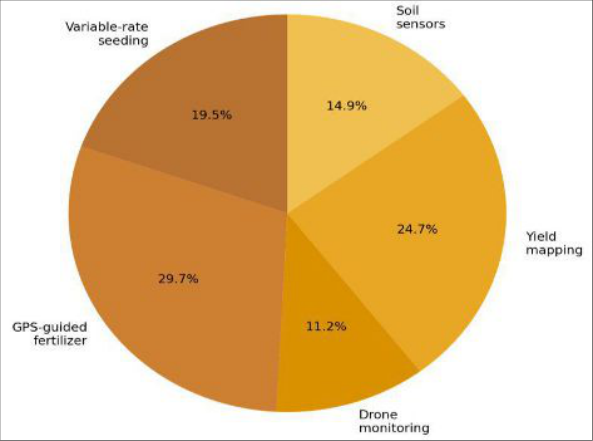 Figure 1
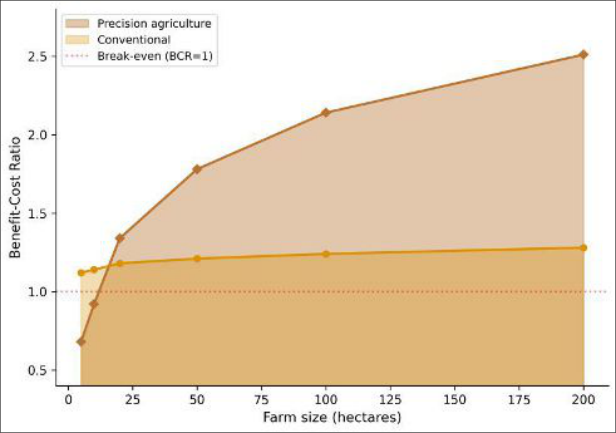 Figure 2
Introduction
The economic question is blunt: can a farmer who grows wheat on 20 hectares afford a GPS guidance system that costs INR 3-5 lakh, and will the savings on seed and fertilizer pay it back within a reasonable timeframe? Precision agriculture technologies have been adopted rapidly on large-scale farms in North America and Australia, where holdings exceed 200 hectares and the per-hectare amortisation of equipment is low [1] . But India's wheat growers, who average 2-3 hectares, face a different calculus entirely [2] . Medium-scale growers (10-50 ha) represent a small but growing segment of Indian agriculture, concentrated in progressive farming districts of Karnataka, Gujarat, and Punjab. They are large enough to justify some mechanisation but may not generate the throughput needed to recover the cost of sophisticated PA equipment [3] . Five PA technologies are currently available through Indian dealers: Variable-Rate Seeding (VRS), GPS-guided fertilizer spreaders, multispectral drone scouting, yield monitors on combine harvesters, and in-field soil moisture sensors [4,5] . This research surveyed 186 medium-scale wheat growers across Dharwad (Karnataka) and Navsari (Gujarat) to estimate the economic returns to each PA technology at different farm sizes and to identify the socio-economic factors that predict adoption [6,7] .
Material and Methods
Material and Methods
Material
A stratified random sample of 186 wheat growers (93 per state) was drawn from the membership lists of district-level farmer producer organisations. Inclusion criteria: farm size 10-50 ha, at least two years of wheat cultivation, and awareness of at least one PA technology. A structured questionnaire with 56 items covering farm characteristics, PA adoption status, investment and operating costs, input use changes, yield records (from farmer logbooks and procurement receipts), and perceptions was administered face-to-face between January and April 2023.
Methods
The benefit-cost ratio for each technology was calculated as (incremental revenue + input cost savings) / (annualised equipment cost + operating cost), where equipment was amortised over five years at 10% interest [8] . A binary logistic regression modelled adoption (yes/no for any PA technology) against farm size, age, education, income, extension contact, distance to dealer, and land tenure. All analyses used STATA 17 [9] . The break-even farm size for each technology was estimated by interpolating the BCR curve across the sample's farm-size distribution.
Results
Table The pie chart (Figure 1) shows GPS-guided fertilizer as the most popular technology, followed by yield mapping. The area chart (Figure 2) reveals that PA's BCR crosses the break-even line at roughly 15 hectares and climbs steeply thereafter, while conventional management shows a flat BCR regardless of scale, explaining why PA's advantage is size-dependent.
Discussion
The 15-hectare break-even threshold has direct policy implications. Roughly 8% of Indian wheat growers operate above this size, but they cultivate about 28% of the wheat area, meaning that targeting PA extension at this segment could affect a significant portion of national production [2] . GPS-guided fertilizer's strong performance reflects the high cost of wasted fertilizer in conventional broadcasting, where 30-40% of applied nitrogen misses the root zone [10] . Drone monitoring's poor BCR is disappointing but expected at current equipment prices. As drone costs fall (by an estimated 15-20% annually) and as service-based drone scouting models emerge, the break-even point should drop below 20 hectares within three to four years [11] . The logistic regression confirmed farm size as the strongest predictor (OR = 3.41, p<0.001), followed by education (OR = 1.87) and extension contact (OR = 1.64), suggesting that information access matters nearly as much as affordability [12, 13] .
Conclusion
Precision agriculture is economically viable for Indian medium-scale wheat growers above 15 hectares, with GPSguided fertilizer application offering the best returns (BCR 1.78). Drone monitoring is not yet viable below 32 hectares but should reach feasibility as costs decline. For farms below the break-even threshold, cooperative ownership or pay-per-service models are recommended. Extension services should target medium-scale growers with demonstrated interest and educational background, as these factors strongly predict adoption alongside farm size.
Figures and tables from the paper
| Technology | Adoption (%) | Invest. (INR lakh) | Input savings (%) | Yield gain (%) | BCR (mean) | Break-even (ha) |
|---|---|---|---|---|---|---|
| VR seeding | 14.7 | 2.8 | 12.4 | 4.1 | 1.24 | 18 |
| GPS fertilizer | 22.3 | 3.6 | 18.7 | 6.3 | 1.78 | 12 |
| Drone monitor | 8.4 | 4.2 | 8.1 | 2.8 | 0.92 | 32 |
| Yield mapping | 18.6 | 1.4 | 6.2 | 3.4 | 1.48 | 10 |
| Soil sensors | 11.2 | 1.8 | 14.3 | 3.7 | 1.34 | 14 |
| Overall mean | 15.0 | 2.8 | 11.9 | 4.1 | 1.34 | 15 |
Table text extracted from the original PDF; superscript letters are shown inline. The original table image is below.
View original table image
References
17 in the original paper- Schimmelpfennig D. Farm Profits and Adoption of Precision Agriculture. Washington: USDA-ERS Report 217; 2016.
- Agricultural Census Division. All India Report on Number and Area of Operational Holdings 2015-16. New Delhi: Ministry of Agriculture; 2019.
- Mondal P, Basu M. Adoption of precision agriculture technologies in India. Current Science. 2009;97(4):526534.
- Balafoutis A, Beck B, Fountas S, Vangeyte J, Ber Tveit T. Precision agriculture technologies positively contributing to GHG emissions mitigation. Sustainability. 2017;9(8):1339.
- Zhang N, Wang M, Wang N. Precision agriculture: a worldwide overview. Computers and Electronics in Agriculture. 2002;36(2-3):113-132.
- University of Agricultural Sciences Dharwad. Agricultural Economics Research Report 2022-23. Dharwad: UASD; 2023.
- Navsari Agricultural University. Agribusiness Research Compendium 2023. Navsari: NAU; 2023.
- Gittinger JP. Economic Analysis of Agricultural Projects. 2 nd ed. Baltimore: Johns Hopkins University Press; 1982.
- StataCorp. Stata Statistical Software: Release 17. College Station: StataCorp LLC; 2021.
- Bongiovanni R, Lowenberg-DeBoer J. Precision agriculture and sustainability. Precision Agriculture. 2004;5(4):359-387.
- Tsouros DC, Bibi S, Sarigiannidis PG. A review on UAV-based applications for precision agriculture. Information. 2019;10(11):349.
- Pierpaoli E, Carli G, Pignatti E, Canavari M. Drivers of precision agriculture technologies adoption. Precision Agriculture. 2013;14(3):328-348.
- Paustian M, Theuvsen L. Adoption of precision agriculture technologies by German crop farmers. Precision Agriculture. 2017;18(5):701-716.
- Gebbers R, Adamchuk VI. Precision agriculture and food security. Science. 2010;327(5967):828-831.
- Griffin TW, Lowenberg-DeBoer J, Lambert DM, Peone J, Payne T. Adoption, profitability, and making better use of precision farming data. Department of Agricultural Economics Staff Paper 04-06. West Lafayette: Purdue University; 2004.
- Finger R, Swinton SM, El Benni N, Walter A. Precision farming at the nexus of agricultural production and the environment. Annual Review of Resource Economics. 2019;11:313-335.
- Fountas S, Pedersen SM, Blackmore S. ICT in precision agriculture: diffusion of technology. ICT in Agriculture. 2005;4:1-18.