
Research article · 2026 · Full text
International Journal of Geography Geology and EnvironmentRole of Clay Minerals and Aggregation in Stabilizing Soil Organic Carbon in Forest Ecosystems of Siwalik Foothills, North-India
Volume 8(4) · Pages 58–71 · DOI: 10.22271/27067483.2026.v8.i4a.512 ↗
Research areasSoil Carbon and Nitrogen DynamicsSoil erosion and sediment transportSoil and Environmental Studies
Abstract
Author-writtenThis study investigated the relationship between soil mineralogy and soil organic carbon (SOC) stored within aggregate size fractions in forest ecosystems in the Siwalik foothills of North India. Surface and subsurface soils (0–10 and 10–30 cm) were sampled across representative forest stands with different vegetation types and land-use histories. The mineralogical composition (Xray diffraction) and texture were characterized for bulk soil and clay fractions; aggregate-size fractionation (wet-sieving) separated macroaggregates (>250 µm), microaggregates (250–53 µm), and silt+clay-associated fractions (<53 µm). SOC and bulk density were measured for each fraction and horizon separately. We quantified the proportion of SOC protected within aggregates, evaluated mineral–carbon associations, and used ratio and correlation analyses to link the abundance of specific clay minerals (e.g., illite, kaolinite, and smectite) to SOC stabilization. The results showed that microaggregates and the silt+clay-associated fraction contained the majority (>60%) of SOC, while soils rich in expandable 2:1 clays (smectite/vermiculite) displayed higher SOC per unit clay mass than illite/kaolinite-dominated soils. Aggregate-protected SOC correlated positively with fine fraction (<53 µm) mass and specific surface area. Our findings indicate that clay mineralogy, coupled with aggregate architecture, is a key factor controlling carbon persistence in Siwalik foothill forest soils and highlights the potential of native forest cover to enhance SOC sequestration in these geologically young landscapes. The clay minerals in order of their dominance were vermiculite, illite, kaolinite, and mixed-layer minerals. The presence of vermiculite and illite in appreciable quantities indicates that they were synthesized from the K-rich soil solution. The mineral suites identified in this study show that the geological, climatological, and topographical factors of the region collectively played a dominant role in their formation and transformation. After critical appraisal of the results, it may be deduced that the mineralogical composition, physicochemical properties, and total elemental analysis of the soils do not show any deficiency of the bases and other plant nutrients in general. The inherent fertility of the soil is good, as indicated by the clay mineralogy of the soil, and biotite and feldspar, together with mica, are important sources of nutrients for the vegetation in the soils of the Siwalik Valley.
Summary
Source-checkedPlain-language reading of the full paper, prepared with AI and checked against the text. Each point links to the authors' own words.
Why it matters
- The placement of soil organic matter within the soil structure is a critical factor that controls the dynamics and total stocks of organic matter. View evidence ↗
- Passive carbon pools, which are mineral-stabilized, are governed by the mineralogy of the soil. View evidence ↗
- Microaggregates are viewed as the primary storage site for the most stable carbon pools in soil. View evidence ↗
The question
- The study aimed to analyze the carbon content and composition of soil aggregate fractions and investigate differences in clay mineralogy across two forest divisions. View evidence ↗
What they did
- Research was conducted in the Siwalik ranges within the Yamunanagar Forest Division (YFD) and Panchkula Forest Division (PFD). View evidence ↗
- Soil samples were collected using a 12 cm diameter corer at five depth intervals from 0 to 100 cm, with five replicates per depth. View evidence ↗
- Wet-sieving was used to separate soil into macroaggregates (>250 µm), microaggregates (250–53 µm), and silt+clay fractions (<53 µm). View evidence ↗
- Clay mineralogy was analyzed using an XPERT-PRO diffractometer with CuKα radiation. View evidence ↗
What they found
- More than 60% of the soil organic carbon (SOC) was found within the microaggregates and the silt+clay-associated fractions. View evidence ↗
- Soils dominated by expandable 2:1 clays, such as smectite and vermiculite, had higher SOC per unit of clay mass compared to those dominated by illite or kaolinite. View evidence ↗
- In the Panchkula division, sub-tropical pine forests had the highest carbon concentration (10.11±0.07 g kg-1), followed by mixed dry deciduous (4.94±0.04 g kg-1) and dry deciduous forests (3.73±0.10 g kg-1). View evidence ↗
- Across all forest types, organic carbon concentrations decreased significantly (p<0.05) as soil depth increased up to one meter. View evidence ↗
- In the Yamunanagar division, carbon concentration in aggregate fractions was highest in small macroaggregates and lowest in silt and clay fractions. View evidence ↗
- The dominant clay minerals identified in the study area were vermiculite, followed by illite, kaolinite, and mixed-layer minerals. View evidence ↗
What it means
- The authors conclude that the combination of clay mineralogy and aggregate architecture is a primary factor controlling the persistence of carbon in the forest soils of the Siwalik foothills. View evidence ↗
- The study highlights that maintaining native forest cover can enhance the sequestration of soil organic carbon in these geologically young landscapes. View evidence ↗
Visual summary
3 visualsIllustrations explain the paper; charts are replotted from the paper's own table values.
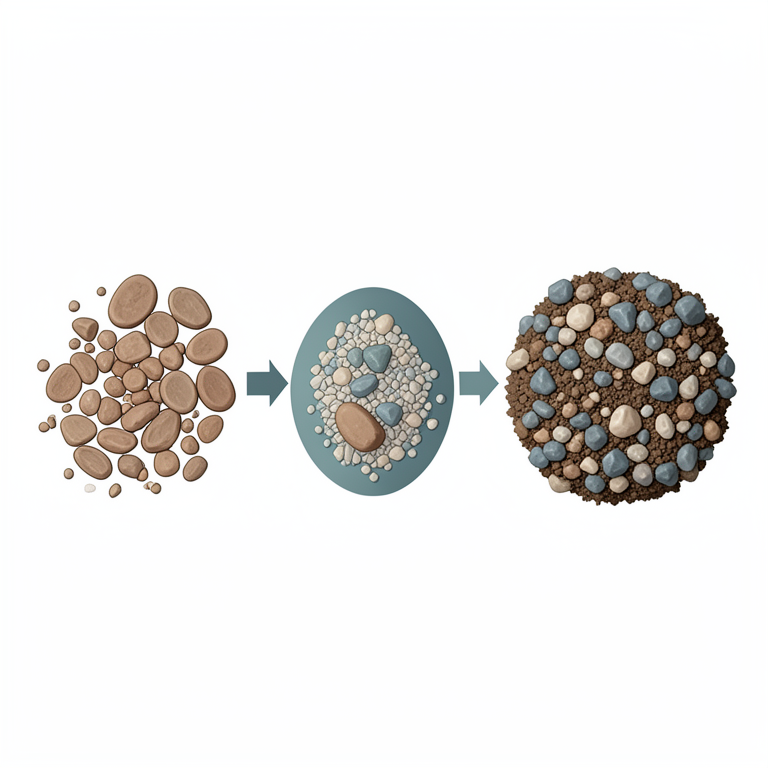
Carbon Stabilization Mechanism
AI-generated conceptual illustration (Forest soil profile with clay minerals and organic carbon molecules). It explains the idea and does not show study data.
View source evidence ↗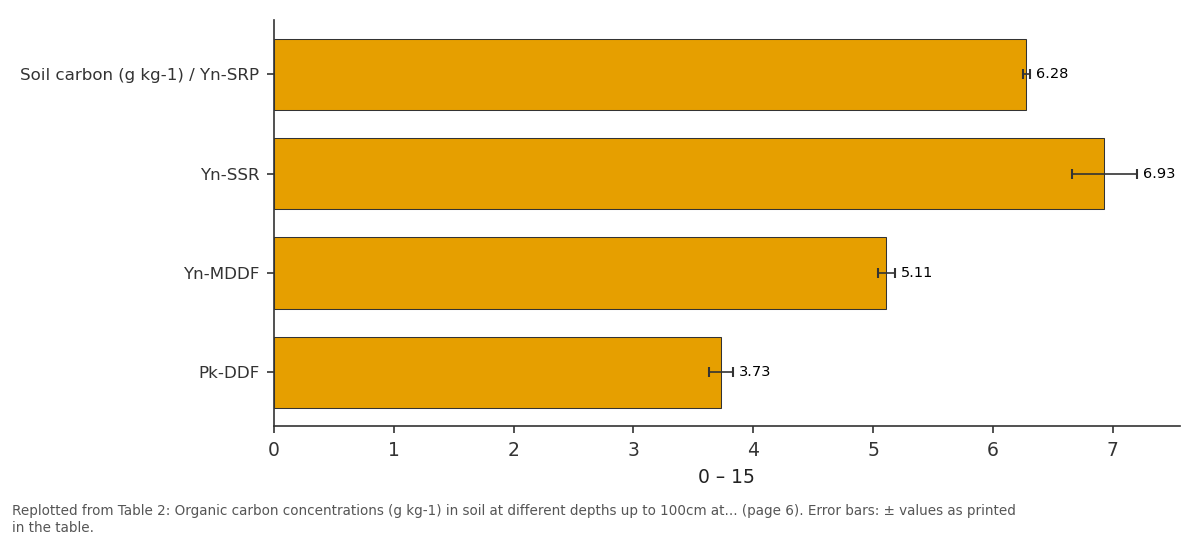
0 – 15: Soil carbon (g kg-1) /... vs Yn-SSR vs Yn-MDDF vs Pk-DDF
Replotted from Table 2 (page 6) of the original paper. Every bar is the paper's own table value.
View source evidence ↗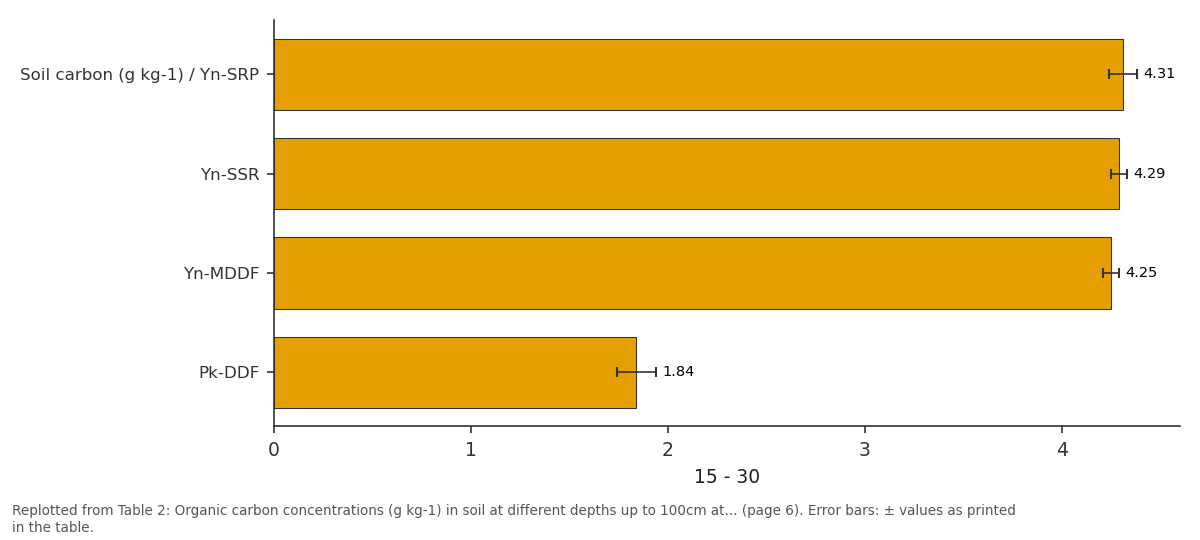
15 - 30: Soil carbon (g kg-1) /... vs Yn-SSR vs Yn-MDDF vs Pk-DDF
Replotted from Table 2 (page 6) of the original paper. Every bar is the paper's own table value.
View source evidence ↗Figures & tables
From the original paper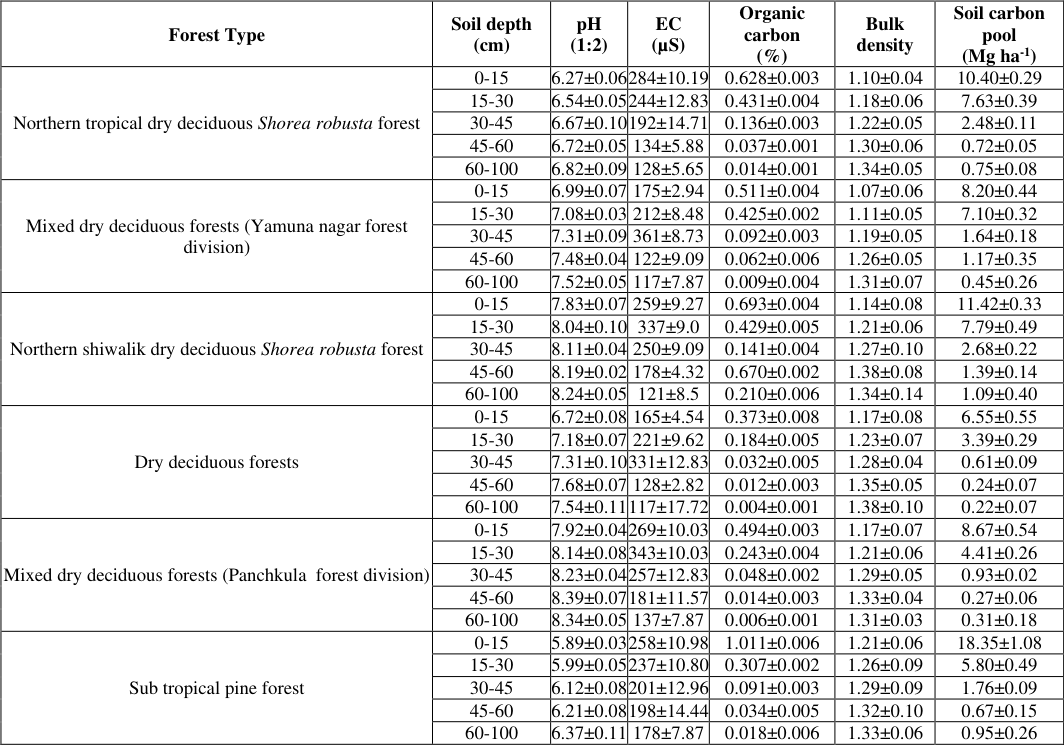 Table 1
 Table 2
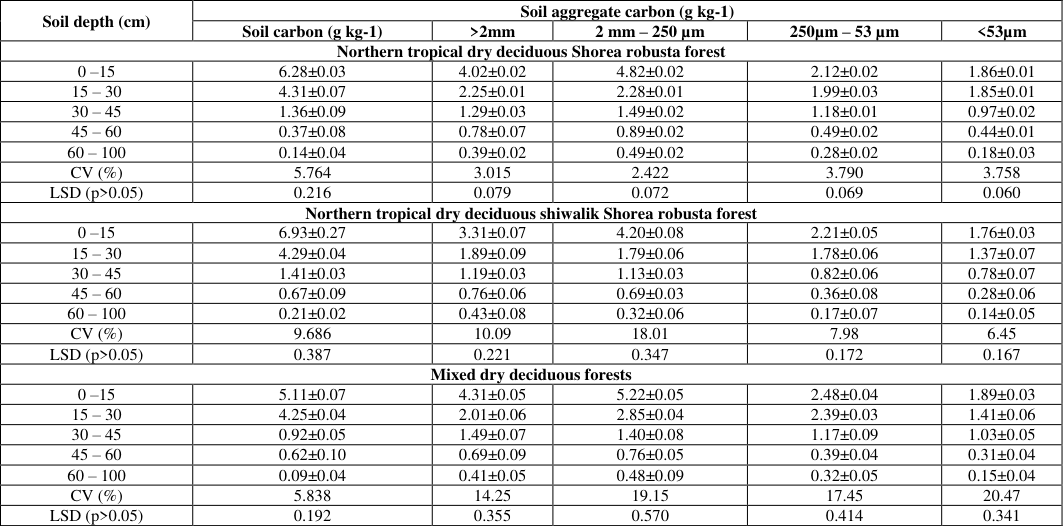 Table 3
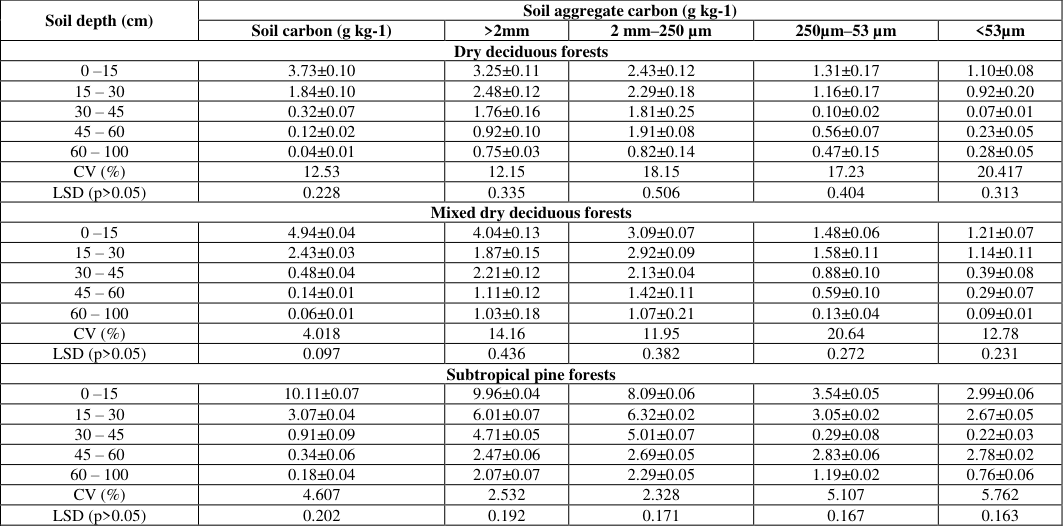 Table 4
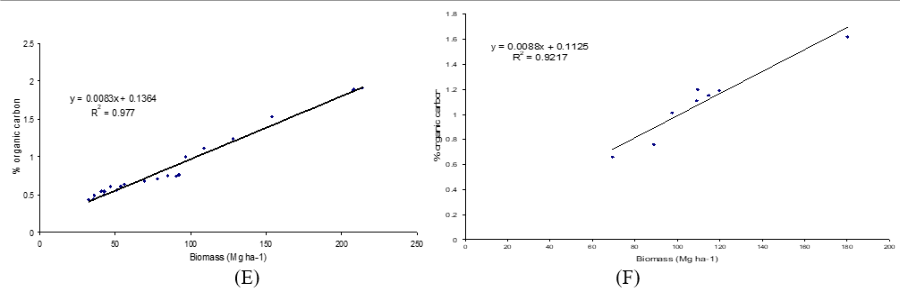 Figure 1
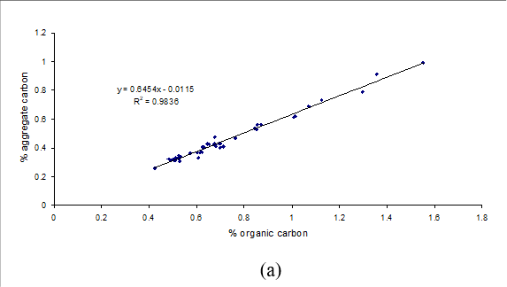 Figure 1
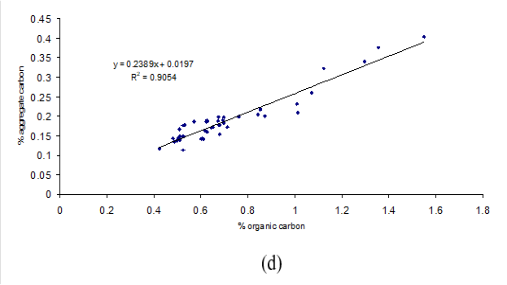 Figure 2
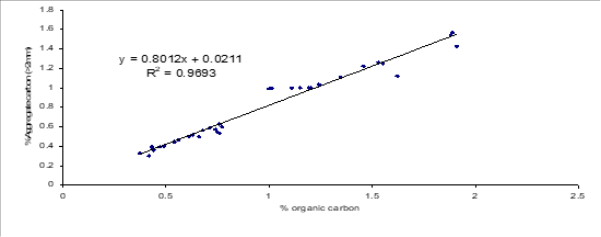 Figure 2
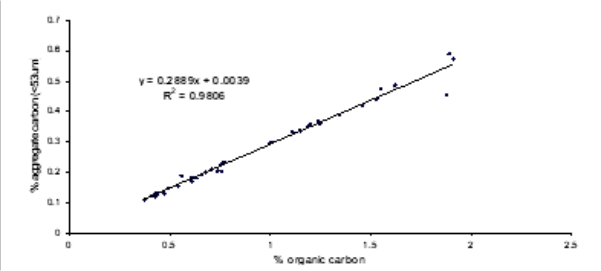 Figure 3
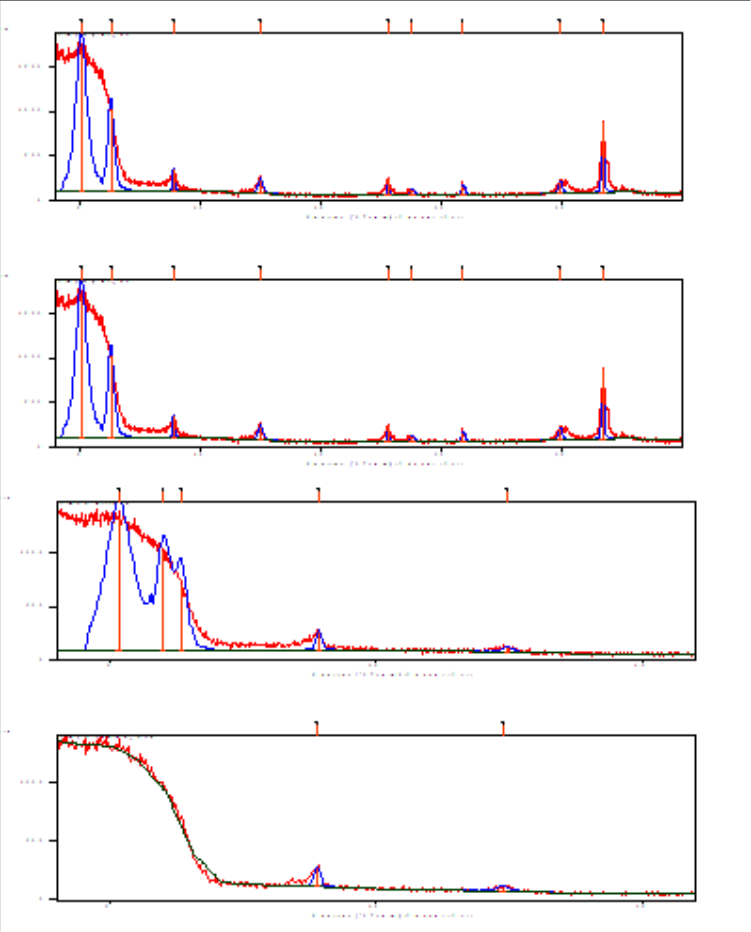 Figure 4
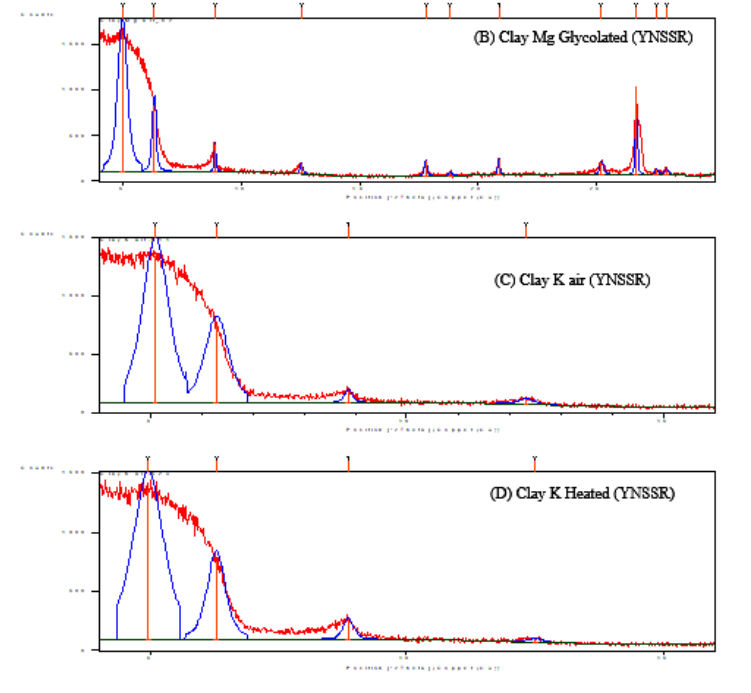 Figure 5
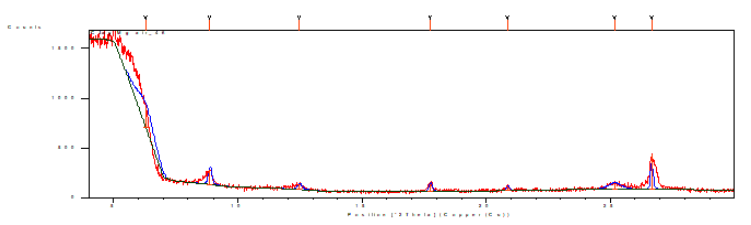 Figure 5
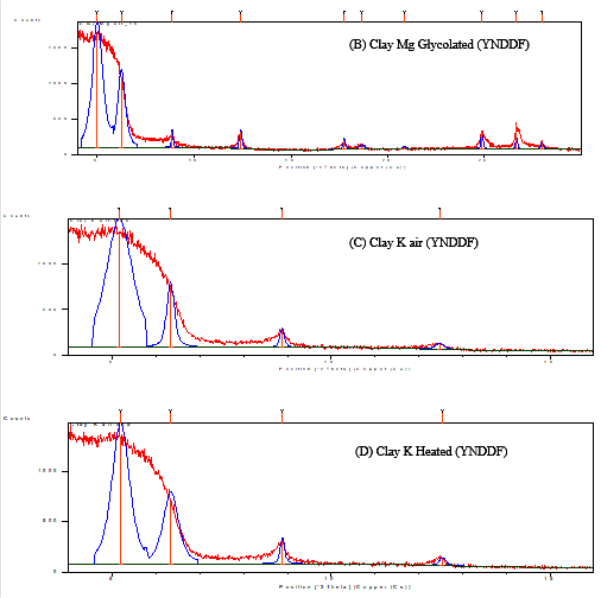 Figure 6
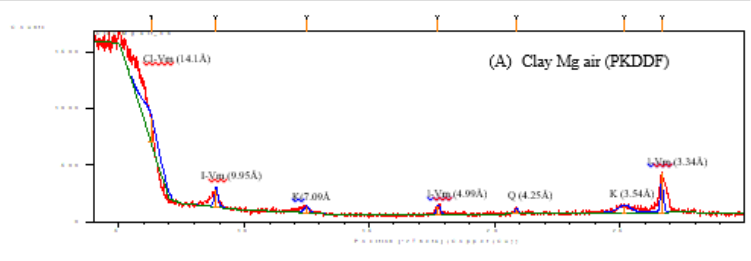 Figure 6
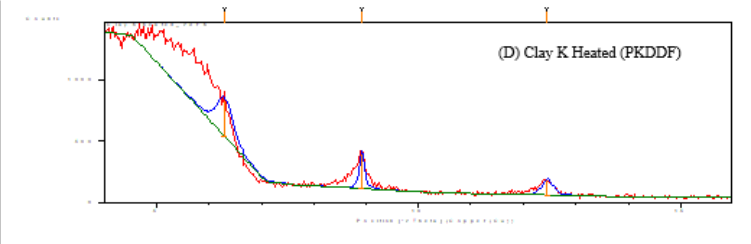 Figure 7
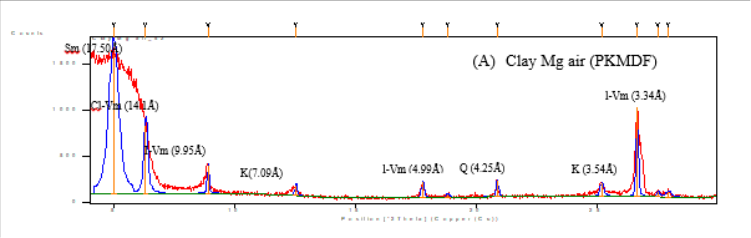 Figure 7
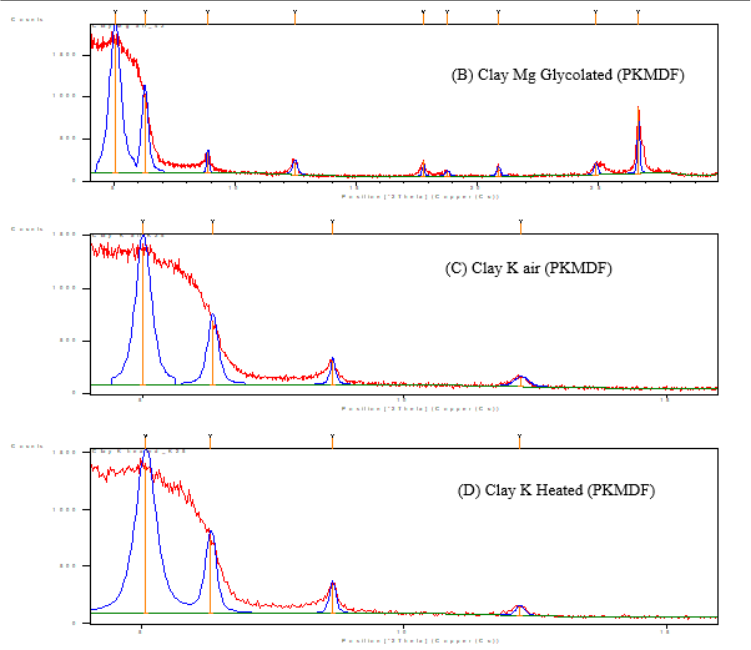 Figure 8
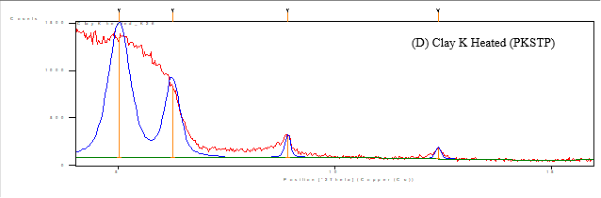 Figure 9
Introduction
The location of soil organic matter (SOM) in the soil structure appears to be the key factor governing SOM stocks and dynamics (Oades, 1988). An aggregate is a naturally occurring cluster or group of soil particles that cohere more strongly than the surrounding particles. The size distribution of soil aggregates is important because the size of aggregates determines their susceptibility to the loss of soil organic matter (Tisdall and Oades 1982). Microaggregates are considered to be the repository of the most stable C pool in soils (Edwards and Bremner 1967;Tisdall and Oades 1982;Six et al. 2000), and the largest proportion of C input into stable soil organic matter pools was found in microaggregates (Kong et al. 2005). Torn et al. (1997) reported that the largest changes in the quantity and turnover of soil organic carbon across landscapes and over long timescales may be due to variations in passive (mineral-stabilized) carbon deep in the soil. Passive carbon pools are controlled by soil mineralogy (Torn et al., 1997). Soil minerals found in different soil types affect soil carbon dynamics. Therefore, soil mineralogy is important in determining the quantity of organic carbon stored in soil, its turnover time, and atmosphere-ecosystem carbon fluxes during long-term soil development (Torn et al. 1997). Baldock and Skjemstad (2000) described the stabilization of organic materials by the soil matrix is a function of nature of mineral fractions and its surfaces capable of adsorbing organic materials. X-ray diffraction is the most common technique used to study the characteristics of crystalline structures and determine the mineralogy of finergrained sediments, especially clays. X-ray diffraction analysis is a useful method for identifying and making semiquantitative estimates of the crystalline mineral components of soil. The intensities of the diffraction maxima are related to the number of corresponding diffraction planes in a sample and provide a basis for estimating the concentrations of the mineral species present. This study aimed to analyze the soil aggregate composition and carbon content of soil aggregate fractions in different forest ecosystems. We also aimed to study the differences in clay mineralogy of soils from the two studied forest divisions using X-ray diffraction.
Materials and Methods
Materials and Methods
Study Site
The study sites are located in the YFD in the northeastern part of Haryana State in the Siwalik region. Geologically, the Siwalik belong to the tertiary deposits of the outer Himalayas and are chiefly composed of low sandstone and conglomerate hills, the solidified and upheaved detritus of the great range. The configuration of the tract is variable, consisting of the Siwaliks, foot hills, and plains with gentle slopes. The study was performed in the Siwalik ranges, the foot hills of the northwestern Himalaya located at 30 ° 00′ 00″ to 30 ° 30′ 00″N latitude and 70 ° 00′ 00″ to 77 ° 00′ 45″E longitude in the forests of Kalesar National Park in Yamunanagar Forest Division (YFD) and between longitude 76 ° 46′ 40″ to 77 ° 0′ 33″E and latitude 30 ° 40′50″ to 30 ° 54′ 40″N in the reserved and protected forests of Panchkula forest divisions (PFD) of northern Haryana covering an altitude of 300 to 650 msl at Kalesar forest and 370 to 1100 m at Morni hills. The climate of the area is subtropical monsoonal. The annual rainfall varies from 716 to 1897 mm. The Siwaliks are composed of alluvial detritus from the solidified and upheaval detritus of the Great Himalayan Range (Wadia, 1961) in northern India. Soil sampling was conducted using a soil corer (12 cm diameter) at depth interval of 0-15 cm, 15-30 cm, 30-45 cm, 45-60, and 60-100 cm, with five replicate samples for each depth. Samples from six forest types (Champion and Seth, 1968) covering northern tropical dry deciduous Shorea robusta plain forests, northern tropical dry deciduous siwalik Shorea robusta forests, mixed dry deciduous forests in YFD and Dry deciduous forests, mixed dry deciduous forests, and sub-tropical pine forests in PFD were transported to the laboratory in polythene bags and stored at low temperatures.
Analysis of Soil Characteristics
To analyze the effect of vegetation composition on soil organic matter (SOM) in forest ecosystems, soil samples were collected from various forest systems. After removing the ground floor litter and plant residues, the underlying soil was sampled using a soil corer (12 cm diameter) at depth interval of 0-15 cm, 15-30 cm, 30-45 cm with five replicate samples obtained for each depth. At the time of analysis, the soil samples were air-dried and sieved using a 2 mm sieve to ensure complete sieving, discarding only the recognizable plant residues and pebbles. Subsamples of air-dried soil were used to determine the soil pH and organic carbon content. Soil bulk density was determined by collecting a known volume of soil using a metallic corer at depths of 0-15 cm, 15-30 cm, 30-45 cm of soil depth and the soil was dried at 100 °C until a constant weight was achieved. The bulk density was determined using the soil weight/volume relationship. Soil pH was determined using a soil and distilled water (1:2 w/v) suspension and an electronic pH meter.
Analysis of Organic Carbon
Subsamples of air-dried soil and separated soil aggregates were analyzed for organic carbon using the dichromate oxidation method (Kalembasa and Jenkinson 1973). The organic carbon content of the soil was oxidized by the nascent oxygen produced during the reaction of concentrated sulfuric acid using 0.5N potassium dichromate. The residual potassium dichromate was titrated with 0.2N ferrous ammonium sulfate using diphenylamine as an indicator in the presence of phosphoric acid.
Statistical Analysis
The data on soil carbon and soil aggregate carbon were analyzed using one-way analysis of variance. Least significant difference (LSD) values at the 5% level of significance (p≥0.05) were calculated following Gomez and Gomez (1984).
X-Ray Diffraction (XRD) for Clay Mineralogy
Soil samples from 0-15 cm soil depth were collected from different forest ecosystems of the Yamunanagar and Panchkula forest divisions from April 2023 to October 2024. The soil samples were air-dried, gently crumbled manually, and sieved (2 mm) to remove plant debris and root materials. The soil samples were further processed by taking five replicates (10 g air-dried soil) to collect a sufficient amount of clay for X-ray diffraction (XRD).
Removal of soluble salts
First, 50 ml of 1 N NaCH 3 COO (pH 5.0) was added to a 500 ml beaker, stirred, and kept overnight. Next morning 10-15 ml of 1 N NaCH 3 COO was added again; if effervescence persisted, more reagent was added. If no effervescence appeared, the mixture was centrifuged at 1500 rpm for 5 min. The supernatant was discarded. This treatment helps in the removal of CaCO 3, and an acidic pH helps in the removal of organic carbon.
Removal of organic matter
The organic matter in the soil samples was decomposed by treatment with hot 6% H 2 O 2 with constant stirring at low heat using a hot water bath. To ensure complete decomposition of soil organic matter, the soil samples were treated twice with 6% H 2 O 2 . The digested soil samples were then transferred to a 1 Litre sedimentation cylinder with repeated washings with deionized water to raise the volume to one litre and allowed to settle for 12 h (overnight). The suspended clay (< 2µm) in the sedimentation cylinders was siphoned out in a 500 ml corning glass beaker by repeated sedimentation and decantation. The clay suspension was collected in a beaker. The < 2µm clay fraction that was wholly separated from the soil was used to examine the clay mineralogical composition using X-ray diffraction (XRD). Duplicate clay solutions containing 50 mg clay each were placed into 10 ml glass tubes and then washed twice with 8 ml of an equal mixture of 1M Nacl and 1M NaCH 3 COO (pH 5.0) by centrifugation to lower the pH. Of the duplicate sets, one was saturated with K and the other with Mg by washing three times with 8 ml of 1 M KCl and 0.5M MgCl 2, respectively.
Magnesium saturation
For Mg saturation, the sample tube was filled with MgCl 2 and allowed to flocculate. The mixture was centrifuged and washed again with MgCl 2 .The sample was washed with MgOAc, followed by washing with MgCl 2, centrifugation, and discarding of the supernatant. Equal volumes of distilled water and methanol were added, and the sample was centrifuged. After centrifugation, the supernatant was discarded. The samples were repeatedly washed with absolute methanol until they were chloride-free. Now added 1-2 drops of acetone if it does not settle in the last washing. The acetone was completely drained, and the samples such for 5-10 minutes and after The volume was then increased to 10 ml with distilled water.
Potassium saturation
For K saturation, the sample tube was filled with KCl and allowed to flocculate. The mixture was centrifuged and washed again with KCl. The sample was washed with KOAc and KCl, centrifuged again, and the supernatant was discarded. Equal volumes of distilled water and methanol were added, and the sample was centrifuged. After centrifugation, the supernatant was discarded. The samples were repeatedly washed with absolute methanol until they were chloride-free. Now, added 1-2 drops of acetone if it does not settle in the last washing. The acetone was completely drained, and the samples such for 5-10 minutes and after The volume was then increased to 10 ml with distilled water. The clay samples in the tube were thoroughly suspended in 1 ml of water. An aliquot of 0.4 ml of the clay solution was dropped onto a glass slide (28×48 mm) covering two-thirds of its area, air dried, and X-rayed. Clay samples prepared for analysis were examined in the following order to efficiently identify and differentiate the characteristic mineral components. (1) Mg-saturated, air-dried samples; (2) Mgsaturated, Glycerol solvated samples (for 48 h); (3) Ksaturated, air-dried samples; and (4) K-saturated, heated samples (heated at 550 0 °C for 4 h in a muffle furnace). The XRD analysis of samples was performed using an XPERT-PRO model diffractometer with Cu as anode material using CuKα radiations at 45KV and 40mA (λ 1.54443 Å) and at a scanning speed of 0.017 in a continuous scanning mode over a range of the 2θ range 4º to 30º (Mgsaturated samples) and 4 o 2θ to 20 o 2θ position (K-saturated samples). Clay minerals were identified following Brown and Brindley (1980) and Moore and Reynolds (1989). The relative mineral content in the clay fractions was semiquantitatively estimated based on the XRD peak intensities. In the present estimation, the peak height was used as the peak intensity by assuming the relative proportion of the minerals of the samples normalized to 100% and the same proportionality between the peak intensity and the content for each mineral.
Results:= Analysis of Soil Characteristics
The variation in soil characteristics of the studied forest ecosystems is shown in Table 1. In northern tropical dry deciduous Shorea robusta forests, pH was found to increase with depth, ranging from 6.27±0.06 to 6.82±0.09, with increasing bulk density (1.10±0.04 to 1.34±0.05). In northern tropical dry deciduous Shiwalik Shorea robusta forests, the pH was comparatively higher than that of plain northern tropical dry deciduous Shorea robusta forests, ranging from 7.83±0.07 to 8.24±0.05 with increasing soil depth and bulk density (Table 1). In mixed dry deciduous forests, the pH varied from 6.99±0.07 to 7.52±0.05 in the Yamunanagar forest division. In the Panchkula forest division, the pH of dry deciduous forests, mixed dry deciduous forests, and sub-tropical pine forests ranged from 5.89±0.03 to 8.34±0.05, with a variation in bulk density from 1.17±0.08 to 1.33±0.06 (Table 1).
| Forest Type | Soil depth (cm) | pH (1:2) | EC (µS) | Organic carbon (%) | Bulk density | Soil carbon pool (Mg ha-1) |
|---|---|---|---|---|---|---|
| Northern tropical dry deciduous Shorea robusta forest | 0-15 | 6.27±0.06 | 284±10.19 | 0.628±0.003 | 1.10±0.04 | 10.40±0.29 |
| 15-30 | 6.54±0.05 | 244±12.83 | 0.431±0.004 | 1.18±0.06 | 7.63±0.39 | |
| 30-45 | 6.67±0.10 | 192±14.71 | 0.136±0.003 | 1.22±0.05 | 2.48±0.11 | |
| 45-60 | 6.72±0.05 | 134±5.88 | 0.037±0.001 | 1.30±0.06 | 0.72±0.05 | |
| 60-100 | 6.82±0.09 | 128±5.65 | 0.014±0.001 | 1.34±0.05 | 0.75±0.08 | |
| Mixed dry deciduous forests (Yamuna nagar forest division) | 0-15 | 6.99±0.07 | 175±2.94 | 0.511±0.004 | 1.07±0.06 | 8.20±0.44 |
| 15-30 | 7.08±0.03 | 212±8.48 | 0.425±0.002 | 1.11±0.05 | 7.10±0.32 | |
| 30-45 | 7.31±0.09 | 361±8.73 | 0.092±0.003 | 1.19±0.05 | 1.64±0.18 | |
| 45-60 | 7.48±0.04 | 122±9.09 | 0.062±0.006 | 1.26±0.05 | 1.17±0.35 | |
| 60-100 | 7.52±0.05 | 117±7.87 | 0.009±0.004 | 1.31±0.07 | 0.45±0.26 | |
| Northern shiwalik dry deciduous Shorea robusta forest | 0-15 | 7.83±0.07 | 259±9.27 | 0.693±0.004 | 1.14±0.08 | 11.42±0.33 |
| 15-30 | 8.04±0.10 | 337±9.0 | 0.429±0.005 | 1.21±0.06 | 7.79±0.49 | |
| 30-45 | 8.11±0.04 | 250±9.09 | 0.141±0.004 | 1.27±0.10 | 2.68±0.22 | |
| 45-60 | 8.19±0.02 | 178±4.32 | 0.670±0.002 | 1.38±0.08 | 1.39±0.14 | |
| 60-100 | 8.24±0.05 | 121±8.5 | 0.210±0.006 | 1.34±0.14 | 1.09±0.40 | |
| Dry deciduous forests | 0-15 | 6.72±0.08 | 165±4.54 | 0.373±0.008 | 1.17±0.08 | 6.55±0.55 |
| 15-30 | 7.18±0.07 | 221±9.62 | 0.184±0.005 | 1.23±0.07 | 3.39±0.29 | |
| 30-45 | 7.31±0.10 | 331±12.83 | 0.032±0.005 | 1.28±0.04 | 0.61±0.09 | |
| 45-60 | 7.68±0.07 | 128±2.82 | 0.012±0.003 | 1.35±0.05 | 0.24±0.07 | |
| 60-100 | 7.54±0.11 | 117±17.72 | 0.004±0.001 | 1.38±0.10 | 0.22±0.07 | |
| Mixed dry deciduous forests (Panchkula forest division) | 0-15 | 7.92±0.04 | 269±10.03 | 0.494±0.003 | 1.17±0.07 | 8.67±0.54 |
| 15-30 | 8.14±0.08 | 343±10.03 | 0.243±0.004 | 1.21±0.06 | 4.41±0.26 | |
| 30-45 | 8.23±0.04 | 257±12.83 | 0.048±0.002 | 1.29±0.05 | 0.93±0.02 | |
| 45-60 | 8.39±0.07 | 181±11.57 | 0.014±0.003 | 1.33±0.04 | 0.27±0.06 | |
| 60-100 | 8.34±0.05 | 137±7.87 | 0.006±0.001 | 1.31±0.03 | 0.31±0.18 | |
| Sub tropical pine forest | 0-15 | 5.89±0.03 | 258±10.98 | 1.011±0.006 | 1.21±0.06 | 18.35±1.08 |
| 15-30 | 5.99±0.05 | 237±10.80 | 0.307±0.002 | 1.26±0.09 | 5.80±0.49 | |
| 30-45 | 6.12±0.08 | 201±12.96 | 0.091±0.003 | 1.29±0.09 | 1.76±0.09 | |
| 45-60 | 6.21±0.08 | 198±14.44 | 0.034±0.005 | 1.32±0.10 | 0.67±0.15 | |
| 60-100 | 6.37±0.11 | 178±7.87 | 0.018±0.006 | 1.33±0.06 | 0.95±0.26 |
Table text extracted from the original PDF; superscript letters are shown inline. The original table image is below.
View original table image
Soil Organic carbon
The organic carbon concentrations (g kg -1 ) in the soil of various forest types at Yamunanagar and Panchkula forest divisions up to a depth of one meter are presented in Table 2. A regular significant decrease in organic carbon concentration (p<0.05) was observed at all forest types along the depth of up to one meter soil profile under the study area. At the Yamunanagar forest division, the soil carbon concentration (g kg -1 ) was found to be maximum at the northern tropical dry deciduous Shiwalik Shorea robusta forests at 0-15 cm soil depth (6.93±0.27), followed by the northern tropical dry deciduous Shorea robusta forests (6.28±0.03) and mixed dry deciduous forests (5.11±0.07), which decreased significantly with an increase in soil depth in all forest types (Table 2). In the Panchkula forest division, the maximum carbon concentration (g kg -1 ) was observed in sub-tropical pine forests (10.11±0.07), followed by mixed dry deciduous forest ecosystems (4.94±0.04) and dry deciduous forest ecosystems (3.73±0.10), along with a significant decrease (p<0.05) in carbon concentration with increasing depth up to a one-meter profile. In the northern tropical dry deciduous Shorea robusta forest, the total soil carbon (Mg C ha -1 ) at different soil depths was 10.40±0.29 (0-15 cm), 7.63±0.39 (15-30 cm), 2.48±0.11 (30-45 cm), 0.72±0.05 (45-60 cm), and 0.75±0.08 (60-100 cm). The carbon pool at 0-30 cm soil depth was 82.02% of the total pool up to 100 cm soil depth. The total soil carbon pool at the northern tropical Shiwalik Shorea robusta forest was 11.42±0.33 (0-15 cm), 7.79±0.49 (15-30 cm), 2.68±0.22 (30-45 cm), 1.39±0.14 (45-60 cm), and 1.09±0.40 (60-100 cm). The carbon pool at 0-30 cm soil depth was 78.83 % of the total pool up to 100 cm soil depth. The spatial distribution of the soil organic carbon pool in mixed dry deciduous forests at the Yamunanagar forest division was 8.20±0.44 (0-15 cm), 7.10±0.32 (15-30 cm), 1.64±0.18 (30-45 cm), 1.17±0.35 (45-60 cm), and 0.45±0.26 (60-100 cm). Approximately 82.43% of the total carbon pool was confined to the top 30 cm of soil. In the dry deciduous forest of the Panchkula forest division, the total soil carbon (Mg C ha -1 ) at different soil depths was 6.55±0.55 (0-15 cm), 3.39±0.29 (15-30 cm), 0.61±0.09 (30-45 cm), 0.24±0.07 (45-60 cm), and 0.22±0.07 (60-100 cm). The total soil organic carbon pool in mixed dry deciduous forests at Panchkula forest division was found to vary 8.67±0.54 (0-15 cm); 4.41±0.26 (15-30 cm); 0.93±0.02 (30-45 cm); 0.27±0.06 (45-60 cm); 0.31±0.18 (60-100 cm). The carbon pool at 0-30 cm soil depth in dry deciduous and mixed dry deciduous forests were 89.79% and 89.71% of the total pool up to 100 cm soil depth, respectively. Approximately 87.82% of the total carbon pool was present up to 30 cm in the subtropical pine forests of the Panchkula forest division, accounting for 18.35±1.08 (0-15 cm); 5.80±0.49 (15-30 cm); 1.76±0.09 (30-45 cm); 0.67±0.15 (45-60 cm); and 0.95±0.26 (60-100 cm).
| Soil depth (cm) | Soil carbon (g kg-1) | — | — | — | — | — |
|---|---|---|---|---|---|---|
| Yn-SRP | Yn-SSR | Yn-MDDF | Pk-DDF | Pk-MDDF | Pk-STP | |
| 0 – 15 | 6.28±0.03 | 6.93±0.27 | 5.11±0.07 | 3.73±0.10 | 4.94±0.04 | 10.11±0.07 |
| 15 - 30 | 4.31±0.07 | 4.29±0.04 | 4.25±0.04 | 1.84±0.10 | 2.43±0.03 | 3.07±0.04 |
| 30 – 45 | 1.36±0.09 | 1.41±0.03 | 0.92±0.05 | 0.32±0.07 | 0.48±0.04 | 0.91±0.09 |
| 45 – 60 | 0.37±0.08 | 0.67±0.09 | 0.62±0.10 | 0.12±0.02 | 0.14±0.01 | 0.34±0.06 |
| 60 – 100 | 0.14±0.04 | 0.21±0.02 | 0.09±0.04 | 0.04±0.01 | 0.06±0.01 | 0.18±0.04 |
| CV (%) | 5.764 | 9.686 | 5.838 | 12.53 | 4.018 | 4.607 |
| LSD (p>0.05) | 0.216 | 0.387 | 0.192 | 0.228 | 0.097 | 0.202 |
Table text extracted from the original PDF; superscript letters are shown inline. The original table image is below.
View original table image
Soil Aggregates carbon
The concentration of carbon in soil aggregate fractions followed the order: Small macroaggregates > macroaggregates > microaggregates > silt and clay fractions in the Yamunanagar forest division. The concentration of total organic carbon decreased with reduced aggregate size at all depths and locations. The organic carbon content in soil aggregates varied significantly with soil depth (p<0.05). There was a significant increase in carbon concentration (g kg -1 ) with increasing aggregate size class. The total carbon concentration was greater in smaller microaggregates (250µm-53µm) as compared to silt and clay associated with soil fractions (<53µm) (Tables 3 &4). In the forest ecosystems of the Yamunanagar forest division, the carbon concentration in different size fractions ranged from 0.18 to 4.82 g kg -1 in northern tropical dry deciduous Shorea robusta forests, 0.14 to 4.20 g kg -1 in northern tropical dry deciduous shiwalik Shorea robusta forests, and 0.15 to 5.22 g kg -1 in mixed dry deciduous forests (Table 3). In forest ecosystems of the Yamunanagar forest division, the carbon concentration in macroaggregates (> 2 mm) varies from 0.39 g kg-1 to 4.31 g kg -1 , in small macro aggregates (2 mm-250 µm) 0.32-5.22 g kg -1 , in microaggregates (250µm -53 µm) 0.17 to 2.48 g kg -1 , silt, and clay associated fraction (< 53 µm) 0.14 to 1.89 g Kg -1 . The carbon content of silt and clay fractions varied from 0.18 to 1.86 g kg -1 in northern tropical dry deciduous Shorea robusta forests and 0.14 to 1.76 g kg -1 in northern tropical dry deciduous shiwalik Shorea robusta forests up to 1m soil depth. In mixed dry deciduous forests, the carbon content in the silt and clay fractions varied from 0.15 to 1.89 g kg -1 (Table 3). The concentration of carbon in soil aggregate fractions followed the order: macroaggregates > microaggregates > silt and clay fractions in the Panchkula forest division. The carbon concentration in different size fractions at Panchkula forest division varied from 0.28 to 3.25 g kg -1 in dry deciduous forests, 0.09 to 4.04 g kg -1 at in mixed dry deciduous forests, and 0.76 to 9.96 g kg -1 in sub-tropical pine forests. Carbon concentration in macroaggregates (> 2mm) varied from 0.75 to 9.96 g kg -1 , in small macro aggregates (2mm-250µm) 0.82-8.09 g kg -1 , in microaggregates (250µm -53 µm) 0.13 to 3.54 g kg -1 , silt and clay associated fraction (< 53 µm) 0.09 to 2.99 g Kg -1 in forest ecosystems of Panchkula forest division (Table 4) Soil organic carbon showed the positive correlation with above ground biomass distributed within studied systems [northern tropical dry deciduous siwalik shorea robusta (R 2 =0.91), northern tropical dry deciduous shorea robusta (R 2 = 0.90), Mixed dry deciduous forests at Yamunanagar (R 2 =0.66), Mixed dry deciduous forests at Panchkulla (R 2 = 0.97), Dry deciduous forests (R 2 =0.99) and Sub-tropical pine (R 2 =0.92) (Figure 1). The organic carbon content in soil aggregates varied significantly among the size fractions and soil depths (p<0.05). There was a significant increase in carbon concentration (g kg -1 ) with increasing aggregate size class. Positive correlations were found to exist between total organic carbon and soil aggregate fraction carbon [> 2 mm (R 2 =0.98), 2 mm-250µm (R 2 =0.99), 250µm -53 µm (R 2 =0.95), and <53µm (R 2 =0.90)] at the soil depth of 0-15 cm at Yamunanagar (Figure 2) as well as at Panchkula forest division (Figure 3) [> 2 mm (R 2 =0.96), 2 mm-250µm (R 2 =0.91), 250µm -53 µm (R 2 =0.99), and <53µm (R 2 =0.98)]. The XRD patterns of the Mg-saturated-air-dried samples, Mg-saturated-glycerol-solvated samples, K-saturated-airdried samples, and K-saturated-heated samples of the northern tropical plain dry deciduous S. robusta forests in the Yamunanagar forest division are shown in Figure 4. Smectite in clay samples can be identified by the broader peak at approximately 17.50 A o in Mg-saturated and glycerol-solvated specimens. The clay fraction is codominated by illite, which was identified by the presence of a 3.34 Å peak along with its higher order reflections at 9.97 Å and 4.98 Å. The presence of chasmosite was ascertained by the relatively sharp peaks at 7.077A o in the glycolated sample. In heated glycolated samples, the peak of chasmosite disappeared, indicating its presence in the soil. The peak at 4.25 A o showed the presence of dickite, and its stability in glycolated samples confirmed its presence at the sampled site. In the glycolated samples, the dominance of illite and mica was confirmed by the presence of peaks at 3.34 Å and 10.01 Å. The XRD patterns of the Mg-saturated, air-dried samples, Mg-saturated, glycerol-solvated samples, K-saturated, airdried samples, and K-saturated, heated samples of the northern tropical Shiwalik dry deciduous Shorea robusta forests in the Yamunanagar forest division are shown in Figure 5. The clay fraction is mainly dominated by Illitevermiculite intergrade, which was identified by the presence of a 3.34 Å peak along with its higher order reflections at 10.00 Å and 4.99 Å. The peaks for vermiculite and illite nearby coincide approximately. However, the dominance of vermiculite was confirmed by a decrease (37.19% to 8.06%) in the intensity of the 10.00 A o peak after K-saturation and a slight increase (8.06% to 12.99%) in the intensity after heating at 550 °C. The presence of kaolinite was ascertained by relatively sharper peaks at 3.56 Å along with its higherorder reflection at 7.15 Å. The presence of the chloritevermiculite intergrade was reported by 14.11 Å reflections in the Mg-saturated clay samples, which were shifted (from 6.263 2θ position to 6.292 2θ position) towards 10.00 Å by heating at 550 °C. The XRD patterns of the Mg-saturated, air-dried samples, Mg-saturated, glycerol-solvated samples, K-saturated, airdried samples, and K-saturated, heated samples of northern tropical mixed deciduous forests in the Yamunanagar forest division are shown in Figure 6. The 14.03 Å A o d spacing under both Mg and K saturation confirmed that it corresponds to the non-swelling type of vermiculite. The reduction in the 14 A o peak intensity reflections (from 62.03% to 51.27%) on K-saturation showed the presence of a small amount of chloritized vermiculite. Furthermore, the presence of the chlorite-vermiculite intergrade was substantiated by the shifting of the 2θ position (from 6.297 to 6.329) towards 10.00 A o K-saturated heating at 550 °C. Illite-vermiculite intergrade was identified by the peaks at 9.95A o with an integral series of basal reflections at 4.99A o and 3.34A o . Along with the dominant clay minerals, the presence of some other minerals like Quartz, and Kaolinite was confirmed by the relative peaks at 4.25 Å and 7.1 Å dspacing, respectively. The presence of kaolinite was confirmed by its internal reflection order at 3.54 A o .
| Soil depth (cm) | Soil aggregate carbon (g kg-1) | — | — | — | — |
|---|---|---|---|---|---|
| Soil carbon (g kg-1) | >2mm | 2 mm–250 µm | 250µm–53 µm | <53µm | |
| Dry deciduous forests | |||||
| 0 –15 | 3.73±0.10 | 3.25±0.11 | 2.43±0.12 | 1.31±0.17 | 1.10±0.08 |
| 15 – 30 | 1.84±0.10 | 2.48±0.12 | 2.29±0.18 | 1.16±0.17 | 0.92±0.20 |
| 30 – 45 | 0.32±0.07 | 1.76±0.16 | 1.81±0.25 | 0.10±0.02 | 0.07±0.01 |
| 45 – 60 | 0.12±0.02 | 0.92±0.10 | 1.91±0.08 | 0.56±0.07 | 0.23±0.05 |
| 60 – 100 | 0.04±0.01 | 0.75±0.03 | 0.82±0.14 | 0.47±0.15 | 0.28±0.05 |
| CV (%) | 12.53 | 12.15 | 18.15 | 17.23 | 20.417 |
| LSD (p>0.05) | 0.228 | 0.335 | 0.506 | 0.404 | 0.313 |
| Mixed dry deciduous forests | |||||
| 0 –15 | 4.94±0.04 | 4.04±0.13 | 3.09±0.07 | 1.48±0.06 | 1.21±0.07 |
| 15 – 30 | 2.43±0.03 | 1.87±0.15 | 2.92±0.09 | 1.58±0.11 | 1.14±0.11 |
| 30 – 45 | 0.48±0.04 | 2.21±0.12 | 2.13±0.04 | 0.88±0.10 | 0.39±0.08 |
| 45 – 60 | 0.14±0.01 | 1.11±0.12 | 1.42±0.11 | 0.59±0.10 | 0.29±0.07 |
| 60 – 100 | 0.06±0.01 | 1.03±0.18 | 1.07±0.21 | 0.13±0.04 | 0.09±0.01 |
| CV (%) | 4.018 | 14.16 | 11.95 | 20.64 | 12.78 |
| LSD (p>0.05) | 0.097 | 0.436 | 0.382 | 0.272 | 0.231 |
| Subtropical pine forests | |||||
| 0 –15 | 10.11±0.07 | 9.96±0.04 | 8.09±0.06 | 3.54±0.05 | 2.99±0.06 |
| 15 – 30 | 3.07±0.04 | 6.01±0.07 | 6.32±0.02 | 3.05±0.02 | 2.67±0.05 |
| 30 – 45 | 0.91±0.09 | 4.71±0.05 | 5.01±0.07 | 0.29±0.08 | 0.22±0.03 |
| 45 – 60 | 0.34±0.06 | 2.47±0.06 | 2.69±0.05 | 2.83±0.06 | 2.78±0.02 |
| 60 – 100 | 0.18±0.04 | 2.07±0.07 | 2.29±0.05 | 1.19±0.02 | 0.76±0.06 |
| CV (%) | 4.607 | 2.532 | 2.328 | 5.107 | 5.762 |
| LSD (p>0.05) | 0.202 | 0.192 | 0.171 | 0.167 | 0.163 |
Table text extracted from the original PDF; superscript letters are shown inline. The original table image is below.
View original table image
| Soil depth (cm) | Soil aggregate carbon (g kg-1) | — | — | — | — |
|---|---|---|---|---|---|
| Soil carbon (g kg-1) | >2mm | 2 mm – 250 µm | 250µm – 53 µm | <53µm | |
| Northern tropical dry deciduous Shorea robusta forest | |||||
| 0 –15 | 6.28±0.03 | 4.02±0.02 | 4.82±0.02 | 2.12±0.02 | 1.86±0.01 |
| 15 – 30 | 4.31±0.07 | 2.25±0.01 | 2.28±0.01 | 1.99±0.03 | 1.85±0.01 |
| 30 – 45 | 1.36±0.09 | 1.29±0.03 | 1.49±0.02 | 1.18±0.01 | 0.97±0.02 |
| 45 – 60 | 0.37±0.08 | 0.78±0.07 | 0.89±0.02 | 0.49±0.02 | 0.44±0.01 |
| 60 – 100 | 0.14±0.04 | 0.39±0.02 | 0.49±0.02 | 0.28±0.02 | 0.18±0.03 |
| CV (%) | 5.764 | 3.015 | 2.422 | 3.790 | 3.758 |
| LSD (p>0.05) | 0.216 | 0.079 | 0.072 | 0.069 | 0.060 |
| Northern tropical dry deciduous shiwalik Shorea robusta forest | |||||
| 0 –15 | 6.93±0.27 | 3.31±0.07 | 4.20±0.08 | 2.21±0.05 | 1.76±0.03 |
| 15 – 30 | 4.29±0.04 | 1.89±0.09 | 1.79±0.06 | 1.78±0.06 | 1.37±0.07 |
| 30 – 45 | 1.41±0.03 | 1.19±0.03 | 1.13±0.03 | 0.82±0.06 | 0.78±0.07 |
| 45 – 60 | 0.67±0.09 | 0.76±0.06 | 0.69±0.03 | 0.36±0.08 | 0.28±0.06 |
| 60 – 100 | 0.21±0.02 | 0.43±0.08 | 0.32±0.06 | 0.17±0.07 | 0.14±0.05 |
| CV (%) | 9.686 | 10.09 | 18.01 | 7.98 | 6.45 |
| LSD (p>0.05) | 0.387 | 0.221 | 0.347 | 0.172 | 0.167 |
| Mixed dry deciduous forests | |||||
| 0 –15 | 5.11±0.07 | 4.31±0.05 | 5.22±0.05 | 2.48±0.04 | 1.89±0.03 |
| 15 – 30 | 4.25±0.04 | 2.01±0.06 | 2.85±0.04 | 2.39±0.03 | 1.41±0.06 |
| 30 – 45 | 0.92±0.05 | 1.49±0.07 | 1.40±0.08 | 1.17±0.09 | 1.03±0.05 |
| 45 – 60 | 0.62±0.10 | 0.69±0.09 | 0.76±0.05 | 0.39±0.04 | 0.31±0.04 |
| 60 – 100 | 0.09±0.04 | 0.41±0.05 | 0.48±0.09 | 0.32±0.05 | 0.15±0.04 |
| CV (%) | 5.838 | 14.25 | 19.15 | 17.45 | 20.47 |
| LSD (p>0.05) | 0.192 | 0.355 | 0.570 | 0.414 | 0.341 |
Table text extracted from the original PDF; superscript letters are shown inline. The original table image is below.
View original table image
The XRD patterns of the Mg-saturated, air-dried samples, Mg-saturated, glycerol-solvated samples, K-saturated, airdried samples, and K-saturated, heated samples of dry deciduous forests in the Panchkula forest division are shown in Figure 7. Smectite mixed-layer minerals can be identified by poorly defined diffraction patterns between 10.00 Å and 20.00 Å in glycol-solvated samples. The presence of chlorite-vermiculite intergrades was reported by 14.03 A o reflections in the Mg-saturated clay samples. The basal peaks at 7.1 Å indicate the presence of kaolinite, together with the subsequent peak at 3.54 Å. The presence of free quartz in the clays was evident from the 4.24 Å. The clay fraction is mainly dominated by Illite-vermiculite intergrade, which was identified by the presence of a 3.33 Å peak along with its higher order reflections at 9.95 Å and 4.99 Å. The XRD patterns of the Mg-saturated, air-dried samples, Mg-saturated, glycerol-solvated samples, K-saturated, airdried samples, and K-saturated, heated samples of mixed dry deciduous forests in the Panchkula forest division are shown in Figure 8. Smectite in clay samples can be identified by the broader peak at approximately 17.50 A o in Mg-saturated and glycerol-solvated specimens. The clay fraction is co-dominated by illite, which was identified by the presence of a 3.34 Å peak along with its higher order reflections at 9.96 Å and 4.98 Å. The 14.03 Å A o d spacing under both Mg and K saturation confirmed that it corresponds to the non-swelling type of vermiculite. Illite and vermiculite formed an intergrade. The basal peaks at 7.1 Å indicate the presence of kaolinite, together with the subsequent peak at 3.57 Å. The XRD patterns of the Mg-saturated, air-dried samples, Mg-saturated, glycerol-solvated samples, K-saturated, airdried samples, and K-saturated, heated samples of subtropical pine forests in the Panchkula forest division are shown in Figure 9. The main minerals present in subtropical pine forests are illite-vermiculite intergrades, which were confirmed by the presence of a 3.34 Å peak along with higher order reflections at 9.96 Å and 4.99 Å. The 14.14 Å d spacing under both Mg and K saturation confirmed that it corresponds to the non-swelling type of vermiculite. The presence of kaolinite was ascertained by 7.1 Å accompanied by 3.58 Å d-spacing values for peaks. Smectite in clay samples can be identified by the broader peak at approximately 17.65 A o in all the treatments. management systems that increase long-term carbon stability and sequestration in soils. Soil minerals are known to play a stabilizing role in organic matter and the behavior of clayey soils. Organic matter in soil is partially associated with minerals. This association renders soil organic matter less susceptible to biodegradation than when it is free of metals. Therefore, these associations are believed to be controlling factors for carbon storage in the soil (Baldock and Skjemstad 2000). Minerals are naturally occurring homogeneous inorganic solids with a definite chemical composition and specific repeating arrangements of atoms.
The most common minerals found in soils are silicates, including quartz, feldspar, and mica. The primary silicate mineral composition depends on the composition of the parent material and the extent of weathering. Secondary silicates, such as kaolinite and smectite, are formed due to the weathering of primary silicates and are the most important in the clay fraction. The mineralogy of the clay samples from various forest ecosystems in the Yamunanagar and Panchkula forest divisions, as interpreted by XRD patterns, showed that the clay mineral assemblage was dominated by illite -vermiclite intergrade, smectite accompanied by interstratified Quartz, Illite, and Kaolinite in varying concentrations, and negligible proportions of chlorite, muscovite, and chamosite. Clay of all the studied systems, representing the alluvium, is a mixture of identical clay mineral suites-vermiculite, illite, kaolinite, and mixed layer minerals with a very small proportion of accessory non-clay free quartz. No major differences in the peak intensities of the diffractograms showed a uniform distribution of clay minerals throughout all the forest ecosystems of the Siwalik region. This might be due to the almost uniform climatic conditions and similar parent material in the study area.
The transformation and alteration of minerals into other minerals is assumed to have followed the sequence of mica→ illite → mixed layer minerals → vermiculite →kaolinite, under a comparatively wet moisture regime (Eswaran and Bin 1978). Although the effects of vegetation on the alteration and neo-synthesis of minerals are difficult to separate from those of the climate, the presence of high organic matter and high organic acids (Singhal et al. 1976;Sharma 1982;Singhal and Sharma 1983), wet moisture regime, rich floristic diversity, and root biomass suggest that natural vegetation has a definite role in defining the clay mineralogy of forested regions. The natural vegetation in the studied forests seems to play an important role in the alteration of quartz and neo-synthesis of vermiculite and/or kaolinite. The humid conditions during the rainy season and prolonged dry periods during summer and winter in the studied area are the major factors influencing the clay mineralogy of the forested areas of the Shiwaliks. Thus, soil mineralogy and its spatial variability can lead to a better understanding of how minerals regulate soil carbon stability.
Acknowledgement
AcknowledgementsThe support and encouragement from Kurukshetra University, Kurukshetra are duly acknowledged. Authors would like to acknowledge the help and support received from Haryana Forest Department during the field survey.
References
10 in the original paper- Baldock JA, Skjemstad JO. Role of the soil matrix and minerals in protecting natural organic materials against biological attack. Org Geochem. 2000;31:697-710.
- Brown G, Brindley GW. X-ray diffraction procedure for clay mineral identification. In: Brindley GW, Brown G, editors. Crystal structures of Clay Minerals and their X-ray Identification. Monograph 5. London: Mineralogical Society; 1980. p. 305-360.
- Dhar NR, Jha MN. Clay mineralogy of some forest soils of the eastern Himalayas. J Indian Soc Soil Sci. 1980;28(2):210-7.
- Dhar NR, Jha MN, Sharma RP. Clay mineralogy and genesis of soils under different forest types in the eastern Himalayas. Geoderma. 1988;42:163-74.
- Edwards AP, Bremner JM. Microaggregates in soils. J Soil Sci. 1967;18:64-73.
- Eswaran H, Bin WC. A study of a deep weathering profile on granite in peninsular Malaysia: II. Mineralogy of the clay, silt and sand fractions. Soil Sci Soc Am J. 1977;42:149-53.
- Gomez KA, Gomez AA. Statistical procedures for agricultural research. 2nd ed. New York: Wiley; 1984.
- Jenny H. Factors of soil formation: A system of quantitative pedology. New York: McGraw-Hill; 1941. p. 281.
- Kalembasa SJ, Jenkinson DS. A comparative study of titrimetric and gravimetric methods for the analysis of organic carbon in soil. J Sci Food Agric. 1973;24:108590.
- Kong AYY, Six J, Bryant DC, Denison RF, Van Kessel C. The relationship between carbon input, aggregates, and soil organic carbon stabilization in sustainable cropping systems. Soil Sci Soc Am J. 2005;69:1078-85.