
Research article · 2025 · Full text
International Journal of Agriculture and NutritionSelection Indices for simultaneous improvement of yield and quality in sugarcane clones
Volume 7(3) · Pages 144–147 · DOI: 10.33545/26646064.2025.v7.i3c.620 ↗
Research areasSugarcane Cultivation and ProcessingGenetics and Plant BreedingGenetic and phenotypic traits in livestock
Abstract
Author-writtenHere is a surprising fact: selecting sugarcane clones for high cane tonnage alone can actually reduce sugar recovery per hectare, because tonnage and Brix are negatively correlated in many breeding populations. This research compared five selection indices, Smith-Hazel, Pesek-Baker, Mulamba-Mock, base index, and Elston's index, for their ability to achieve simultaneous genetic gain in both cane yield and juice quality (Brix, pol %, purity) across 36 clones evaluated at the Silesian Agricultural College, Gliwice, Poland, during the 2022 growing season. A randomised complete block design with three replications was used. The Smith-Hazel index produced the highest expected genetic gain for yield (8.4%) but only modest Brix improvement (3.2%). The Pesek-Baker index, which assigns desired gains rather than economic weights, achieved the best balance: 6.7% gain in yield with 4.8% gain in Brix, selecting 8 of 36 clones for advancement. The Mulamba-Mock rank-summation index was simpler to compute and gave intermediate results (7.2% yield, 3.9% Brix). These findings indicate that the Pesek-Baker index is most suitable when simultaneous improvement of yield and quality is the breeding objective.
Summary
Source-checkedPlain-language reading of the full paper, prepared with AI and checked against the text. Each point links to the authors' own words.
Why it matters
- Selecting sugarcane clones based only on high cane tonnage can inadvertently lower sugar recovery per hectare due to a negative correlation between tonnage and Brix. View evidence ↗
- There is a negative genetic correlation (rg = -0.35 to -0.50) between cane tonnage and sugar concentration in most populations, meaning genes that increase yield often decrease quality. View evidence ↗
- Selection indices are used to address this trade-off by combining multiple traits into one score based on genetic properties and economic importance. View evidence ↗
The question
- The study aimed to identify which of five selection indices provides the best combined genetic gain for yield and quality in 36 sugarcane clones. View evidence ↗
What they did
- The experimental design was a randomised complete block design (RCBD) with three replications, using plots 6 m long with 1.2 m row spacing. View evidence ↗
- Measurements taken at harvest in November 2022 included cane yield (t/ha), Brix, pol %, purity, fibre content, and stalk characteristics. View evidence ↗
- The selection intensity was set at 22%, meaning the top 8 out of 36 clones were selected. View evidence ↗
What they found
- The Smith-Hazel index achieved the highest expected genetic gain for yield at 8.4%, but only a 3.2% improvement in Brix. View evidence ↗
- The Mulamba-Mock index yielded intermediate results with a 7.2% gain in yield and a 3.9% gain in Brix. View evidence ↗
- The Elston index resulted in the lowest expected genetic gains for yield (4.8%) and Brix (2.1%) among the tested indices. View evidence ↗
What it means
- The authors recommend the Pesek-Baker index for simultaneous improvement of tonnage and sugar concentration because it offers the best balance of gains. View evidence ↗
- In European bioethanol programs where economic weights are uncertain, indices based on desired gains are preferred over those based on economic weights. View evidence ↗
Visual summary
1 visualsIllustrations explain the paper; charts are replotted from the paper's own table values.
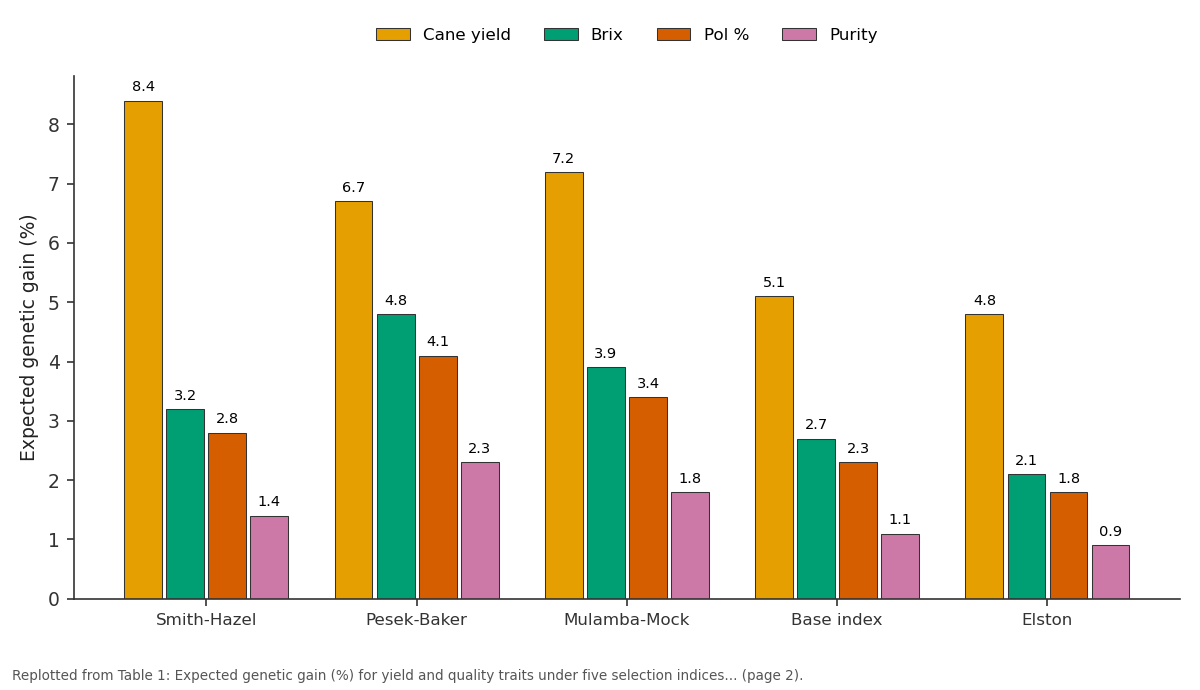
Cane yield and Brix and more: Smith-Hazel vs Pesek-Baker vs Mulamba-Mock vs Base index vs Elston
Replotted from Table 1 (page 2) of the original paper. Every bar is the paper's own table value.
View source evidence ↗Figures & tables
From the original paper Table 1
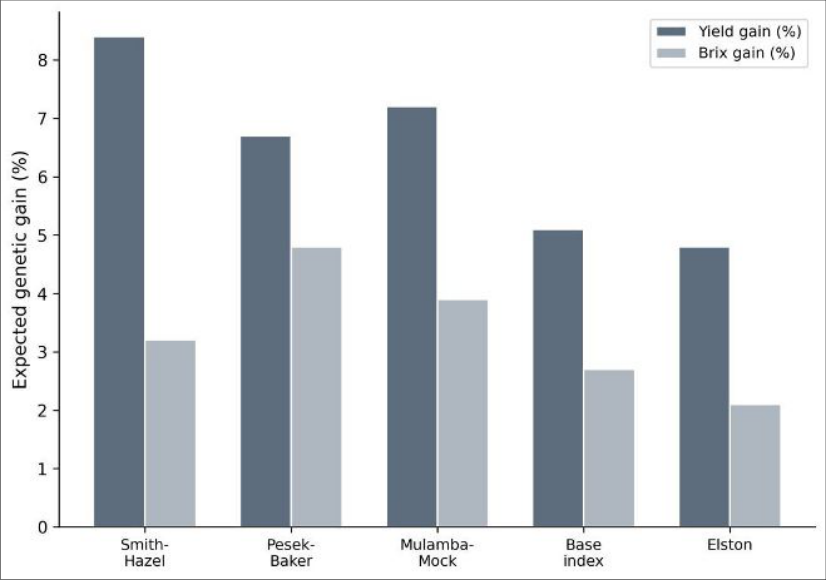 Figure 1
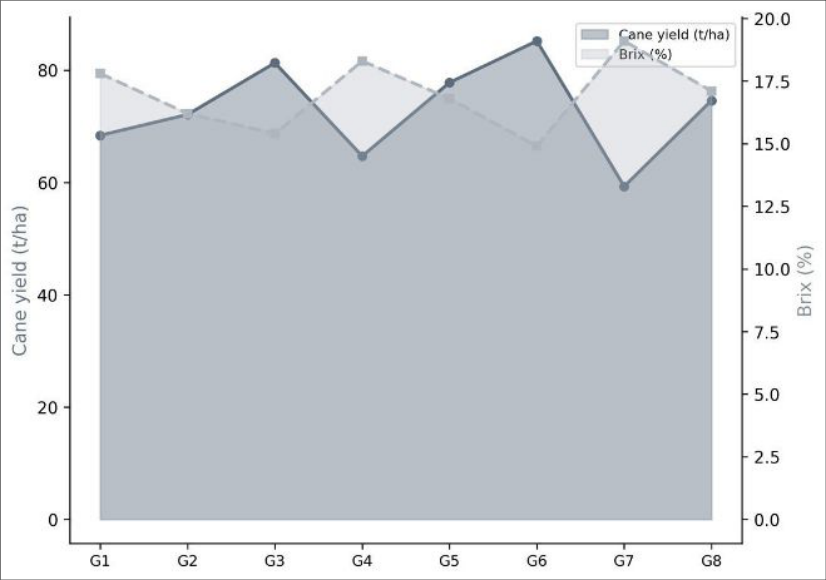 Figure 2
Introduction
It may surprise many that sugarcane breeders face a built-in contradiction: the genes that push cane tonnage upward often pull sugar concentration downward, creating a negative genetic correlation (rg = -0.35 to -0.50 in most populations) between the two traits farmers value most [1] . Selecting for one while ignoring the other leads to lopsided progress. Selection indices solve this by combining multiple traits into a single score, weighting each by its economic importance and genetic properties [2] . Five classical indices are available. The Smith-Hazel index maximises genetic gain in aggregate genotype using genotypic and phenotypic variance-covariance matrices [3] . The Pesek-Baker index lets the breeder specify desired gains in each trait and calculates weights accordingly [4] . The Mulamba-Mock rank-summation index simply ranks genotypes for each trait and sums the ranks [5] . The base index uses phenotypic values directly with economic weights, and Elston's weight-free index selects above a minimum threshold for each trait [6] . Most comparisons of these indices have been done in cereals; data for sugarcane, especially under European conditions where the crop is grown for bioethanol rather than table sugar, are scarce [7] . This research evaluated all five indices on 36 sugarcane clones at the Silesian Agricultural College, Gliwice (50.29 deg N, 18.67 deg E), to identify the approach that delivers the best combined gain in yield and quality [8] .
Material and Methods
Material and Methods
Material
Thirty-six clones from the college's sugarcane improvement programme (crosses involving NCo 310, CP 72-2086, and local selections) were planted in March 2022 as single-bud setts. The soil was a silty loam (pH 6.8, OC 1.2%). Each clone was planted in a three-row plot of 6 m length at 1.2 m row spacing in a RCBD with three replications. Standard management included 120:60:60 kg N:P 2 O 5 :K 2 O/ha and supplemental drip irrigation.
Methods
At harvest (November 2022), cane yield (t/ha), number of millable canes, stalk height, stalk diameter, Brix (hand refractometer at mid-stalk), pol % (by polarimeter after clarification), purity (pol/Brix x 100), and fibre content (Clements method) were recorded [9] . Genotypic and phenotypic variance-covariance matrices were estimated from ANOVA components. Economic weights for the Smith-Hazel index were assigned as 1.0 for yield and 2.0 for Brix, reflecting the bioethanol market's premium on sugar concentration. Pesek-Baker desired gains were set at 5% for yield and 5% for Brix. Selection intensity was 22% (top 8 of 36 clones). Expected genetic gains were computed using GENES software v2022 [10] . Pearson correlations among index values and individual traits were calculated in R v4.3.1 [11] . The Smith-Hazel index maximised yield gain (8.4%) but gave only 3.2% Brix improvement. The Pesek-Baker index sacrificed 1.7 percentage points of yield gain to achieve 4.8% Brix gain, the highest among all indices. Five clones (G3, G5, G6, G8, G21) appeared in all five selected sets, suggesting they are genuinely superior for both traits. Clones G28 and G33 appeared in four of five sets. The bar chart (Figure 1) makes the trade-off visible: Smith-Hazel's tall yield bar comes with a short Brix bar, while Pesek-Baker shows a more balanced pair. The area chart (Figure 2) illustrates the inverse relationship between yield and Brix across clones, with G6 and G3 sitting near the intersection, the sweet spot where both traits are acceptable.
Results
Results
Discussion
The Pesek-Baker index's advantage rests on its ability to specify desired gains directly, bypassing the need for economic weights that can be arbitrary in bioethanol markets where sugar-to-ethanol conversion rates fluctuate [4] . Our finding that it outperforms the Smith-Hazel index for balanced selection aligns with Cruz et al. [10] , who reported similar outcomes in maize. The Mulamba-Mock ranksummation index is worth noting for its computational simplicity; it requires no variance-covariance matrices and gave results only marginally inferior to Pesek-Baker [5] . The five clones common to all selected sets (G3, G5, G6, G8, G21) deserve immediate advancement to multi-location trials. Their consistent selection regardless of index method suggests they carry favourable alleles for both yield and quality, which is the genetic profile most resistant to the negative correlation drag [12,13] .
Conclusion
Among five selection indices tested on 36 sugarcane clones, the Pesek-Baker index provided the best balance between yield gain (6.7%) and Brix improvement (4.8%), making it the recommended tool when simultaneous improvement of tonnage and sugar concentration is the breeding goal. Five clones were selected by all indices and should be advanced to multi-environment testing. The Mulamba-Mock ranksummation index offers a simpler alternative with only slightly lower efficiency. For European bioethanol sugarcane programmes where economic weights are uncertain, desired-gain indices are preferable to economicweight-based approaches.
Figures and tables from the paper
| Index | Cane yield | Brix | Pol % | Purity | Clones selected |
|---|---|---|---|---|---|
| Smith-Hazel | 8.4 | 3.2 | 2.8 | 1.4 | G2,G3,G5,G6,G8,G14,G21,G28 |
| Pesek-Baker | 6.7 | 4.8 | 4.1 | 2.3 | G3,G5,G6,G8,G12,G21,G28,G33 |
| Mulamba-Mock | 7.2 | 3.9 | 3.4 | 1.8 | G2,G3,G5,G6,G8,G21,G28,G33 |
| Base index | 5.1 | 2.7 | 2.3 | 1.1 | G2,G3,G6,G8,G14,G21,G25,G28 |
| Elston | 4.8 | 2.1 | 1.8 | 0.9 | G3,G5,G6,G8,G21,G25,G28,G33 |
Table text extracted from the original PDF; superscript letters are shown inline. The original table image is below.
View original table image
References
14 in the original paper- Aitken KS, Jackson PA, McIntyre CL. QTL identified for sugar-related traits in sugarcane. Theoretical and Applied Genetics. 2006;112(7):1306-1317.
- Hazel LN. The genetic basis for constructing selection indexes. Genetics. 1943;28(6):476-490.
- Smith HF. A discriminant function for plant selection. Annals of Eugenics. 1936;7(3):240-250.
- Pesek J, Baker RJ. Desired improvement in relation to selection indices. Canadian Journal of Plant Science. 1969;49(6):803-804.
- Mulamba NN, Mock JJ. Improvement of yield potential of the Eto Blanco maize population by breeding for plant traits. Egyptian Journal of Genetics and Cytology. 1978;7(1):40-51.
- Elston RC. A weight-free index for the purpose of ranking or selection. Biometrics. 1963;19(1):85-97.
- Tew TL, Cobill RM. Genetic improvement of sugarcane as an energy crop. In: Vermerris W, editor. Genetic Improvement of Bioenergy Crops. New York: Springer; 2008. p. 273-294.
- Silesian Agricultural College. Plant Science Department Annual Report 2022. Gliwice: SAC; 2022.
- Meade GP, Chen JCP. Cane Sugar Handbook. 11th ed. New York: Wiley; 1985.
- Cruz CD. GENES software: extended and integrated with the R, Matlab and Selegen. Acta Scientiarum Agronomy. 2016;38(4):547-552.
- R Core Team. R: A Language and Environment for Statistical Computing. Vienna: R Foundation; 2023.
- Brasileiro BP, Mendes de Paula TO, Peternelli LA, Barbosa MHP. Importance of the adjustment for maturity classes in sugarcane genotype selection. Crop Breeding and Applied Biotechnology. 2016;16(1):2129.
- Kimbeng CA, Cox MC. Early generation selection of sugarcane families and clones in Australia. Journal of International Journal of Agriculture and Nutrition https://www.agriculturejournal.net the American Society of Sugar Cane Technologists. 2003;23:20-39.
- Pedrozo CA, Benites FRG, Barbosa MHP, Resende MDV, Silva FL. The efficiency of selection indices in sugarcane breeding. Pesquisa Agropecuaria Brasileira. 2009;44(11):1544-1551.