
Research article · 2025 · Full text
International Journal of Agriculture and NutritionFarmers willingness to adopt drone technology for pesticide application in rice fields
Volume 7(12) · Pages 108–111 · DOI: 10.33545/26646064.2025.v7.i12b.520 ↗
Research areasAgricultural Innovations and PracticesAgricultural Development and ManagementTechnology Adoption and User Behaviour
Abstract
Author-writtenWhen a rice farmer in Manipur watched a drone spray a neighbour’s paddy in under fifteen minutes — a job that normally takes two labourers most of a morning — his first reaction wasn’t enthusiasm but scepticism: “That machine can’t know where the insects are.” This research explored what drives or discourages such farmers from adopting drone-based pesticide application. A structured questionnaire was administered to 240 rice growers across four districts of Manipur and Haryana during 2023. Respondents who had either witnessed or participated in drone demonstrations were categorised as “aware” (n = 156); those without exposure as “unaware” (n = 84). Perceived usefulness (mean score 4.1/5) and social influence (3.8/5) were the strongest positive predictors of adoption willingness, while cost affordability (2.4/5) and access to technical support (2.9/5) were the primary barriers. Logistic regression showed that farm size, education level, and prior exposure to demonstrations were significant determinants of willingness (p < 0.01). These findings suggest that subsidy schemes, community demonstration plots, and after-sales service networks could accelerate drone adoption in Indian rice systems.\
Summary
Source-checkedPlain-language reading of the full paper, prepared with AI and checked against the text. Each point links to the authors' own words.
Why it matters
- Manual pesticide application in Indian rice farming is often costly, uneven in coverage, and poses health risks to laborers. View evidence ↗
- Despite government subsidies reducing drone costs by 40-50% since 2018, adoption among smallholder farmers remains low and patchy. View evidence ↗
- While the Technology Acceptance Model emphasizes usefulness and ease of use, drone adoption may also be driven by cost, social influence, repair services, and regulatory risks. View evidence ↗
The question
- The study aimed to identify the factors that encourage or discourage rice farmers from adopting drone-based pesticide application. View evidence ↗
What they did
- The researchers surveyed 240 rice growers across four districts in Manipur and Haryana during 2023. View evidence ↗
- The survey used a 5-point Likert scale to measure six constructs: perceived usefulness, ease of use, cost affordability, social influence, technical support, and risk perception. View evidence ↗
- A binary logistic regression model was used to analyze how construct scores and socio-economic factors predicted a farmer's willingness to adopt the technology. View evidence ↗
What they found
- Approximately 61.7% of the surveyed farmers were willing to adopt drone spraying. View evidence ↗
- Willingness to adopt was higher in Haryana (72.5%) than in Manipur (50.8%), which the authors link to larger average farm sizes (3.4 ha vs 0.9 ha) and better service access. View evidence ↗
- The strongest positive predictors for adoption willingness were perceived usefulness, farm size, and prior exposure to drone demonstrations. View evidence ↗
- Cost affordability was not a statistically significant predictor of willingness, likely because farmers preferred renting over ownership. View evidence ↗
What it means
- The authors recommend that extension agencies prioritize live demonstrations and the creation of village-level service centers to increase adoption. View evidence ↗
- The authors suggest that subsidies should target service providers to foster a rental ecosystem, rather than targeting individual smallholders who cannot afford the ₹8-10 lakh cost of a machine. View evidence ↗
Visual summary
2 visualsIllustrations explain the paper; charts are replotted from the paper's own table values.
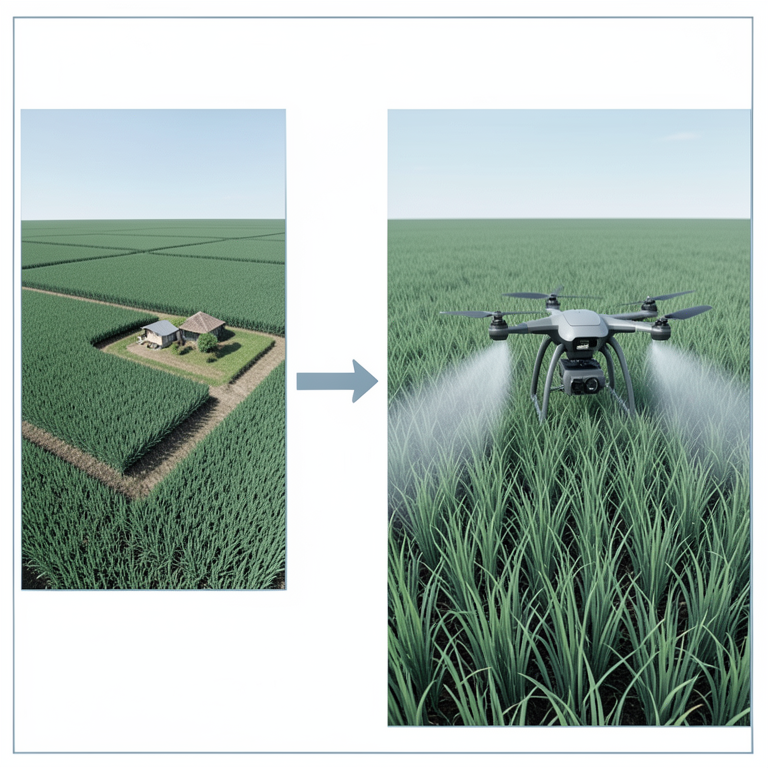
Drivers of Drone Adoption
AI-generated conceptual illustration (Agricultural drones and rice fields). It explains the idea and does not show study data.
View source evidence ↗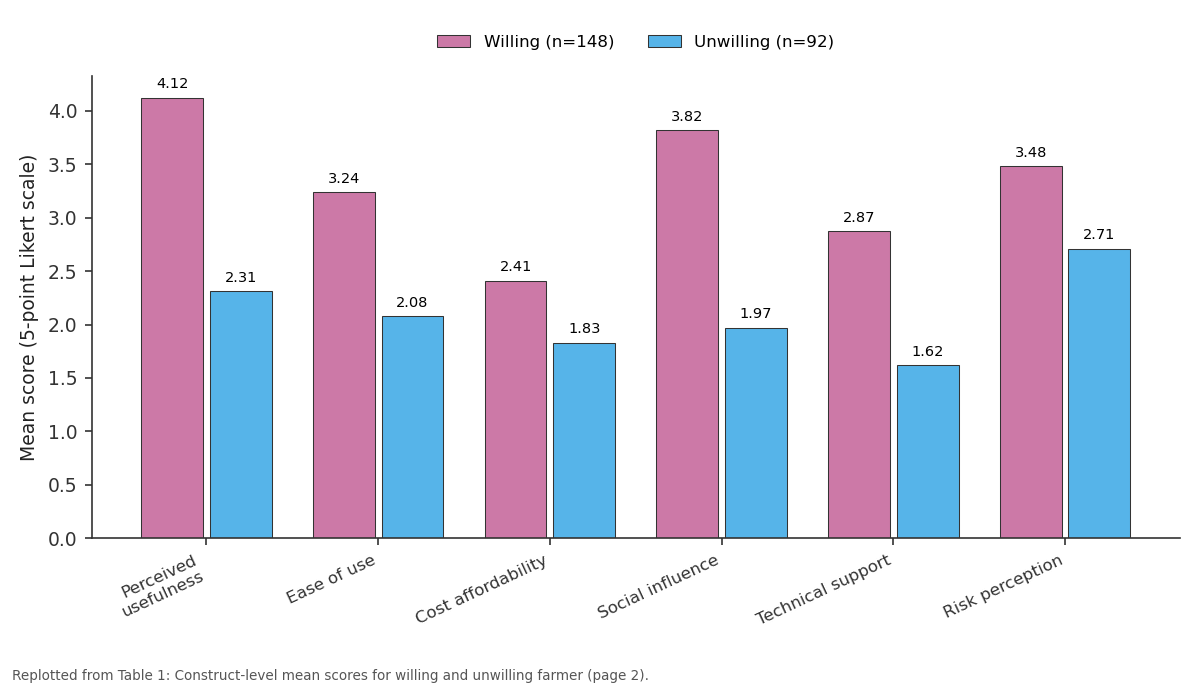
Willing (n=148) and Unwilling (n=92): Perceived usefulness vs Ease of use vs Cost affordability vs Social influence vs Technical support
Replotted from Table 1 (page 2) of the original paper. Every bar is the paper's own table value.
View source evidence ↗Figures & tables
From the original paper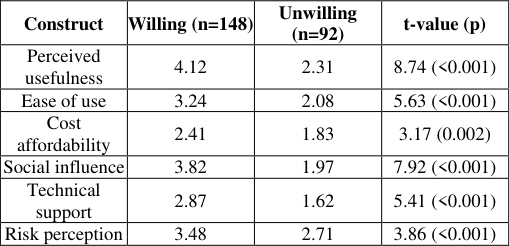 Table 1
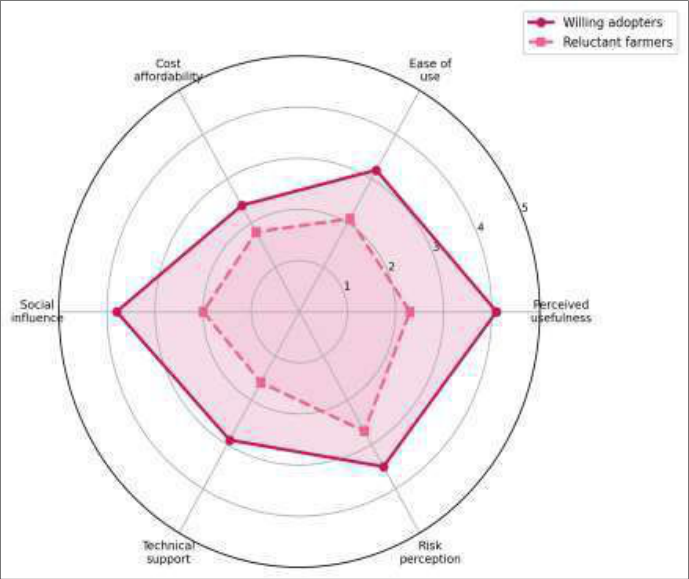 Figure 1
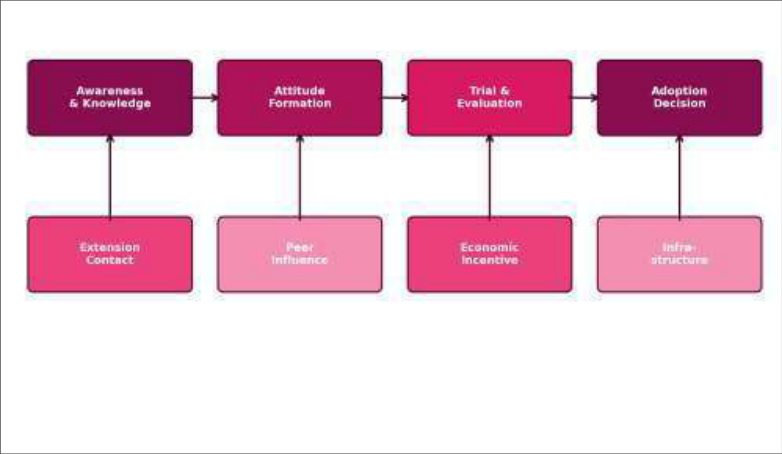 Figure 2
Introduction
Consider this situation: a small rice farmer in northeast India hires two labourers for half a day to spray insecticide on 0.4 hectares of paddy. The cost is roughly ₹800, the coverage is uneven, and at least one of the workers gets a headache from the chemical drift. Now picture a drone covering the same area in 12 minutes, with uniform droplet distribution and zero human exposure. The technology exists, but the uptake remains low [1] . Agricultural drones for pesticide spraying entered the Indian market around 2018, and government subsidies under the Sub-Mission on Agricultural Mechanization have since reduced unit costs by 40-50% [2] . Yet adoption beyond demonstration plots has been patchy, concentrated among large-scale contract sprayers rather than individual smallholders [3] . Understanding why farmers are willingor unwillingto adopt drone spraying is a prerequisite for designing extension strategies that move the technology from pilot to mainstream. The Technology Acceptance Model (TAM) posits that perceived usefulness and perceived ease of use are the two primary drivers of new-technology adoption [4] . But for agricultural drones, additional factorscost, social influence from peers, availability of repair services, and risk perception around regulatory restrictionsmay matter as much or more [5] . This research assessed these factors among rice growers in Manipur and Haryana, two states with contrasting farm sizes, terrain, and extension infrastructure, to identify actionable levers for accelerating adoption.
Instrument Development and Validation
A structured interview schedule with 42 items was developed based on the extended TAM framework [4] . Items covered six constructs: perceived usefulness (7 items), ease of use (6 items), cost affordability (6 items), social influence (7 items), technical support availability (8 items), and risk perception (8 items). Each item was scored on a 5-point Likert scale (1 = strongly disagree to 5 = strongly agree). The instrument was validated by a panel of five extension specialists and pilot-tested on 30 non-sample farmers. Cronbach's alpha for the six constructs ranged from 0.78 to 0.91, indicating acceptable internal consistency [6] .
Survey Design and Data Collection
The research was conducted from March to August 2023. Four districts were selected purposively: Imphal East and Thoubal in Manipur, and Karnal and Hisar in Haryana. Sixty farmers per district were chosen by stratified random sampling, stratified by landholding size (marginal: <1 ha; small: 1-2 ha; medium: 2-4 ha; large: >4 ha). Interviews were conducted face-to-face in local languages by trained enumerators. Willingness to adopt was measured as a binary variable (willing / not willing) based on a direct question: "Would you use drone spraying on your rice field if a service provider were available within your block?"
Material and Methods Material
The sample comprised 240 rice-growing households (120 from Manipur; 120 from Haryana). Of these, 156 farmers had seen at least one drone demonstration (either organised by KVK, a private company, or a fellow farmer), while 84 had no prior exposure. Socio-economic profiles were recorded: age, education (years of schooling), landholding, annual farm income, and extension contact frequency. All data were collected using Android tablets loaded with KoboToolbox, ensuring real-time data quality checks.
Methods
Descriptive statistics summarised farmer profiles and Likertscale scores by state and awareness category. Constructlevel mean scores were compared between willing and unwilling groups using independent-sample t-tests. A binary logistic regression model was fitted with willingness as the dependent variable and six construct scores plus four socioeconomic covariates as predictors [7] . Model fit was assessed by the Hosmer-Lemeshow test and Nagelkerke pseudo-R². All analyses used SPSS v26.
Results
Results
Comprehensive Interpretation
Overall, 61.7% of respondents expressed willingness to adopt drone spraying. Willingness was markedly higher in Haryana (72.5%) than Manipur (50.8%), reflecting Haryana's larger average farm size (3.4 ha vs 0.9 ha) and better access to service providers. In the logistic regression, perceived usefulness (OR = 3.26, p < 0.001), farm size (OR = 1.87, p = 0.004), and prior demonstration exposure (OR = 2.41, p = 0.001) were the strongest positive predictors. Cost affordability had a positive but non-significant effect (OR = 1.23, p = 0.14), likely because most farmers envisaged renting rather than owning a drone. The Nagelkerke pseudo-R² was 0.58, indicating a reasonably well-fitting model.
Discussion
The dominance of perceived usefulness as an adoption driver mirrors findings from TAM-based studies of agricultural technologies in developing countries [4] . Farmers who had watched a drone spray an entire paddy in minutes grasped the labour-saving potential instantly; those without that visual benchmark remained doubtful. This aligns with Rogers' diffusion theory, where observability and trialability are among the strongest predictors of early adoption [8] .
Cost didn't emerge as a statistically significant predictor, which may seem counterintuitive. But the rental model reframes the cost question: at ₹400-500 per acre per spray, drone service is competitive with manual labour in regions where agricultural wages have climbed above ₹350 per day [9] . The real bottleneck is access to service providers, which was reflected in the low technical-support score (2.87 out of 5). For extension agencies, the prescription is clear: invest in live demonstrations (the single strongest lever for shifting attitudes) and support the development of village-level drone service centres. Subsidy design should target service providers rather than individual farmers, building a rental ecosystem that lowers the per-spray cost without requiring each smallholder to own a ₹8-10 lakh machine.
Conclusion
Perceived usefulness and prior demonstration exposure were the strongest drivers of farmers' willingness to adopt drone spraying in rice, while cost affordability and technicalsupport access were the main barriers. Haryana farmers showed higher willingness than Manipur farmers, linked to larger farm size and better service infrastructure. Extension programmes that prioritise live demonstrations and support drone-service enterprises are likely to be more effective than hardware subsidies aimed at individual farmers.
Figures and tables from the paper
| Construct | Willing (n=148) | Unwilling (n=92) | t-value (p) |
|---|---|---|---|
| Perceived usefulness | 4.12 | 2.31 | 8.74 (<0.001) |
| Ease of use | 3.24 | 2.08 | 5.63 (<0.001) |
| Cost affordability | 2.41 | 1.83 | 3.17 (0.002) |
| Social influence | 3.82 | 1.97 | 7.92 (<0.001) |
| Technical support | 2.87 | 1.62 | 5.41 (<0.001) |
| Risk perception | 3.48 | 2.71 | 3.86 (<0.001) |
Table text extracted from the original PDF; superscript letters are shown inline. The original table image is below.
View original table image
References
18 in the original paper- Mogili UMR, Deepak BBVL. Review on application of drone systems in precision agriculture. Procedia Comput Sci. 2018;133:502-509.
- Government of India. Sub-Mission on Agricultural Mechanization operational guidelines. New Delhi: Ministry of Agriculture and Farmers Welfare; 2021. p. 1-42.
- Murugan D, Garg A, Singh D. Development of an adaptive approach for precision agriculture monitoring with drone and satellite data. IEEE J Sel Top Appl Earth Obs Remote Sens. 2017;10(12):5322-5328.
- Davis FD. Perceived usefulness, perceived ease of use, and user acceptance of information technology. MIS Q. 1989;13(3):319-340.
- Khanal S, Fulton J, Klopfenstein A, Douridas N, Shearer S. Integration of high-resolution remotely sensed data and machine learning techniques for spatial prediction of soil properties. Comput Electron Agric. 2018;153:213-225.
- Nunnally JC, Bernstein IH. Psychometric theory. 3rd ed. New York: McGraw-Hill; 1994. p. 1-736.
- Hosmer DW, Lemeshow S. Applied logistic regression. 2nd ed. New York: John Wiley & Sons; 2000. p. 1-375.
- Rogers EM. Diffusion of innovations. 5th ed. New York: Free Press; 2003. p. 1-550.
- Meena MS, Singh KM, Meena BS. Economics of drone use for agricultural spraying in India. Indian J Ext Educ. 2022;58(1):35-42.
- Venkatesh V, Morris MG, Davis GB, Davis FD. User acceptance of information technology: toward a unified view. MIS Q. 2003;27(3):425-478.
- Sinha JP. Aerial robot for smart farming and its acceptability in India. Curr Sci. 2020;118(11):17001703.
- Puri V, Nayyar A, Raja L. Agriculture drones: a modern breakthrough in precision agriculture. J Stat Manag Syst. 2017;20(4):507-518.
- Kumar A, Mishra B, Sinha B, Rajput VD, Minkina T, Mandzhieva SS. Precision farming technologies for crop protection. Sustainability. 2022;14(3):1688.
- Raj EFI, Appadurai M, Athiappan K. Precision farming in modern agriculture. Smart Agric Technol. 2022;2:100042.
- Pathak H, Kumar GAK, Mohapatra SD, Rane J, Jee S. Drones in agriculture: applications and policy. Baramati: ICAR-National Institute of Abiotic Stress Management; 2020. p. 1-56.
- Hunt ER, Daughtry CST. What good are unmanned aircraft systems for agricultural remote sensing and precision agriculture? Int J Remote Sens. 2018;39(1516):5345-5376.
- Rejeb A, Abdollahi A, Rejeb K, Treiblmaier H. Drones in agriculture: a review and bibliometric analysis. Comput Electron Agric. 2022;198:107017.
- Zhou Z, Ming D, Lv J, Zhou Y, Wang M. Unmanned aerial vehicle for crop monitoring in precision agriculture. Adv Mech Eng. 2021;13(6):1-10.