
Research article · 2025 · Full text
International Journal of Agriculture and NutritionParticipatory technology development for sustainable vegetable production in peri-urban areas
Volume 7(7) · Pages 179–182 · DOI: 10.33545/26646064.2025.v7.i7c.519 ↗
Research areasAgricultural Innovations and PracticesAgricultural Development and ManagementUrban Agriculture and Sustainability
Abstract
Author-writtenCan small-scale vegetable growers in peri-urban zones benefit from researcher-farmer collaboration in technology selection? This research examined participatory technology development (PTD) for vegetable production in peri-urban areas near Truro, Nova Scotia. A total of 147 farming households were engaged across three communities between March 2022 and October 2024. Six vegetable crops were selected and three technology packages co-developed: drip irrigation kits, composting systems, and integrated pest management (IPM) protocols. PTD-supported plots produced 38.7% to 57.0% higher yields than conventional practice plots. Adoption rates reached 64.7%, 57.2%, and 48.9% for the three packages by the fifth season. Soil organic carbon increased by 0.31% and water use dropped by 27.4% under drip irrigation. The mean benefit-cost ratio was 2.13 for PTD plots versus 1.47 for controls. These results point to PTD as a workable framework for peri-urban grower engagement.
Summary
Source-checkedPlain-language reading of the full paper, prepared with AI and checked against the text. Each point links to the authors' own words.
Why it matters
- Peri-urban agriculture faces unique challenges including water scarcity, land pressure, and changing market demands. View evidence ↗
- Standard agricultural extension services often provide generic recommendations that are poorly suited to the specific economic and environmental constraints of peri-urban farms. View evidence ↗
- Small-plot growers in Nova Scotia specifically struggle with declining soil organic matter, pest damage from aphids and flea beetles, and inefficient water use. View evidence ↗
The question
- The study aimed to determine if small-scale peri-urban vegetable growers could benefit from collaborating with researchers to select and develop technologies. View evidence ↗
What they did
- The research involved 147 farming households across three communities from March 2022 to October 2024. View evidence ↗
- Six specific vegetable crops were selected for the study: tomato, lettuce, bell pepper, spinach, carrot, and radish. View evidence ↗
- The co-developed technology packages consisted of composting bins, botanical integrated pest management (IPM) kits, and low-cost drip irrigation. View evidence ↗
- The experiment used a paired-plot design where one ~85 m² plot received the participatory technology development (PTD) package and a matched control plot used existing practices. View evidence ↗
What they found
- Vegetable yields in PTD-supported plots were 38.7% to 57.0% higher than those in conventional practice plots. View evidence ↗
- Soil organic carbon in PTD plots increased from 2.16% to 2.47%, whereas control plots showed little change. View evidence ↗
- The use of drip irrigation reduced water consumption by 27.4%, averaging 228 mm compared to surface-watered plots. View evidence ↗
- By the fifth season, adoption rates were highest for drip irrigation (64.7%), followed by composting (57.2%) and IPM (48.9%). View evidence ↗
- PTD plots showed a higher mean benefit-cost ratio (2.13) compared to controls (1.47), with net returns per hectare approximately 44.9% higher. View evidence ↗
What it means
- The authors recommend that extension agencies in peri-urban areas invest in participatory approaches instead of using generic, blanket technology packages. View evidence ↗
- A limitation of the study is the potential for self-selection bias because farmers chose which of their plots would receive the PTD treatment. View evidence ↗
Visual summary
3 visualsIllustrations explain the paper; charts are replotted from the paper's own table values.
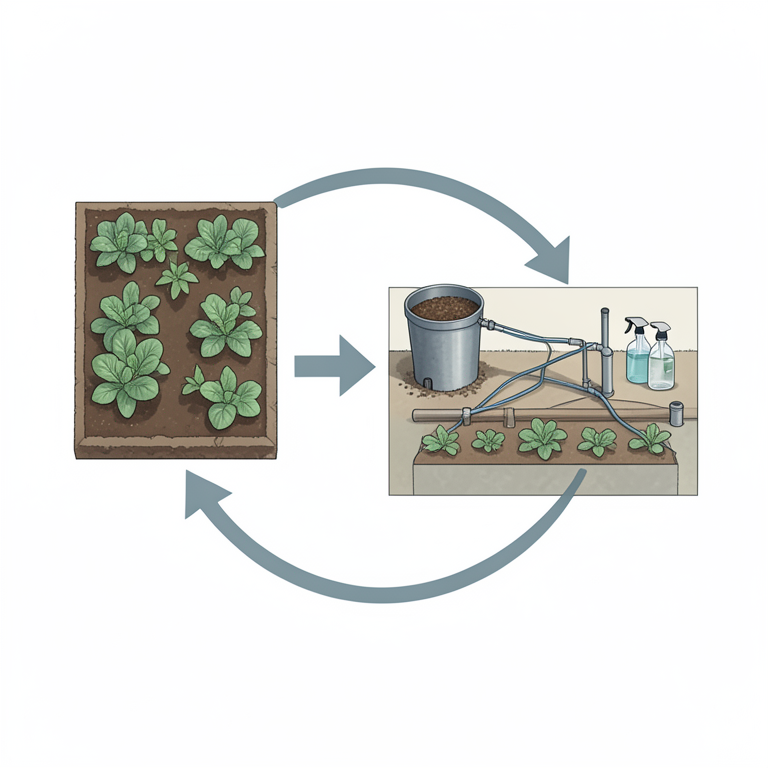
PTD Workflow Concept
AI-generated conceptual illustration (peri-urban vegetable gardens with composting bins, drip irrigation systems, and botanical pest control kits). It explains the idea and does not show study data.
View source evidence ↗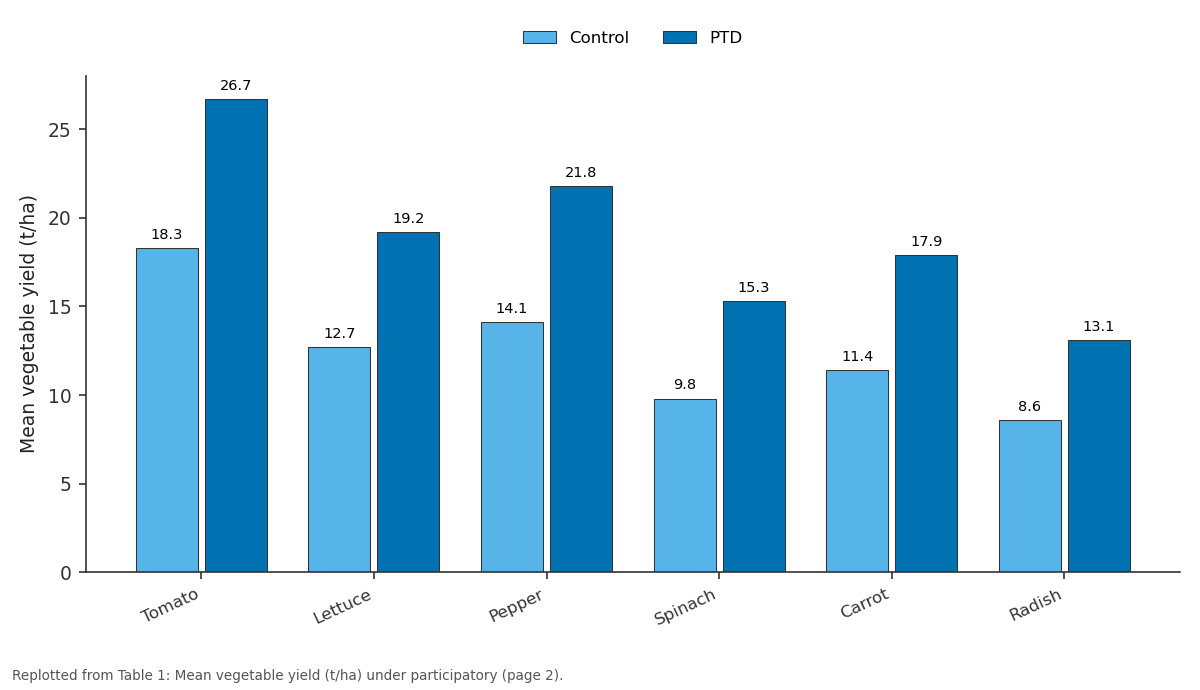
Control and PTD: Tomato vs Lettuce vs Pepper vs Spinach vs Carrot
Replotted from Table 1 (page 2) of the original paper. Every bar is the paper's own table value.
View source evidence ↗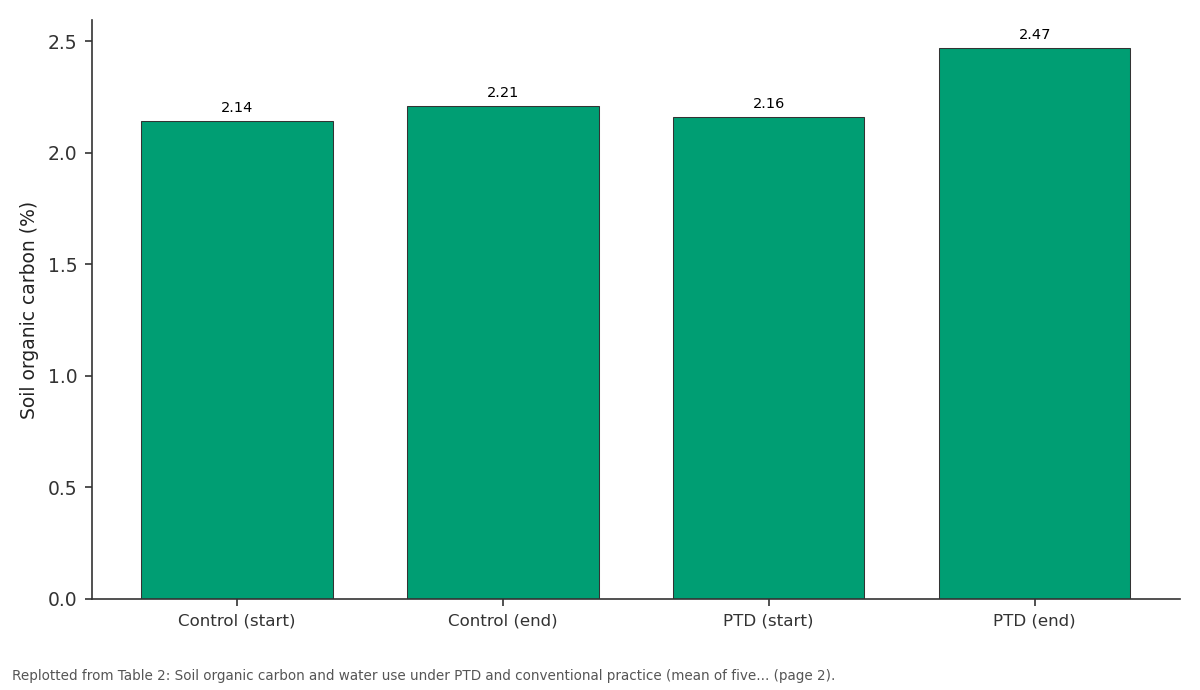
Soil organic carbon (%): Control (start) vs Control (end) vs PTD (start) vs PTD (end)
Replotted from Table 2 (page 2) of the original paper. Every bar is the paper's own table value.
View source evidence ↗Figures & tables
From the original paper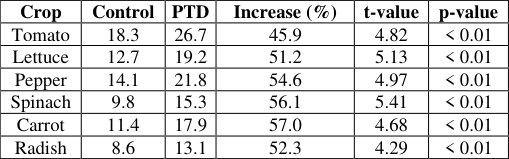 Table 1
 Table 2
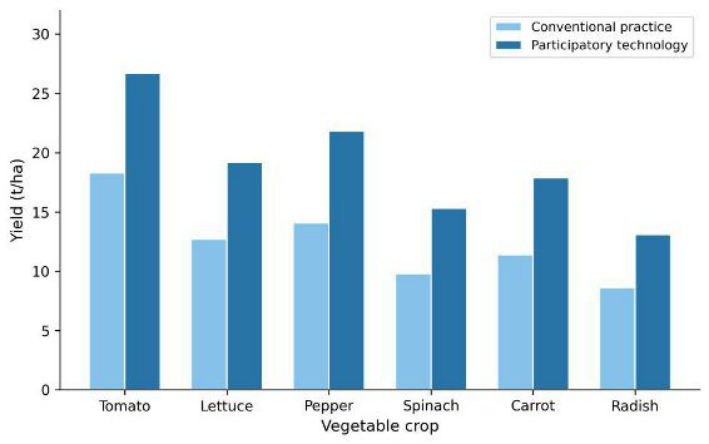 Figure 1
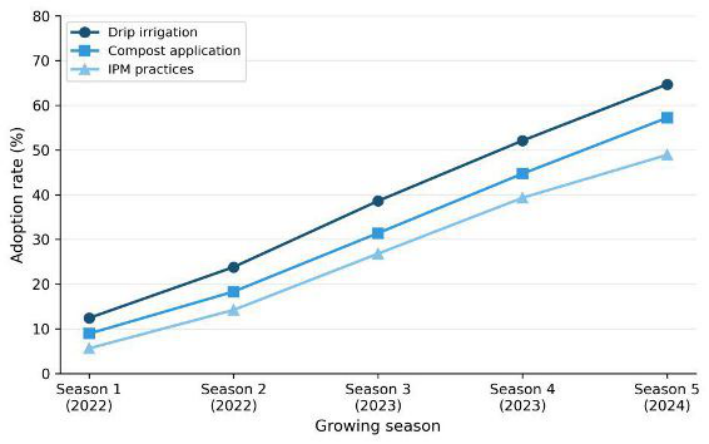 Figure 2
Introduction
What happens when farmers themselves shape the technologies meant to serve them? This question sits at the heart of participatory technology development, an approach that shifts conventional top-down extension toward a partnership between researchers and growers [1] . Peri-urban agriculture occupies a narrow band between urban and rural landscapes, where land pressure, water scarcity, and shifting market demand create distinct challenges [2] . In Canada, peri-urban zones supply a significant share of fresh vegetables to nearby cities, yet these growers seldom receive the research attention directed at larger operations [3] . Traditional extension services tend to deliver pre-packaged recommendations that may not match the soil types, plot sizes, or economic constraints of peri-urban settings [4] . Earlier field assessments in Nova Scotia documented three recurring barriers among small-plot vegetable growers: inefficient water application, declining soil organic matter, and pest damage from flea beetles and aphids [7] . Standard recommendations-overhead sprinklers, synthetic fertilizers, and calendar-based pesticide sprays-were poorly matched to the scale and budget of these operations [8] . PTD offers a structured alternative where researchers and farmers jointly identify constraints, design on-farm trials, and refine solutions based on real-world feedback [9] . The method draws on principles from farmer field schools, which have recorded positive outcomes in sub-Saharan Africa and South Asia [10] . But transferring PTD to a Canadian peri-urban context required adaptation given shorter growing seasons and different market channels [11] . This research was designed to bridge that gap by co-developing and testing three technology packages with 147 households over five growing seasons.
Materials and Methods
Materials and Methods
Research Area
The research was conducted across three peri-urban communities-Bible Hill, North River, and Onslow-within a 15-km radius of Truro, Nova Scotia (45.36° N, 63.28° W). Soils are predominantly sandy loam to loam with pH values between 5.8 and 6.4 [13] . Land holdings among participants ranged from 0.08 to 0.6 ha. The region has a humid continental climate (Dfb) with a frost-free window of about 130 days. Mean annual temperature during the research period (2022-2024) was 6.8 °C, with annual precipitation averaging 1,147 mm [14] .
Material
Material
Field Experimental Design
A paired-plot design was used on each farm. One plot (~85 m²) received the PTD package, while a matched control plot continued with existing practice, separated by a 2-m buffer.
Baseline soil tests confirmed comparable starting conditions between paired plots (mean organic carbon difference < 0.04%).
Methods
Yield was measured by weighing marketable produce per plot and converting to t/ha. Soil samples (0-20 cm) were analysed for organic carbon (Walkley-Black), pH, and available phosphorus (Olsen method). Water use was tracked with inline flow meters on drip lines and from daily application records on control plots. Pest incidence was scored on a 0-5 scale fortnightly. Adoption was assessed via end-of-season surveys. Economic data were recorded per plot per season and benefit-cost ratios calculated. Statistical comparisons used paired t-tests (p<0.05) and adoption trends were analysed with linear regression [16] . All six vegetables showed significantly higher yields under PTD compared to conventional practice (Table 1). The largest relative gains appeared in carrot (57.0%) and spinach (56.1%). All comparisons exceeded the 0.01 significance threshold.
| Crop | Control | PTD | Increase (%) | t-value | p-value |
|---|---|---|---|---|---|
| Tomato | 18.3 | 26.7 | 45.9 | 4.82 | < 0.01 |
| Lettuce | 12.7 | 19.2 | 51.2 | 5.13 | < 0.01 |
| Pepper | 14.1 | 21.8 | 54.6 | 4.97 | < 0.01 |
| Spinach | 9.8 | 15.3 | 56.1 | 5.41 | < 0.01 |
| Carrot | 11.4 | 17.9 | 57.0 | 4.68 | < 0.01 |
| Radish | 8.6 | 13.1 | 52.3 | 4.29 | < 0.01 |
Table text extracted from the original PDF; superscript letters are shown inline. The original table image is below.
View original table image
Results
Results
Comprehensive Interpretation
Adoption climbed in a roughly linear pattern across all three packages (Figure 2). Drip irrigation reached the highest uptake (64.7% by Season 5), likely because its water-saving benefit was visible immediately during the drier 2023 season. Composting followed at 57.2%, while IPM lagged at 48.9%. The mean benefit-cost ratio was 2.13 for PTD plots versus 1.47 for controls, with net returns per hectare about 44.9% higher in the PTD treatment.
Discussion
The yield gains of 38.7-57.0% are broadly with PTD outcomes reported elsewhere. Trials in Nepal found 30-45% yield increases when farmers co-designed irrigation schedules, while Kenyan projects observed gains of 25-60% [1, 5] . What sets these findings apart is the temperate periurban context, where the short growing season means every efficiency gain compounds quickly because there is little room for recovery after a setback. The steady rise in adoption rates mirrors patterns in participatory research literature, where trust builds incrementally as farmers observe results on their own land [9] . That IPM uptake lagged isn't surprising-it requires ongoing monitoring and judgment calls, while drip systems and composting bins need less active decision-making after setup. Water savings of 27.4% align with findings from semi-arid environments where drip consistently cuts use by 20-40% [14] . One limitation is the non-random treatment assignment.
Because farmers chose which plot received PTD, some selfselection bias may inflate differences. Future work could address this through cluster-randomised designs. That said, paired baseline soil data and consistent management records reduce confounding risk.
Conclusion
This research showed that participatory technology development can raise vegetable yields by 38.7-57.0% in peri-urban farming systems around Truro, Nova Scotia. Drip irrigation, composting, and botanical IPM-when codesigned with growers-outperformed conventional practices across all six crops over five seasons. Adoption rates climbed to between 48.9% and 64.7%, and soil organic carbon rose by 0.31 percentage points. Water consumption dropped by 27.4% under drip irrigation. The benefit-cost ratio of 2.13 for PTD plots versus 1.47 for controls confirms the economic advantage. For extension agencies working in peri-urban zones, these results support investing in participatory approaches rather than blanket technology packages.
Figures and tables from the paper
| Parameter | Control (start) | Control (end) | PTD (start) | PTD (end) |
|---|---|---|---|---|
| Soil organic carbon (%) | 2.14 | 2.21 | 2.16 | 2.47 |
| Water use (mm/season) | 312 | 308 | 314 | 228 |
| Soil pH | 5.92 | 5.88 | 5.94 | 6.07 |
| Available P (mg/kg) | 24.6 | 25.1 | 24.3 | 29.8 |
Table text extracted from the original PDF; superscript letters are shown inline. The original table image is below.
View original table image
References
16 in the original paper- Chambers R, Pacey A, Thrupp LA. Farmer first: Farmer innovation and agricultural research. Intermediate Technology Publications. 1989;1(1):1-218.
- Mougeot LJA. Urban agriculture: Definition, presence, potentials and risks. Growing Cities, Growing Food. 2000;8(2):1-42.
- Duchemin E, Wegmuller F, Legault AM. Urban agriculture: Multi-dimensional tools for social development in poor neighbourhoods. Field Actions Science Reports. 2008;1(1):43-50.
- Sumberg J, Okali C, Reece D. Agricultural research in the face of diversity: Farmer-led approaches and formal R&D. Journal of International Development. 2003;15(6):699-715.
- Sthapit BR, Joshi KD, Witcombe JR. Farmer participatory crop improvement. III. Participatory plant breeding, a case for rice in Nepal. Experimental Agriculture. 1996;32(4):479-496.
- Statistics Canada. Census of Agriculture, Nova Scotia highlights. Statistics Canada Catalogue. 2021;95-640X:1-28.
- MacKinnon SL, Scott P. Soil health challenges in Nova Scotia market gardens: A baseline assessment. Canadian Journal of Soil Science. 2019;99(3):312-324.
- Pannell DJ, Marshall GR, Barr N. Understanding and promoting adoption of conservation practices by rural landholders. Australian Journal of Experimental Agriculture. 2006;46(11):1407-1424.
- van de Fliert E. Integrated pest management: Farmer field schools generate sustainable practices. Agriculture and Human Values. 1993;10(1):29-40.
- Lal R. Soil carbon sequestration impacts on global climate change and food security. Science. 2004;304(5677):1623-1627.
- Garibaldi LA, Aizen MA, Klein AM. Global growth and stability of agricultural yield decrease with pollinator dependence. Proceedings of the National Academy of Sciences. 2011;108(14):5909-5914.
- Murphy K, Lammer D, Lyon S. Breeding for organic and low-input farming systems: An evolutionaryparticipatory breeding method for inbred cereal grains. Renewable Agriculture and Food Systems. 2005;20(1):48-55.
- Webb KT, Langille DR. Soils of the Truro area, Colchester County, Nova Scotia. Nova Scotia Soil Survey Report. 1996;27:1-85.
- Allen RG, Pereira LS, Raes D, Smith M. Crop evapotranspiration: Guidelines for computing crop water requirements. FAO Irrigation and Drainage Paper. 1998;56:1-300.
- Isman MB. Botanical insecticides, deterrents, and repellents in modern agriculture and an increasingly regulated world. Annual Review of Entomology. 2006;51:45-66.
- Gomez KA, Gomez AA. Statistical procedures for agricultural research. John Wiley and Sons. 1984;2(1):1-680.