
Research article · 2025 · Full text
International Journal of Agriculture and NutritionClimate resilient agricultural practices for enhancing food security in vulnerable communities
Volume 7(5) · Pages 167–170 · DOI: 10.33545/26646064.2025.v7.i5c.588 ↗
Research areasClimate change impacts on agricultureAgricultural Innovations and PracticesAgricultural Development and Management
Abstract
Author-writtenSmallholder farmers in climate-vulnerable regions cannot afford to wait for policy solutions—they need field-ready practices now. This research assessed the adoption and impact of eight climate-resilient agricultural practices among 240 smallholder households in three districts of Karnataka, India, during 2022–24. A mixed-methods approach combining structured surveys, focus group discussions, and on-farm trials was used. Practices were grouped into soil-based, water-based, and crop-based categories, plus an integrated package combining all three. The integrated package produced the highest food security index score (5.4 on a 7-point scale) compared with the control (3.2). Adoption rates ranged from 21.4% (agroforestry) to 62.4% (mulching). Drought-tolerant varieties and rainwater harvesting yielded the greatest individual improvements in grain output (23.6% and 21.8%, respectively). Stepwise regression showed that the integrated package explained 74.1% of variation in household food security scores. These results confirm that bundled interventions outperform isolated practices for building food system resilience in rain-dependent farming communities.
Summary
Source-checkedPlain-language reading of the full paper, prepared with AI and checked against the text. Each point links to the authors' own words.
Why it matters
- A large majority of Indian farm holdings are smaller than 2 hectares and rely heavily on monsoon rains for their crops. View evidence ↗
- In dryland Karnataka, crop failures have increased by approximately 30% over the last twenty years due to rising temperatures and erratic rainfall. View evidence ↗
- Single agricultural practices are often insufficient because they only address one type of climate risk, such as mulching's inability to prevent heat damage. View evidence ↗
The question
- The study aimed to evaluate the adoption and effectiveness of eight climate-resilient practices and compare the food security impact of individual practices versus an integrated package in Karnataka. View evidence ↗
What they did
- Researchers used a mixed-methods approach that included on-farm trials, focus group discussions, and structured surveys. View evidence ↗
- Comparison plots of 0.1 hectares were established on 30 volunteer farms per district to test a control group, individual interventions, and an integrated package of five practices. View evidence ↗
- Food security was measured using a 7-point Food Security Index (FSI) adapted from the Household Food Insecurity Access Scale. View evidence ↗
What they found
- Mulching was the most widely adopted practice at 62.4%, whereas agroforestry had the lowest adoption rate at 21.4%. View evidence ↗
- Among individual practices, drought-tolerant varieties (23.6%) and rainwater harvesting (21.8%) provided the highest improvements in grain output. View evidence ↗
- The integrated package achieved a food security index score of 5.4, significantly higher than the control group's score of 3.2. View evidence ↗
- The integrated package outperformed all other interventions, increasing grain yields by 34.1% and raising FSI scores by an average of 2.2 points. View evidence ↗
- Regression analysis indicated that the integrated package accounted for 74.1% of the variation in household food security scores. View evidence ↗
- There was a trend where practices offering the highest yield gains were adopted less frequently, likely due to higher initial costs or longer payback times. View evidence ↗
What it means
- The authors recommend that agricultural extension strategies prioritize bundled interventions and provide targeted support to overcome barriers to high-impact practices. View evidence ↗
- A limitation of the study is that the on-farm trials used self-selected volunteers, who might be more progressive than the average farmer. View evidence ↗
- The two-season study period may have been too short to capture the full benefits of practices like agroforestry, which often require 3 to 5 years. View evidence ↗
Visual summary
3 visualsIllustrations explain the paper; charts are replotted from the paper's own table values.
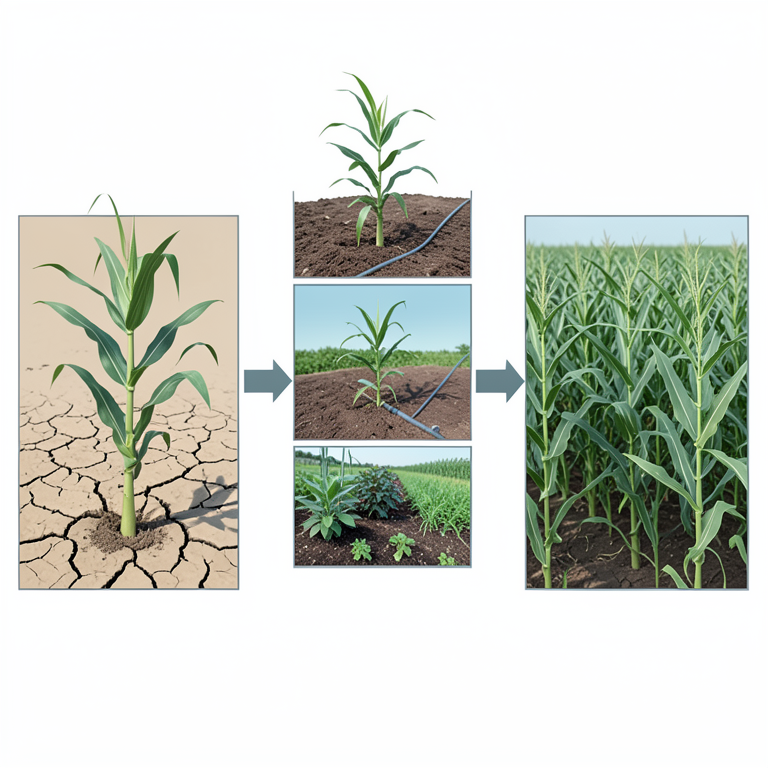
Synergy of Integrated Practices
AI-generated conceptual illustration (Maize plants in a small-scale farm plot). It explains the idea and does not show study data.
View source evidence ↗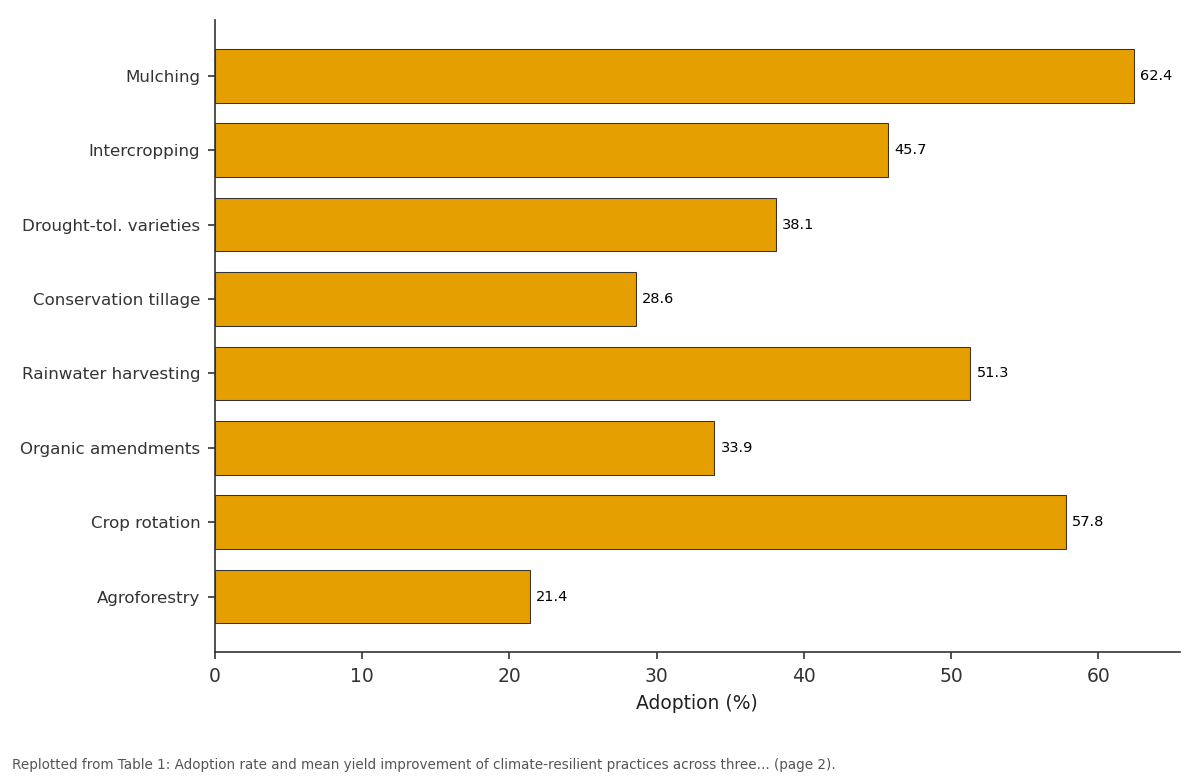
Adoption (%): Mulching vs Intercropping vs Drought-tol. varieties vs Conservation tillage vs Rainwater harvesting
Replotted from Table 1 (page 2) of the original paper. Every bar is the paper's own table value.
View source evidence ↗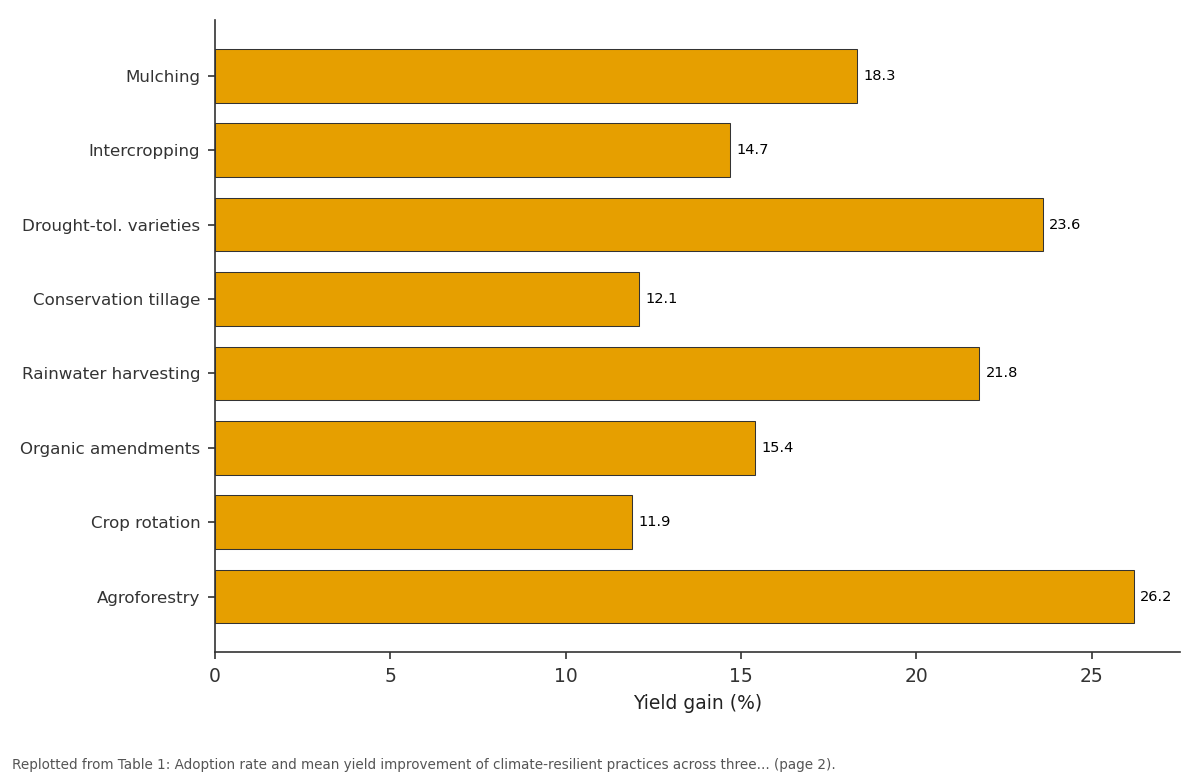
Yield gain (%): Mulching vs Intercropping vs Drought-tol. varieties vs Conservation tillage vs Rainwater harvesting
Replotted from Table 1 (page 2) of the original paper. Every bar is the paper's own table value.
View source evidence ↗Figures & tables
From the original paper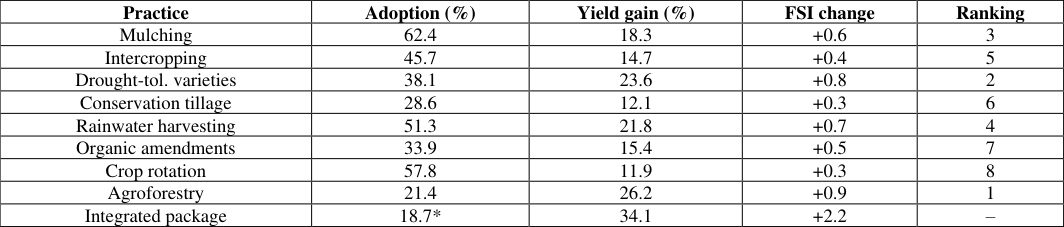 Table 1
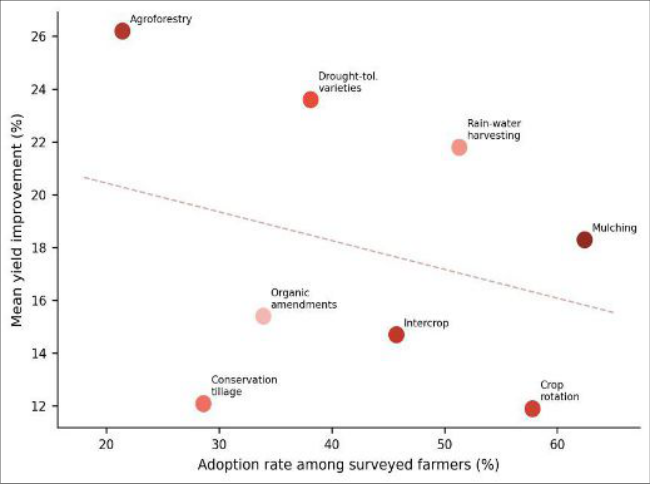 Figure 1
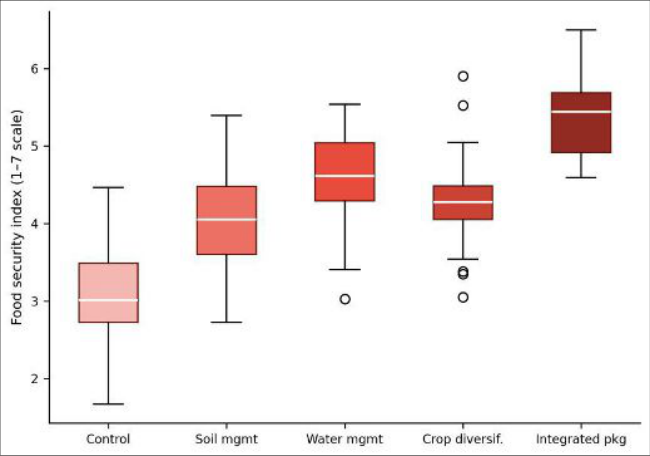 Figure 2
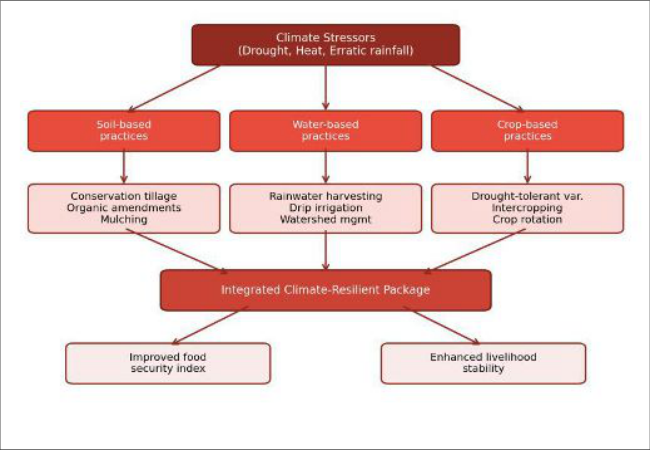 Figure 3
Introduction
Climate change isn't a distant threat for smallholder farmers-it is already reshaping their livelihoods across the semi-arid tropics. In India, roughly 85% of farm holdings are smaller than 2 hectares, and these households depend heavily on monsoon rainfall for crop production [1] . Erratic rainfall patterns, prolonged dry spells, and rising temperatures have increased crop failure frequency in dryland Karnataka by an estimated 30% over the past two decades [2,3] . Several adaptation practices have been promoted by state extension agencies and NGOs, including conservation tillage, mulching, rainwater harvesting, drought-tolerant varieties, and intercropping [4] . But adoption remains patchy and uneven. Individual practices often address only one dimension of climate risk-for instance, mulching conserves soil moisture but doesn't mitigate heat damage to reproductive tissues [5] . There is growing consensus that bundled or integrated packages offer more reliable protection than single-practice approaches [6, 7] . However, field-level evidence quantifying how integrated packages compare with individual practices in terms of food security outcomes is limited for the Karnataka context. Most existing data come from experimental stations, and farmer-managed on-farm comparisons are scarce [8] . This research aimed to (a) assess the adoption rate and perceived effectiveness of eight climate-resilient practices among smallholder farmers in three rain-dependent districts of Karnataka, and (b) compare the food security impact of individual practices against an integrated package combining soil, water, and crop-based interventions.
rainfed finger millet, groundnut, maize, and pigeon pea. Eighty households were randomly selected from each district, totalling 240 respondents.
Materials and Methods
Materials and Methods
Materials
A structured interview schedule covering household demographics, land holding, crop details, practice adoption history, and food security perceptions was developed and pre-tested with 20 non-sample farmers. The Household Food Insecurity Access Scale (HFIAS) was adapted to a 7point food security index (FSI) that combined dietary diversity, food frequency, and perceived sufficiency. Seeds of drought-tolerant varieties (GPU-67 finger millet, GPBD-4 groundnut) were provided to participating farmers for onfarm trials.
Methods
Data collection spanned two kharif seasons (2022 and 2023) through personal interviews, focus group discussions (four per district), and field observations. Adoption was defined as continuous use of a practice for at least two seasons. On-farm comparison plots (0.1 ha each) were laid out on 30 volunteer farms per district to compare control (farmer practice), individual interventions (one practice at a time), and the integrated package (conservation tillage + mulching + rainwater harvesting + drought-tolerant variety + intercropping). Grain yield and biomass were measured at harvest. FSI scores were computed at baseline and after two seasons. Data were analyzed using descriptive statistics, paired t-tests, and stepwise regression in R v.4.3.
Seasonal Variation in Rainfall
Kharif 2022 received 87% of the long-period average rainfall in Shivamogga, 72% in Haveri, and 64% in Chitradurga. A 22-day mid-season dry spell in August 2022 affected Chitradurga and Haveri. Kharif 2023 was comparatively wetter (94%, 81%, and 73% of normal), with a shorter 14-day dry spell in July. These contrasting seasons allowed evaluation of practice performance under moderate and severe moisture stress. 1).
Results
Results
Comprehensive Interpretation
An interesting pattern emerged from the scatter plot (Figure 1): practices with the highest yield gains tended to have lower adoption, likely because they require higher upfront investment or longer payback periods. The box plot (Figure 2) confirms that bundling practices narrows the variability in food security outcomes, making households less vulnerable to seasonal shocks.
Discussion
The strong performance of the integrated package aligns with evidence from sub-Saharan Africa and Southeast Asia where bundled climate-smart interventions outperformed standalone practices [6,7] . The 2.2-point FSI improvement from the integrated approach was nearly triple the best single-practice effect (agroforestry, +0.9), suggesting synergistic interactions among soil, water, and crop components.
The inverse relationship between adoption rate and yield benefit deserves attention from extension planners. Practices like mulching and crop rotation are easy to adopt but offer moderate gains, while agroforestry and drought-tolerant varieties deliver larger benefits but face barriers such as land tenure uncertainty and seed availability [4,5] . Targeted subsidies and seed distribution programs could accelerate of high-impact, low-adoption practices. One limitation is that the on-farm trial component involved self-selected volunteer farmers who may be more progressive than average. And the two-season timeframe may not capture longer-term benefits of practices like agroforestry, which typically need 3-5 years to show full returns [8] . Nonetheless, the results provide a useful baseline for designing district-level adaptation programs in semi-arid Karnataka.
Conclusion
This research confirmed that integrated climate-resilient packages combining soil, water, and crop-based practices produce markedly better food security outcomes than individual interventions in rain-dependent smallholder systems of Karnataka. The integrated approach raised food security index scores by 2.2 points and improved grain yields by 34.1% over farmer practice. Among individual practices, drought-tolerant varieties and rainwater harvesting showed the highest yield benefits, while mulching and crop rotation had the broadest adoption. Extension strategies should prioritize bundled interventions and address the adoption barriers for high-impact practices through targeted support. Longer-term monitoring across additional seasons and districts would strengthen the evidence base for policy recommendations.
Figures and tables from the paper
| Practice | Adoption (%) | Yield gain (%) | FSI change | Ranking |
|---|---|---|---|---|
| Mulching | 62.4 | 18.3 | +0.6 | 3 |
| Intercropping | 45.7 | 14.7 | +0.4 | 5 |
| Drought-tol. varieties | 38.1 | 23.6 | +0.8 | 2 |
| Conservation tillage | 28.6 | 12.1 | +0.3 | 6 |
| Rainwater harvesting | 51.3 | 21.8 | +0.7 | 4 |
| Organic amendments | 33.9 | 15.4 | +0.5 | 7 |
| Crop rotation | 57.8 | 11.9 | +0.3 | 8 |
| Agroforestry | 21.4 | 26.2 | +0.9 | 1 |
| Integrated package | 18.7* | 34.1 | +2.2 | – |
Table text extracted from the original PDF; superscript letters are shown inline. The original table image is below.
View original table image
References
14 in the original paper- Dev SM. Small farmers in India: challenges and opportunities. Indira Gandhi Institute of Development Research Working Paper. 2012;WP-2012-014.
- Rao CAR, Raju BMK, Rao AVMS, Reddy KV, Rao VUM, Ramachandran K. Atlas on vulnerability of Indian agriculture to climate change. Central Research Institute for Dryland Agriculture. 2013;Hyderabad.
- Srivastava AK, Rajeevan M, Kshirsagar SR. Development of a high resolution daily gridded temperature data set for the Indian region. Atmospheric Science Letters. 2009;10(4):249-254.
- Khatri-Chhetri A, Aryal JP, Sapkota TB, Khurana R. Economic benefits of climate-smart agricultural practices to smallholder farmers in the Indo-Gangetic plains. Current Science. 2017;113(7):1357-1364.
- Rao KPC, Ndegwa WG, Kizito K, Oyoo A. Climate variability and change: farmer perceptions and understanding of intra-seasonal variability. Experimental Agriculture. 2011;47(2):267-291.
- Campbell BM, Thornton P, Zougmoré R, van Asten P, Lipper L. Sustainable intensification: what is its role in climate smart agriculture? Current Opinion in Environmental Sustainability. 2014;8:39-43.
- Lipper L, Thornton P, Campbell BM, Baedeker T, Braimoh A. Climate-smart agriculture for food security. Nature Climate Change. 2014;4(12):1068-1072.
- Verchot LV, Van Noordwijk M, Kandji S, Tomich T. Climate change: linking adaptation and mitigation through agroforestry. Mitigation and Adaptation Strategies for Global Change. 2007;12(5):901-918.
- Godfray HCJ, Beddington JR, Crute IR, Haddad L, Lawrence D. Food security: the challenge of feeding 9 billion people. Science. 2010;327(5967):812-818.
- Wheeler T, von Braun J. Climate change impacts on global food security. Science. 2013;341(6145):508-513.
- Aryal JP, Sapkota TB, Khurana R, Khatri-Chhetri A, Jat ML. Climate change and agriculture in South Asia: adaptation options in smallholder production systems. Environment, Development and Sustainability. 2020;22:5045-5075.
- Shiferaw B, Tesfaye K, Kassie M, Abate T, Prasanna BM. Managing vulnerability to drought and enhancing livelihood resilience in sub-Saharan Africa. Weather and Climate Extremes. 2014;3:67-79.
- Vanlauwe B, Coyne D, Gockowski J, Hauser S, Huber J. Sustainable intensification and the African smallholder farmer. Current Opinion in Environmental Sustainability. 2014;8:15-22.
- Altieri MA, Nicholls CI, Henao A, Lana MA. Agroecology and the design of climate change-resilient farming systems. Agronomy for Sustainable Development. 2015;35(3):869-890.