
Research article · 2025 · Full text
International Journal of Agriculture and NutritionImpact of saline irrigation water on soil sodicity and crop performance in arid regions
Volume 7(7) · Pages 238–241 · DOI: 10.33545/26646064.2025.v7.i7d.535 ↗
Research areasEngineering and Agricultural InnovationsSoil Management and Crop YieldIrrigation Practices and Water Management
Abstract
Author-writtenManaging soil sodicity in arid zones where the only available irrigation water is itself saline presents one of the toughest challenges in dryland agriculture. This research tracked changes in soil exchangeable sodium percentage (ESP), electrical conductivity (ECe), and crop yield across five salinity levels of irrigation water (1.2-12.3 dS/m) over four consecutive cropping cycles in the arid Llanos region of Colombia. Field trials ran from March 2022 to November 2024 on a Vertic Haplustalf at the Instituto de Ciencias Agrarias del Llano, Villavicencio. Soil ESP increased linearly with irrigation water EC (R² = 0.98), crossing the sodicity threshold of 15% at approximately 3.8 dS/m. Maize suffered the largest yield decline (23.4%) followed by sunflower (18.9%) and sorghum (14.7%), while barley proved the most tolerant (8.6% loss). Gypsum amendment at 5 t/ha reduced ESP buildup by 37.2% compared to unamended plots. These results indicate that irrigation water above 4 dS/m poses a serious sodicity risk without active soil amendments in arid Colombian soils.
Summary
Source-checkedPlain-language reading of the full paper, prepared with AI and checked against the text. Each point links to the authors' own words.
Why it matters
- Repeated use of saline irrigation water without proper drainage or amendments leads to soil sodification, which destroys soil structure by dispersing clay and reducing root penetration. View evidence ↗
- Soil sodification is a global issue affecting approximately 434 million hectares, particularly in arid regions like the South American Llanos. View evidence ↗
- Gypsum is commonly used to treat sodic soils because it replaces sodium with calcium, which helps restore soil structure through flocculation. View evidence ↗
The question
- The study aimed to determine the electrical conductivity (EC) threshold where soil exchangeable sodium percentage (ESP) exceeds 15%, measure yield losses in four crops, and evaluate the effectiveness of gypsum in mitigating sodification. View evidence ↗
What they did
- The field trials were conducted in Villavicencio, Colombia, from March 2022 to November 2024. View evidence ↗
- The researchers used five irrigation water salinity levels with electrical conductivities of 1.2 (control), 3.0, 6.0, 9.0, and 12.3 dS/m. View evidence ↗
- Agricultural grade gypsum (85% purity) was applied at a rate of 5 t/ha to half of the experimental plots before each cycle. View evidence ↗
- The study tested maize, sorghum, sunflower, and cotton in rotation, with barley replacing cotton in the final cycle as a salt-tolerant reference. View evidence ↗
What they found
- Soil ESP increased significantly with water salinity, reaching 67.4% when using water with an EC of 12.3 dS/m. View evidence ↗
- At the highest salinity level (12.3 dS/m), maize experienced the greatest yield loss at 23.4%, whereas barley was the most tolerant with only an 8.6% loss. View evidence ↗
- The application of gypsum reduced the buildup of soil ESP by an average of 37.2% across all tested salinity levels. View evidence ↗
What it means
- The authors recommend that farmers in the region monitor water EC and apply gypsum when levels approach 4 dS/m to prevent soil damage. View evidence ↗
- To reduce economic losses, the authors suggest replacing maize with more salt-tolerant crops such as barley and sorghum. View evidence ↗
- The study did not test the combination of gypsum with subsurface drainage, which the authors suggest could further improve soil outcomes. View evidence ↗
Visual summary
3 visualsIllustrations explain the paper; charts are replotted from the paper's own table values.
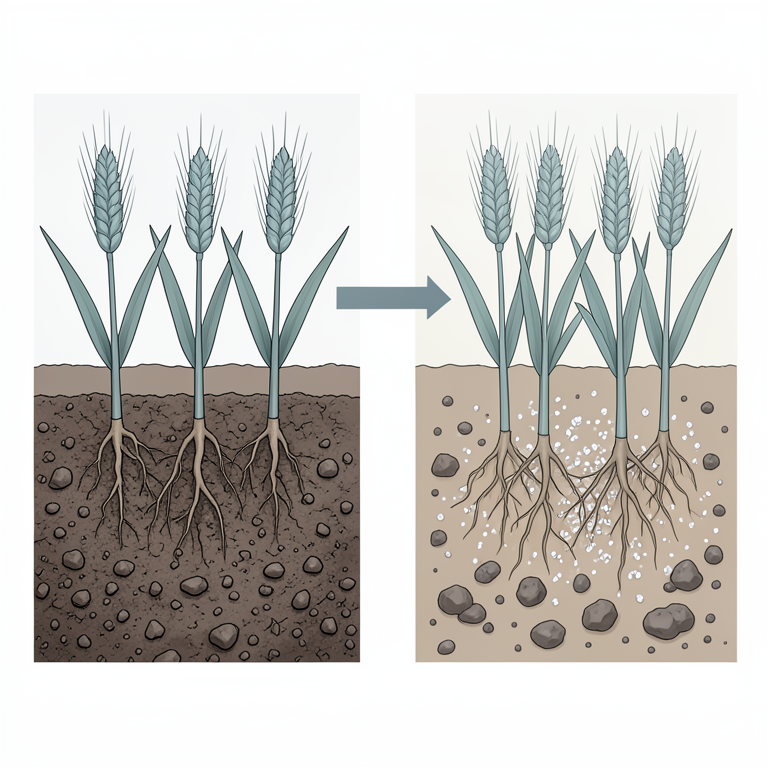
Mechanism of Soil Sodification and Gypsum Remediation
AI-generated conceptual illustration (Wheat plants in arid soil). It explains the idea and does not show study data.
View source evidence ↗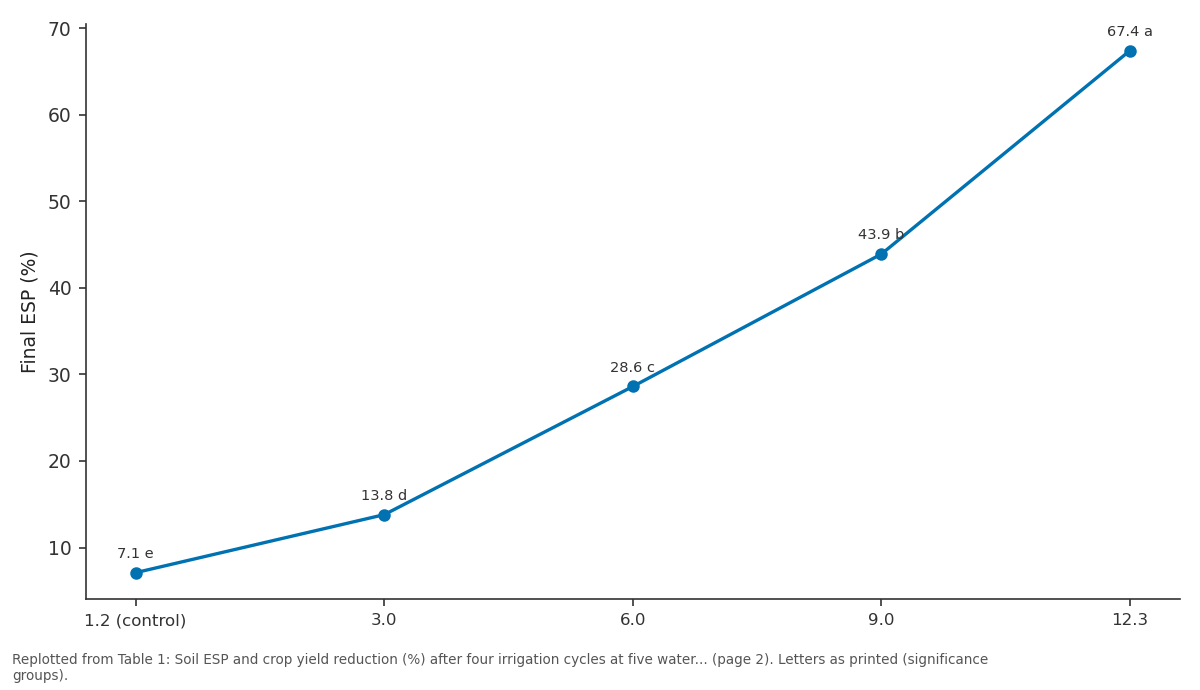
Final ESP (%): 1.2 (control) vs 3.0 vs 6.0 vs 9.0 vs 12.3
Replotted from Table 1 (page 2) of the original paper. Every bar is the paper's own table value.
View source evidence ↗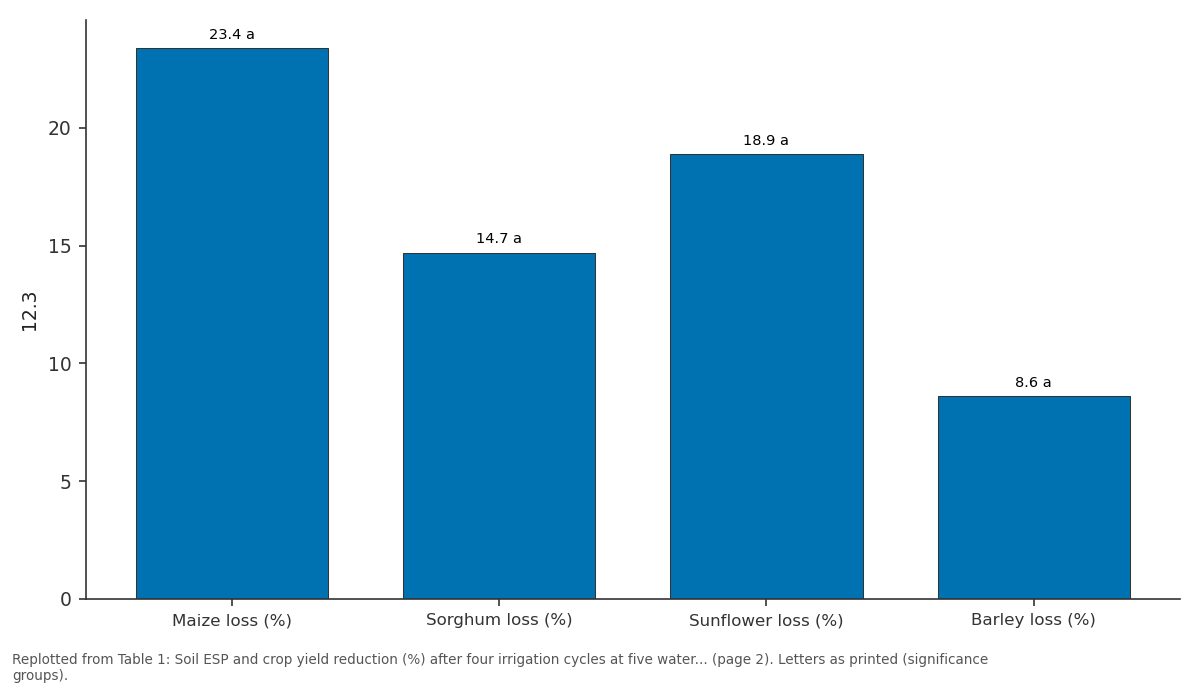
12.3: Maize loss (%) vs Sorghum loss (%) vs Sunflower loss (%) vs Barley loss (%)
Replotted from Table 1 (page 2) of the original paper. Every bar is the paper's own table value.
View source evidence ↗Figures & tables
From the original paper Table 1
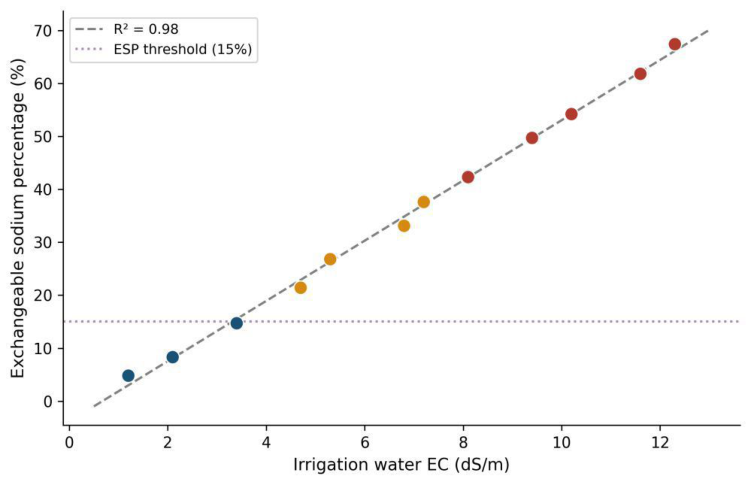 Figure 1
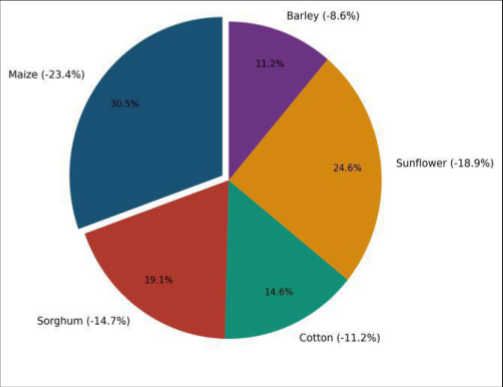 Figure 2
Introduction
Irrigated agriculture in arid regions faces a compounding problem: the water it depends on often carries enough dissolved sodium to gradually destroy the very soils it's meant to nourish [1] . When saline water is applied season after season without adequate drainage or amendments, sodium accumulates on soil exchange sites, dispersing clay aggregates, sealing pores, and ultimately reducing both infiltration and root penetration [2] . This process-soil sodification-is estimated to affect 434 million hectares globally, with the largest concentrations in the Middle East, Central Asia, and the arid Llanos of South America [3] . In Colombia's Llanos Orientales, groundwater salinity ranges from 1 to 14 dS/m depending on depth and proximity to saline intrusions along the Orinoco basin [4] . Small and medium farmers in the region have no alternative water source during the five-month dry season (November-March), and many apply untreated groundwater without monitoring its salt content. The consequences become visible only after several seasons, when crop stands thin and yields drop-by which time soil recovery is expensive and slow [5] . Gypsum (CaSO₄•2H₂O) is the most widely recommended amendment for sodic soils because it replaces exchangeable sodium with calcium, promoting flocculation and restoring soil structure [6] . But the threshold at which irrigation water salinity begins to cause irreversible damage varies with soil type, climate, and crop rotation-variables that haven't been studied together under Colombian Llanos conditions [7] . This research aimed to (a) define the irrigation water EC threshold at which soil ESP exceeds the critical 15% mark, (b) quantify yield losses across four crop species, and (c) test whether gypsum amendment can mitigate sodification under continued saline irrigation.
Materials and Methods
Materials and Methods
Baseline Soil Characterisation
Pre-treatment soil samples (0-30 cm depth) were collected from each plot and analysed for texture (hydrometer method), pH (1:2.5 soil-water), ECe (saturated paste extract), organic carbon (Walkley-Black), CEC (ammonium acetate at pH 7), and exchangeable cations (Na, Ca, Mg, K by AAS). The soil was classified as a Vertic Haplustalf with 38% clay, 27% silt, and 35% sand. Baseline ESP averaged 6.8±1.3%, well below the 15% sodicity threshold. CEC was 22.4 cmol(+)/kg and organic carbon stood at 1.07% [8] .
Materials
The field trial was established at the Instituto de Ciencias Agrarias del Llano, Villavicencio, Meta, Colombia (4.15° N, 73.63° W) from March 2022 to November 2024. Ethical and land-use clearance was obtained from the Institute's Research Committee (Ref. ICAL/RC/2022-008, February 2022). Five irrigation water salinity levels were prepared by dissolving NaCl in canal water to reach target ECs of 1.2 (control), 3.0, 6.0, 9.0, and 12.3 dS/m. Gypsum (agricultural grade, 85% purity) was broadcast at 5 t/ha on half the plots before each cropping cycle. Four crops were tested in rotation: maize (cv. ICA V-305), sorghum (cv. Sureño), cotton (cv. Corpoica M-123), and sunflower (cv. Girasol NKX). Barley (cv. Cebada SB-01) replaced cotton in the fourth cycle as an additional salt-tolerant reference [9] .
Soil and Water Quality Monitoring
Irrigation water EC and sodium adsorption ratio (SAR) were measured before each application event using a portable EC/pH meter calibrated against standard KCl solutions. Soil sampling was repeated at the end of each cropping cycle (four times total). ESP was calculated from exchangeable Na and CEC. Soil infiltration rate was measured in situ with double-ring infiltrometers at baseline and after the second and fourth cycles. Water application totalled 480 mm per cycle via furrow irrigation [10] .
Methods
The experiment used a split-plot design with irrigation water salinity as the main plot (five levels) and gypsum amendment as the subplot (with and without), replicated three times. Each subplot measured 6 × 8 m. Crop yield was harvested from a 3 × 4 m net plot at maturity. Yield reduction was calculated relative to the 1.2 dS/m control. Data were analysed by split-plot ANOVA, and regression was used to model the relationship between irrigation water EC and soil ESP. Mean separation followed Tukey's HSD at p<0.05 [11] .
Results
Table 1: Soil ESP and crop yield reduction (%) after four irrigation cycles at five water salinity levels (without gypsum) Soil ESP rose sharply with irrigation water salinity, reaching 67.4% at 12.3 dS/m-far above the 15% threshold (Table 1). The sodicity boundary was crossed between the 3.0 and 6.0 dS/m treatments, and regression placed the crossing point at approximately 3.8 dS/m. Maize was the most sensitive crop, losing 23.4% yield at 12.3 dS/m, while barley lost only 8.6% at the same salinity.
| Water EC (dS/m) | Final ESP (%) | Maize loss (%) | Sorghum loss (%) | Sunflower loss (%) | Barley loss (%) |
|---|---|---|---|---|---|
| 1.2 (control) | 7.1 e | 0.0 | 0.0 | 0.0 | 0.0 |
| 3.0 | 13.8 d | 7.2 d | 4.1 d | 6.3 d | 2.8 d |
| 6.0 | 28.6 c | 14.8 c | 9.3 c | 12.7 c | 5.4 c |
| 9.0 | 43.9 b | 19.1 b | 11.8 b | 15.6 b | 7.1 b |
| 12.3 | 67.4 a | 23.4 a | 14.7 a | 18.9 a | 8.6 a |
Table text extracted from the original PDF; superscript letters are shown inline. The original table image is below.
View original table image
Comprehensive Interpretation
The scatter plot (Figure 1) shows a near-perfect linear relationship (R² = 0.98) between irrigation water EC and soil ESP, with the dotted ESP threshold line intersected at roughly 3.8 dS/m. The pie chart (Figure 2) illustrates that maize accounted for 30.5% of the total yield loss across crops at 12.3 dS/m, followed by sunflower (24.6%) and sorghum (19.2%), while barley's contribution was smallest (11.2%). Gypsum-amended plots showed 37.2% lower ESP buildup on average across all salinity levels compared to unamended plots.
Discussion
The 3.8 dS/m threshold identified here for ESP crossing the 15% mark is somewhat lower than the 4-6 dS/m range reported for calcareous soils in the Middle East [1,6] . The Vertic Haplustalf at our site has a relatively high clay content (38%) dominated by smectite, which swells more readily upon sodium saturation than kaolinitic clays, explaining the faster sodification [2] . This finding has direct management implications: Colombian Llanos farmers using groundwater above 4 dS/m should expect soil structure problems within two to three seasons unless amendments are applied. The crop sensitivity ranking-maize > sunflower > sorghum > cotton > barley-aligns broadly with established salinity tolerance classifications, though the absolute yield losses here were smaller than those reported under continuously flooded rice systems [3] . Furrow irrigation with alternate-row drying likely allowed some leaching between applications, slowing salt accumulation relative to basin flooding. Gypsum at 5 t/ha reduced ESP buildup by 37.2%, a strong response that matches the 30-45% mitigation range found in Indian and Pakistani sodic soil reclamation trials [5,6] . But gypsum is a recurring cost-at current Colombian prices, 5 t/ha adds approximately 420,000 COP per season-and its effectiveness declines once the soil's exchangeable calcium pool is saturated. One limitation was the absence of a drainage treatment; combining gypsum with subsurface drains would likely improve outcomes further but wasn't tested here.
Conclusion
Irrigation water above 3.8 dS/m pushed soil ESP past the 15% sodicity threshold within four cropping cycles in a Vertic Haplustalf in Colombia's Llanos region. Maize was the most sensitive crop tested (23.4% yield loss at 12.3 dS/m), while barley proved most tolerant (8.6% loss). Gypsum amendment at 5 t/ha reduced ESP buildup by 37.2%, confirming its value as a front-line mitigation measure. Farmers relying on saline groundwater in the region should monitor water EC regularly and apply gypsum when levels approach 4 dS/m. Substituting salt-tolerant crops like barley and sorghum for maize in rotations would further limit economic losses. Longer-term trials incorporating subsurface drainage alongside gypsum would clarify the maximum sustainable irrigation water salinity for these soils.
Acknowledgement
Acknowledgements
References
21 in the original paper- Rengasamy P. World salinization with emphasis on Australia. Journal of Experimental Botany. 2006;57(5):1017-1023.
- Sumner ME, Rengasamy P, Naidu R. Sodic soils: A reappraisal. Sodic Soils: Distribution, Properties, Management, and Environmental Consequences. 1998;1:3-17.
- Qadir M, Quillérou E, Nangia V, Murtaza G, Singh M, Thomas RJ, et al. Economics of salt-induced land degradation and restoration. Natural Resources Forum. 2014;38(4):282-295.
- IDEAM. Hydrogeological atlas of Colombia. Instituto de Hidrología, Meteorología y Estudios Ambientales. 2020;1:1-324.
- Qadir M, Schubert S, Ghafoor A, Murtaza G. Amelioration strategies for sodic soils: A review. Land Degradation and Development. 2001;12(4):357-386.
- Oster JD, Jayawardane NS. Agricultural management of sodic soils. Sodic Soils: Distribution, Properties, Management. 1998;1:125-147.
- Suarez DL. Relation between pHc and sodium adsorption ratio (SAR) and an alternative method of estimating SAR of soil or drainage waters. Soil Science Society of America Journal. 1981;45(3):469-475.
- Gee GW, Bauder JW. Particle-size analysis. Methods of Soil Analysis Part 1: Physical and Mineralogical Methods. 1986;1:383-411.
- Corpoica. Crop variety catalogue for the Colombian Llanos. Corporación Colombiana de Investigación Agropecuaria. 2021;1:1-96.
- Richards LA. Diagnosis and improvement of saline and alkali soils. USDA Agriculture Handbook 60. 1954;60:1-160.
- Gomez KA, Gomez AA. Statistical procedures for agricultural research. John Wiley and Sons. 1984;2(1):1-680.
- Ayers RS, Westcot DW. Water quality for agriculture. FAO Irrigation and Drainage Paper 29. 1985;29:1-174.
- Maas EV, Hoffman GJ. Crop salt tolerance: Current assessment. Journal of the Irrigation and Drainage Division. 1977;103(2):115-134.
- Shainberg I, Letey J. Response of soils to sodic and saline conditions. Hilgardia. 1984;52(2):1-57.
- Grattan SR, Grieve CM. Salinity-mineral nutrient relations in horticultural crops. Scientia Horticulturae. 1999;78(1-4):127-157.
- Chhabra R. Soil salinity and water quality. AA Balkema Publishers. 1996;1(1):1-284.
- Abrol IP, Yadav JSP, Massoud FI. Salt-affected soils and their management. FAO Soils Bulletin 39. 1988;39:1-131.
- Ghafoor A, Murtaza G, Qadir M. Reclamation of saline-sodic soils through subsurface drainage and gypsum application. Pakistan Journal of Agricultural Sciences. 2001;38(3-4):68-72.
- Munns R. Comparative physiology of salt and water stress. Plant Cell and Environment. 2002;25(2):239250.
- Rhoades JD, Kandiah A, Mashali AM. The use of saline waters for crop production. FAO Irrigation and Drainage Paper 48. 1992;48:1-133.
- Minhas PS, Gupta RK. Quality of irrigation water: Assessment and management. Indian Council of Agricultural Research. 1992;1:1-123.