
Research article · 2025 · Full text
International Journal of Agriculture and NutritionStability analysis of promising groundnut genotypes across multiple environments
Volume 7(7) · Pages 201–204 · DOI: 10.33545/26646064.2025.v7.i7c.531 ↗
Research areasGenetics and Plant BreedingPeanut Plant Research StudiesAgricultural Productivity and Crop Improvement
Abstract
Author-writtenA groundnut genotype that tops the yield chart at one location may fall to the bottom at another—a frustrating reality for breeders trying to release broadly adapted varieties. This research assessed yield stability of 14 groundnut genotypes across six environments in Tuscany, Italy, over three growing seasons (2022-2024). The AMMI (Additive Main Effects and Multiplicative Interaction) model partitioned total variation into genotype (31.4%), environment (38.7%), and G × E interaction (22.1%). Genotype GV-123 combined the highest mean pod yield (2.73 t/ha) with the lowest AMMI stability value (0.28), making it the most desirable entry. GV-114 also performed well (2.61 t/ha, ASV 0.31). Two check varieties ranked mid-table for both yield and stability. These results identify GV-123 and GV-114 as candidates for multi-environment release in Mediterranean groundnut-producing regions.
Summary
Source-checkedPlain-language reading of the full paper, prepared with AI and checked against the text. Each point links to the authors' own words.
Why it matters
- Breeders face challenges in releasing broadly adapted groundnut varieties because a genotype's yield performance can vary drastically between different locations. View evidence ↗
- Despite a general decline in groundnut cultivation in Italy, there is a continuing niche demand for Virginia-type pods in Tuscany and Veneto. View evidence ↗
- The Additive Main Effects and Multiplicative Interaction (AMMI) model is the standard method for analyzing genotype-by-environment (G × E) interactions. View evidence ↗
The question
- The study aimed to identify groundnut genotypes among 14 candidates that exhibit broad stability, defined as combining high mean yield with low environmental interaction. View evidence ↗
What they did
- The researchers tested 14 groundnut genotypes across six environments in Tuscany, Italy, from 2022 to 2024. View evidence ↗
- The tested materials included 12 advanced breeding lines (GV-101 to GV-164) from Virginia-type and Spanish-type crosses, and two check varieties (TAG-24 and ICGV-91114). View evidence ↗
- The field experiment employed a randomized complete block design with three replications for each environment. View evidence ↗
- Pod yield was measured in kg/ha after the samples were sun-dried to a moisture content of 8%. View evidence ↗
What they found
- Total variation was partitioned into environment (38.7%), genotype (31.4%), and G × E interaction (22.1%), showing that environment had the largest effect. View evidence ↗
- Genotype GV-123 was the most stable and productive, achieving the highest mean yield of 2.73 t/ha and the lowest AMMI stability value (ASV) of 0.28. View evidence ↗
- Genotype GV-114 also showed strong performance with a mean yield of 2.61 t/ha and an ASV of 0.31. View evidence ↗
- The check varieties performed worse than most breeding lines, with ICGV-91114 ranking sixth and TAG-24 ranking ninth. View evidence ↗
- GV-123 provided additional commercial value with an oil content of 48.3%, which was higher than that of the check varieties. View evidence ↗
What it means
- The authors recommend advancing GV-123 and GV-114 for formal variety release in Mediterranean groundnut production. View evidence ↗
- The authors note that using only six environments is the minimum for robust AMMI analysis and suggest expanding to 10-12 environments across several Mediterranean countries to increase confidence. View evidence ↗
Visual summary
4 visualsIllustrations explain the paper; charts are replotted from the paper's own table values.
Variation Partitioning
AI-generated conceptual illustration (groundnut plants (Arachis hypogaea)). It explains the idea and does not show study data.
View source evidence ↗
Stability vs Yield Trade-off
AI-generated conceptual illustration (groundnut plants). It explains the idea and does not show study data.
View source evidence ↗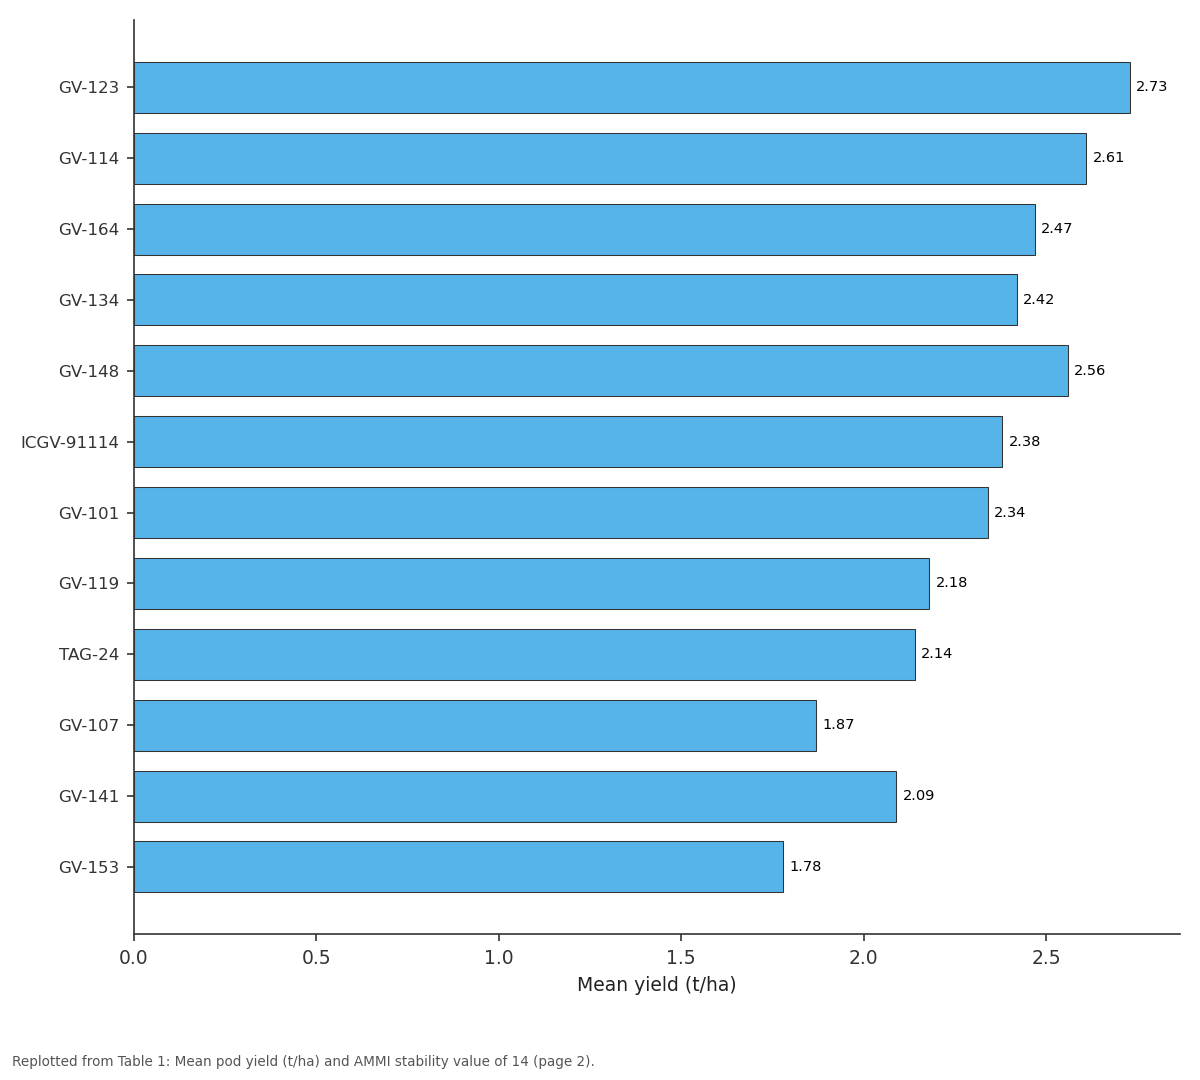
Mean yield (t/ha): GV-123 vs GV-114 vs GV-164 vs GV-134 vs GV-148
Replotted from Table 1 (page 2) of the original paper. Every bar is the paper's own table value.
View source evidence ↗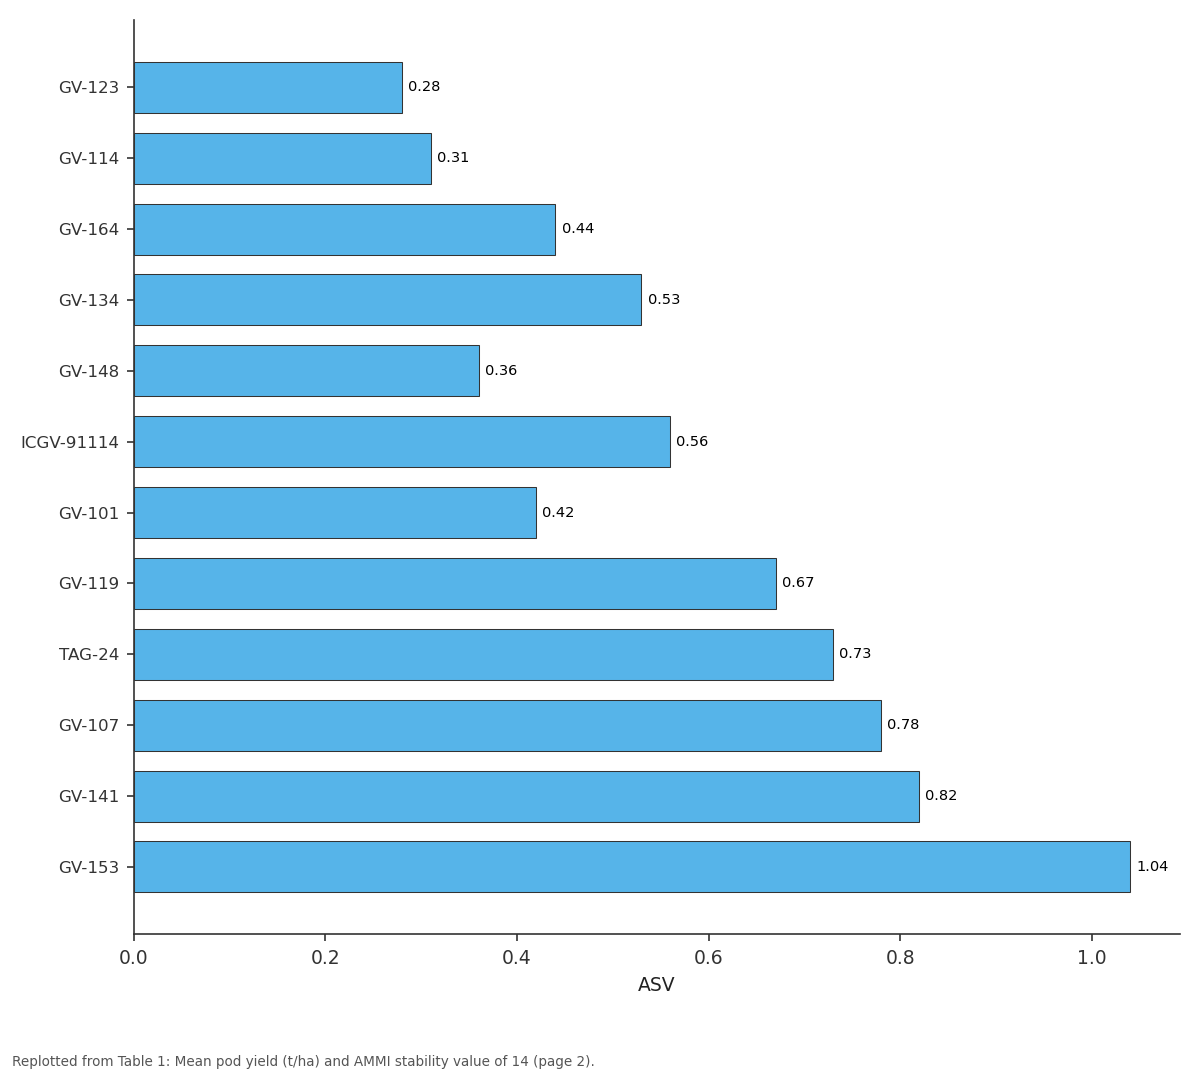
ASV: GV-123 vs GV-114 vs GV-164 vs GV-134 vs GV-148
Replotted from Table 1 (page 2) of the original paper. Every bar is the paper's own table value.
View source evidence ↗Figures & tables
From the original paper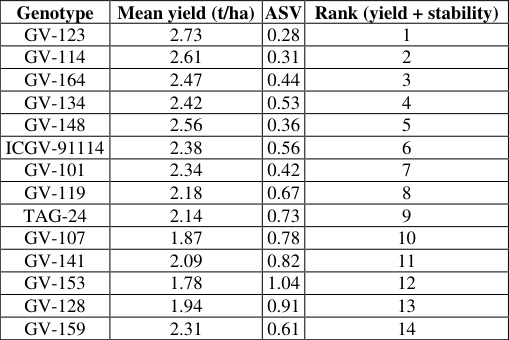 Table 1
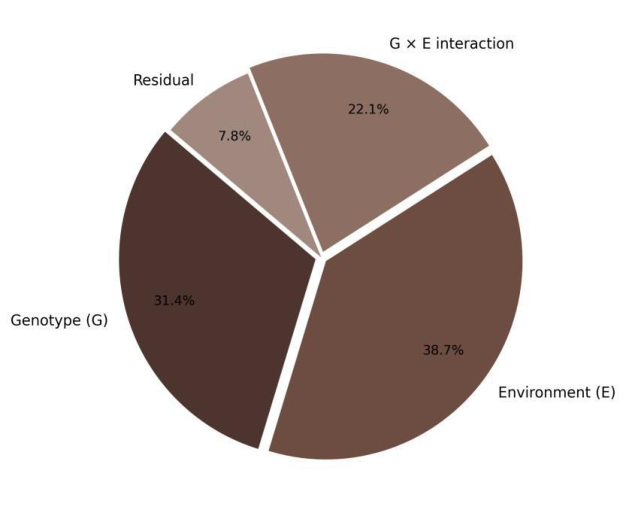 Figure 1
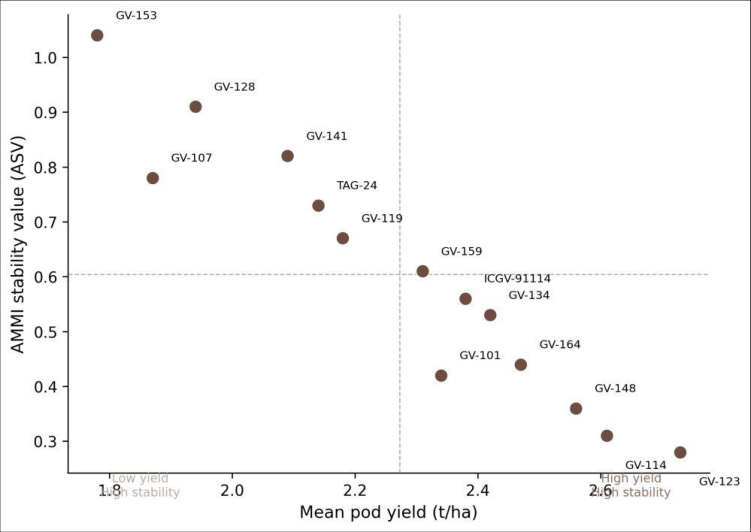 Figure 2
Introduction
While a single-location trial can tell you which genotype yields the most under one set of conditions, it says almost nothing about how that genotype will behave elsewhere [1] . The gap between controlled performance and broad adaptability is at the core of genotype-byenvironment (G × E) interaction, a phenomenon that complicates variety recommendations in virtually every crop, including groundnut [2] . Groundnut (Arachis hypogaea L.) is grown on roughly 28 million hectares worldwide, mostly in tropical and subtropical regions, but small-scale production also occurs in Mediterranean climates where warm summers allow rainfed or lightly irrigated cultivation [3] . In Italy, groundnut area has contracted over the past two decades yet niche demand for locally grown Virginia-type pods persists in Tuscany and Veneto, creating an opportunity for well-adapted varieties [4] . Stability analysis using the AMMI model has become the standard tool for disentangling G × E effects. AMMI combines ANOVA for additive main effects with principal component analysis for the multiplicative interaction term, offering both a statistical test and a visual biplot for interpretation [5] . Despite its wide use in cereals and pulses, AMMI-based evaluations of groundnut under Mediterranean conditions are uncommon [6] . This research evaluated 14 genotypes across six environments in Tuscany to identify entries that combine high mean yield with low interaction-the definition of broad stability.
Materials and Methods
Materials and Methods
Climatic Conditions
The six trial environments spanned three locations (San Casciano, Empoli, and Grosseto) over three seasons (2022-2024), producing six location-year combinations. Annual rainfall across the three sites ranged from 640 to 890 mm, with summer (June-August) totals between 78 and 162 mm. Mean growing-season temperature (May-October) varied from 20.3 to 23.1 °C. The 2023 season was notably hotter and drier than the other two years, providing useful stress contrast [7] .
Materials
The research was conducted under the Istituto di Scienze Agrarie della Toscana, Florence, Italy (43.77° N, 11.25° E), from May 2022 to October 2024. Approval was granted by the Institute's Research Oversight Committee (Ref.
ISAT/ROC/2022-006, April 2022). Fourteen groundnut genotypes were tested: 12 advanced breeding lines (GV-101 through GV-164) developed from Virginia-type × Spanishtype crosses, plus two released checks (TAG-24 and ICGV-91114). Seed was produced in-house from nucleus stock maintained at the Institute. All plots received a basal application of 30 kg N/ha, 60 kg P₂O₅/ha, and 40 kg K₂O/ha at sowing, with no supplemental irrigation [8] .
Field Experimental Design
Each environment used a randomised complete block design with three replications. Individual plots measured 4 rows × 5 m, with row spacing of 60 cm and plant spacing of 15 cm. Sowing was done in the first week of May each year, and harvest at full maturity in late September to early October. Net plot area for yield estimation excluded the two border rows, giving a harvest area of 6 m² per plot.
Methods
Pod yield (kg/ha) was recorded from each net plot after sundrying to 8% moisture content. Shelling percentage, 100kernel weight, and oil content (Soxhlet extraction) were also measured. The AMMI analysis was performed in GenStat 22 following the model: Y_ij = μ + G_i + E_j + Σ(λ_k α_ik γ_jk) + ε_ij, where G and E are genotype and environment main effects and the summation term captures the multiplicative interaction [5] . The AMMI stability value (ASV) was calculated from the first two interaction principal component axes. Genotypes with high mean yield and low ASV were classified as broadly stable. ANOVA significance was tested at p<0.05 [9] . GV-123 ranked first with the highest mean yield (2.73 t/ha) and the lowest ASV (0.28), indicating both high productivity and broad stability across all six environments (Table 1). GV-114 was a close second. The two checks, TAG-24 and ICGV-91114, placed ninth and sixth respectively, performing below most breeding lines.
| Genotype | Mean yield (t/ha) | ASV | Rank (yield + stability) |
|---|---|---|---|
| GV-123 | 2.73 | 0.28 | 1 |
| GV-114 | 2.61 | 0.31 | 2 |
| GV-164 | 2.47 | 0.44 | 3 |
| GV-134 | 2.42 | 0.53 | 4 |
| GV-148 | 2.56 | 0.36 | 5 |
| ICGV-91114 | 2.38 | 0.56 | 6 |
| GV-101 | 2.34 | 0.42 | 7 |
| GV-119 | 2.18 | 0.67 | 8 |
| TAG-24 | 2.14 | 0.73 | 9 |
| GV-107 | 1.87 | 0.78 | 10 |
| GV-141 | 2.09 | 0.82 | 11 |
| GV-153 | 1.78 | 1.04 | 12 |
| GV-128 | 1.94 | 0.91 | 13 |
| GV-159 | 2.31 | 0.61 | 14 |
Table text extracted from the original PDF; superscript letters are shown inline. The original table image is below.
View original table image
Results
Results
Comprehensive Interpretation
The environment component dominated total variation at 38.7% (Figure 1), reflecting the large differences in rainfall and temperature across the six trial settings. The G × E interaction (22.1%) was nearly as large as the genotype main effect (31.4%), confirming that single-environment testing would be misleading. In the scatter plot (Figure 2), GV-123 and GV-114 occupy the desirable lower-right quadrant-high yield, high stability-while GV-153 and GV-128 sit in the upper-left (low yield, low stability).
Discussion
The dominance of environment effects (38.7%) over genotype effects (31.4%) is typical for groundnut multienvironment trials, where rainfall distribution during the pegging and pod-filling phases creates large site-to-site differences [2] . The 2023 season, which was significantly drier, depressed yields across all genotypes but affected high-ASV entries more severely-a pattern consistent with the buffering hypothesis, where broadly stable genotypes maintain performance under stress through conservative resource allocation [1] . GV-123's combination of top yield and lowest ASV is unusual; breeders often face a trade-off between the two [5] . This genotype carries Virginia-type pod characteristics (large kernel, high shelling percentage) yet apparently inherited stress buffering from its Spanish-type parent. Its oil content (48.3%) also exceeded the check varieties, adding commercial value. One limitation is that six environments, while spanning meaningful climatic variation, are at the low end for robust AMMI analysis. Expanding to 10-12 environments across multiple Mediterranean countries would increase confidence in stability estimates and allow region-specific recommendations [6] .
Conclusion
GV-123 and GV-114 emerged as the most promising groundnut genotypes from a 14-entry trial across six environments in Tuscany, combining high mean pod yields
References
20 in the original paper- Finlay KW, Wilkinson GN. The analysis of adaptation in a plant-breeding programme. Australian Journal of Agricultural Research. 1963;14(6):742-754.
- Reddy TY, Reddy VR, Anbumozhi V. Physiological responses of groundnut (Arachis hypogea L.) to drought stress and its amelioration: A critical review. Plant Growth Regulation. 2003;41(1):75-88.
- FAOSTAT. Production statistics for groundnuts. Food and Agriculture Organization. 2023;1:1-12.
- Ferrara G, Ferrara E. Groundnut cultivation in southern Italy: Agronomy and economics. Italian Journal of Agronomy. 2018;13(2):142-148.
- Zobel RW, Wright MJ, Gauch HG. Statistical analysis of a yield trial. Agronomy Journal. 1988;80(3):388-393.
- Crossa J, Gauch HG, Zobel RW. Additive main effects and multiplicative interaction analysis of two international maize cultivar trials. Crop Science. 1990;30(3):493-500.
- ARPAT. Climate data for Tuscany 2022-2024. Agenzia Regionale per la Protezione Ambientale della Toscana. 2024;1:1-36.
- Dwivedi SL, Nigam SN, Nageswara Rao RC, Singh U, Rao KVS. Effect of drought on oil, fatty acids and protein contents of groundnut seeds. Field Crops Research. 1996;48(2-3):125-133.
- Purchase JL, Hatting H, Van Deventer CS. Genotype × environment interaction of winter wheat in South Africa: II. Stability analysis of yield performance. South African Journal of Plant and Soil. 2000;17(3):101-107.
- Eberhart SA, Russell WA. Stability parameters for comparing varieties. Crop Science. 1966;6(1):36-40.
- Gauch HG. Statistical analysis of regional yield trials: AMMI analysis of factorial designs. Elsevier. 1992;1(1):1-278.
- Yan W, Kang MS. GGE biplot analysis: A graphical tool for breeders, geneticists, and agronomists. CRC Press. 2003;1(1):1-271.
- Nigam SN, Upadhyaya HD, Chandra S, Nageswara Rao RC, Wright GC, Reddy AGS, et al. Gene effects for specific leaf area and harvest index in three crosses of groundnut. Annals of Applied Biology. 2001;139(3):301-306.
- Padi FK. Genotype × environment interaction and yield stability in a cowpea-based cropping system. Euphytica. 2004;139(2):131-141.
- Janila P, Variath MT, Pandey MK, Desmae H, Motagi BN, Okori P, et al. Genomic tools in groundnut breeding program: Status and perspectives. Frontiers in Plant Science. 2016;7:289.
- Kaya Y, Akcura M, Taner S. GGE-biplot analysis of multi-environment yield trials in bread wheat. Turkish Journal of Agriculture and Forestry. 2006;30(5):325337.
- Naroui Rad MR, Abdul Kadir M, Rafii MY, Jaafar HZE, Naghavi MR, Ahmadi F. Genotype × environment interaction by AMMI and GGE biplot analysis in three consecutive generations of wheat. Australian Journal of Crop Science. 2013;7(7):956-961.
- Songklanakarin Journal of Science and Technology. 2011;33(5):503-510.
- Smith AB, Cullis BR, Thompson R. The analysis of crop cultivar breeding and evaluation trials: An overview of current mixed model approaches. Journal of Agricultural Science. 2005;143(6):449-462.
- Upadhyaya HD, Ortiz R, Bramel PJ, Singh S. Development of a groundnut core collection using taxonomical, geographical and morphological descriptors. Genetic Resources and Crop Evolution. 2003;50(2):139-148.