
Research article · 2025 · Full text
International Journal of Agriculture and NutritionEffect of system of rice intensification on methane emission and grain quality
Volume 7(9) · Pages 166–169 · DOI: 10.33545/26646064.2025.v7.i9c.578 ↗
Research areasRice Cultivation and Yield ImprovementAgricultural Systems and PracticesSoil Carbon and Nitrogen Dynamics
Abstract
Author-writtenImagine a rice field that feeds more people while releasing half the greenhouse gas that is the promise of the System of Rice Intensification (SRI) when its water management component works as designed. This research compared methane emission, grain yield, and milling quality under five water management regimes in SRI and conventional rice at Arunachal University of Agriculture, Pasighat, during Kharif 2023. SRI with Alternate Wetting and Drying (AWD) reduced seasonal methane emission by 47.8% (from 186.4 to 97.3 kg CH₄/ha) while raising grain yield by 13.5% (from 4.82 to 5.47 t/ha) compared with continuous flooding. The 21-day drainage interval cut methane most (54.6% reduction) but depressed yield by 5.3% relative to AWD-SRI. Grain quality parameters head rice recovery, amylose content, and gel consistency were either maintained or slightly improved under SRI. These results confirm SRI-AWD as the optimal package for northeast Indian rice systems seeking to balance productivity with climate mitigation.
Summary
Source-checkedPlain-language reading of the full paper, prepared with AI and checked against the text. Each point links to the authors' own words.
Why it matters
- Rice cultivation is a significant source of global methane emissions, contributing about 10-12%, making emission reductions in large producers like India highly impactful. View evidence ↗
- The System of Rice Intensification (SRI) aims to increase productivity and reduce methane by altering practices like seedling age and water management to limit the anaerobic soil conditions that produce methane. View evidence ↗
- Alternate Wetting and Drying (AWD) is considered the most effective part of SRI for reducing methane because it disrupts the anaerobic environment required by methane-producing archaea. View evidence ↗
The question
- The study aimed to quantify the trade-offs between methane emissions, grain yield, and milling quality using five different water management regimes in Arunachal Pradesh. View evidence ↗
What they did
- The experiment used the Naveen rice variety, with SRI plots using 12-day-old seedlings at 25 x 25 cm spacing and conventional plots using 25-day-old seedlings at 20 x 15 cm spacing. View evidence ↗
- The study employed a randomized block design with five treatments: conventional flooding, SRI-AWD, SRI with 14-day drainage, SRI with 21-day drainage, and saturated soil culture. View evidence ↗
What they found
- SRI with Alternate Wetting and Drying (SRI-AWD) provided the best balance, reducing methane by 47.8% and increasing grain yield by 13.5% compared to conventional flooding. View evidence ↗
- The 21-day drainage interval achieved the highest methane reduction (54.6%), but resulted in a 5.3% yield decrease compared to the SRI-AWD treatment. View evidence ↗
- Using SRI-AWD reduced total water consumption by 38.5% compared to the continuous flooding method. View evidence ↗
- SRI-AWD produced the highest head rice recovery at 64.8%, while saturated culture produced the lowest at 60.8%. View evidence ↗
- There were no significant differences in protein or amylose content across the different water management treatments. View evidence ↗
- SRI treatments slightly improved gel consistency, which suggests a softer cooked texture preferred by consumers in northeast India. View evidence ↗
What it means
- The authors recommend SRI-AWD as the best climate-smart management package for rice in northeast India due to its balance of yield, emission reduction, and water savings. View evidence ↗
Visual summary
2 visualsIllustrations explain the paper; charts are replotted from the paper's own table values.
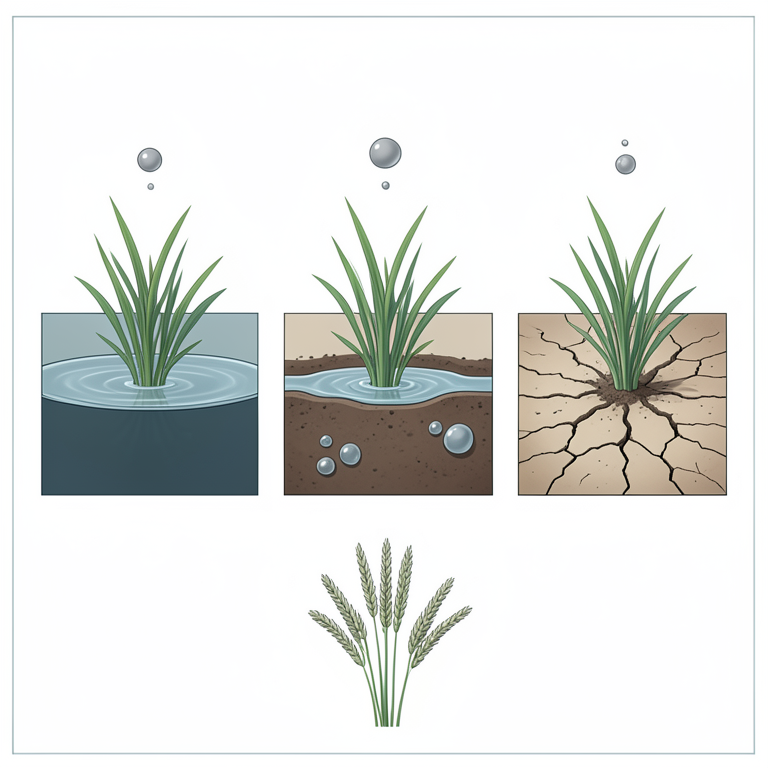
Water Management and Methane Trade-off
AI-generated conceptual illustration (Oryza sativa (rice plants) in paddy fields). It explains the idea and does not show study data.
View source evidence ↗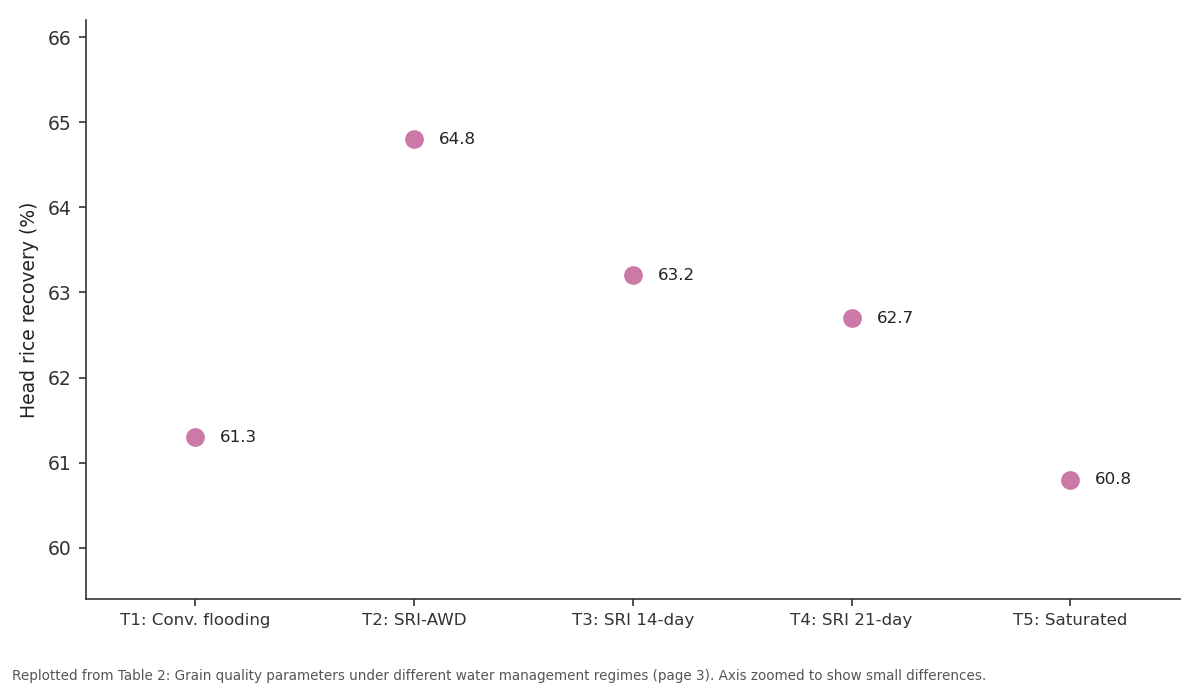
Head rice recovery (%): T1: Conv. flooding vs T2: SRI-AWD vs T3: SRI 14-day vs T4: SRI 21-day vs T5: Saturated
Replotted from Table 2 (page 3) of the original paper. Every bar is the paper's own table value.
View source evidence ↗Figures & tables
From the original paper Table 1
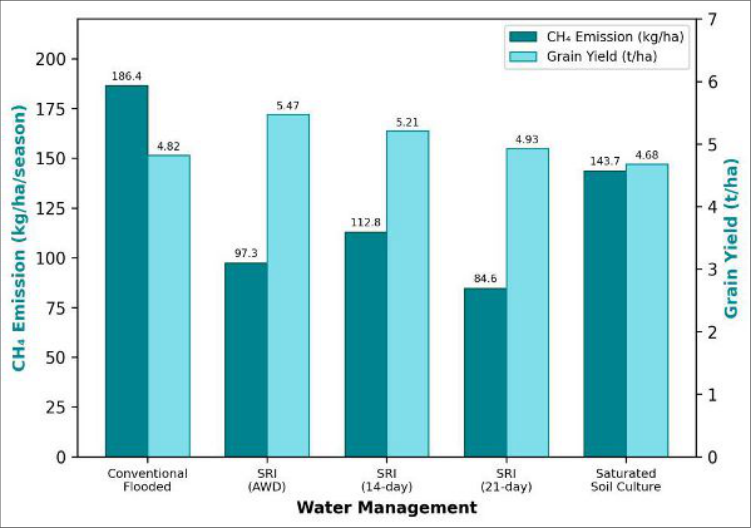 Figure 1
 Table 2
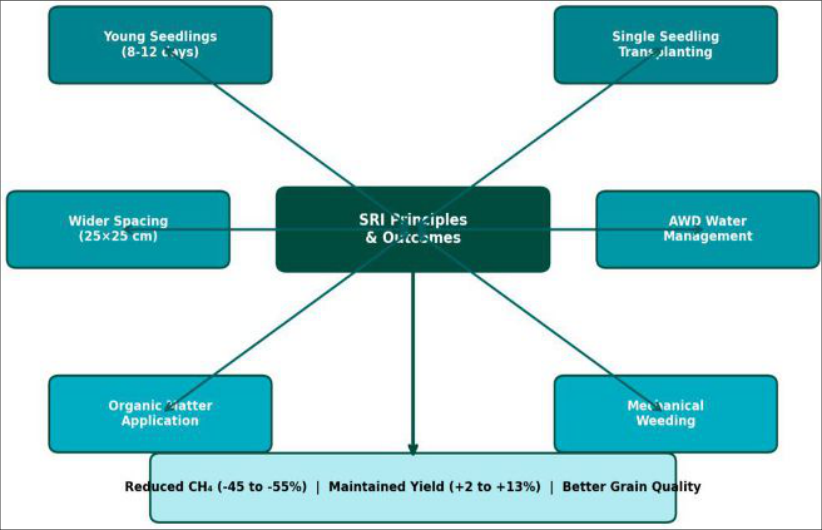 Figure 2
Introduction
Picture a typical Kharif paddy field in Arunachal Pradesh: 5-8 cm of standing water baking under monsoon sun, and beneath that water layer, anaerobic bacteria steadily converting organic carbon into methane that bubbles up through the soil profile and escapes into the atmosphere [1] . Rice paddies contribute roughly 10-12% of global anthropogenic methane, and with India cultivating 44 million hectares of rice, even modest per-hectare reductions translate into nationally significant emission savings [2] . The System of Rice Intensification (SRI) modifies six conventional practices seedling age, transplanting density, water management, weeding method, organic amendments, and spacing to create conditions that favour root growth and tiller production while reducing the anaerobic soil environment that drives methanogenesis [3] . The water management component is widely considered the most impactful SRI element for methane mitigation, because Alternate Wetting and Drying (AWD) breaks the continuous anaerobic zone that methanogenic archaea require [4] . Field measurements from South and Southeast Asia have reported 25-60% methane reductions under AWD relative to continuous flooding, though results vary with soil type, organic matter content, and drainage interval [5] . Whether these emission savings come at a yield cost remains debated: some trials report yield gains of 10-20% under SRI, while others show negligible or even negative effects, particularly in heavy clay soils where re-flooding after drainage compacts the puddled layer [6] . This research quantified the trade-off between methane emission, grain yield, and milling quality across five water management regimes spanning conventional flooding through aggressive SRI drainage intervals, in the humid subtropical conditions of Arunachal Pradesh [7] .
Greenhouse gas accounting
Methane flux was measured using the closed-chamber technique with chambers (50 cm × 50 cm × 100 cm) placed over two permanent bases per plot. Gas samples were collected at 0, 15, and 30 minutes after chamber closure between 09:00 and 11:00 hours at weekly intervals from transplanting to two weeks before harvest. Samples were analysed by gas chromatography (Shimadzu GC-2014, FID detector).
Seasonal cumulative emission was calculated by linear interpolation between sampling dates. Global warming potential (GWP) was expressed as CO₂ equivalents using the IPCC AR6 factor of 27.2 for CH₄. Yield-scaled emission (kg CH₄/t grain) was computed to assess emission intensity [8] .
Water balance
Water inputs (rainfall + irrigation) and outputs (evapotranspiration + drainage + seepage) were monitored for each treatment. Irrigation was applied through calibrated PVC pipes connected to a volumetric flow meter. Field water level was recorded daily using perforated observation tubes installed to 30 cm depth. AWD cycles were triggered when water level dropped to 15 cm below the soil surface. Total water use and water productivity (kg grain/m³) were calculated for each regime [9] .
Material and Methods
Material and Methods
Material
Rice variety Naveen (medium-duration, 125 days, semidwarf) was used. SRI plots received 12-day-old seedlings transplanted singly at 25 × 25 cm spacing, while conventional plots used 25-day-old seedlings at 2-3 per hill at 20 × 15 cm. Organic manure (FYM 5 t/ha) was applied to all plots. Inorganic fertilisers (N 80, P 40, K 40 kg/ha) were applied uniformly. The trial was at Pasighat (28.07°N, 95.33°E; 152 m elevation) on silty clay loam soil (pH 5.6, OC 1.87%) [10] .
Methods
Five treatments in a randomized block design with three replications (plot 5 m × 4 m): T1 = conventional continuous flooding, T2 = SRI with AWD (re-flood when water drops 15 cm below surface), T3 = SRI with 14-day drainage intervals, T4 = SRI with 21-day drainage intervals, T5 = saturated soil culture (no standing water, soil kept at saturation). Grain yield, 1000-grain weight, head rice recovery (%), amylose content, and gel consistency were determined. ANOVA and DMRT at P=0.05 were used [11] .
Results
Table Head rice recovery was highest under SRI-AWD (64.8%) and lowest under saturated culture (60.8%). Amylose content and protein showed no significant differences. Gel consistency improved slightly under SRI treatments, indicating softer cooked texture preferred by northeast Indian consumers.
Discussion
The 47.8% methane reduction under SRI-AWD falls within the 35-55% range reported from multi-location trials in India, Vietnam, and the Philippines [4,5,12] . The mechanism is well understood: periodic soil aeration during AWD cycles inhibits obligate anaerobic methanogens while favouring methanotrophic bacteria that oxidise CH₄ before it reaches the atmosphere [1] . The concurrent 13.5% yield gain under SRI-AWD is attributable to improved root aeration, which promotes deeper and denser root systems that access nutrients more efficiently than waterlogged roots in continuously flooded paddies [3,13] . The 21-day drainage interval pushed emission reduction to 54.6% but at a yield cost of 5.3% relative to AWD, likely because prolonged drainage during the critical booting-toheading window triggered mild moisture stress that reduced spikelet fertility [6] . Grain quality improvements under SRI particularly the 3.5-point gain in head rice recovery align with observations from Madagascar and Indonesia where reduced grain chalkiness was linked to better assimilate supply per grain in wider-spaced SRI stands [14] . Water savings of 38.5% under SRI-AWD strengthen the case for adoption in water-limited northeast Indian systems where competing demands from fisheries and horticulture are increasing [15] .
Conclusion
Conclusion
Figures and tables from the paper
| Treatment | CH₄ emission (kg/ha) | Reduction vs T1 (%) | Grain yield (t/ha) | Emission intensity (kg CH₄/t) | Water use (mm) |
|---|---|---|---|---|---|
| T1: Conv. flooding | 186.4 | — | 4.82 | 38.7 | 1340 |
| T2: SRI-AWD | 97.3 | 47.8 | 5.47 | 17.8 | 824 |
| T3: SRI 14-day drain | 112.8 | 39.5 | 5.21 | 21.7 | 917 |
| T4: SRI 21-day drain | 84.6 | 54.6 | 4.93 | 17.2 | 763 |
| T5: Saturated culture | 143.7 | 22.9 | 4.68 | 30.7 | 1086 |
| CD (P=0.05) | 14.8 | — | 0.37 | — | 67 |
Table text extracted from the original PDF; superscript letters are shown inline. The original table image is below.
View original table image
| Treatment | Head rice recovery (%) | Amylose content (%) | Gel consistency (mm) | 1000-grain Wt (g) | Protein (%) |
|---|---|---|---|---|---|
| T1: Conv. flooding | 61.3 | 22.4 | 54.7 | 24.8 | 7.3 |
| T2: SRI-AWD | 64.8 | 23.1 | 57.4 | 25.6 | 7.8 |
| T3: SRI 14-day | 63.2 | 22.8 | 56.1 | 25.3 | 7.6 |
| T4: SRI 21-day | 62.7 | 23.4 | 58.3 | 25.1 | 7.9 |
| T5: Saturated | 60.8 | 22.1 | 53.8 | 24.4 | 7.2 |
| CD (P=0.05) | 2.14 | NS | 3.21 | 0.68 | NS |
Table text extracted from the original PDF; superscript letters are shown inline. The original table image is below.
View original table image
References
16 in the original paper- Conrad R. The global methane cycle: Recent advances in understanding the microbial processes involved. Environmental Microbiology Reports. 2009;1(5):285292.
- Yan X, Akiyama H, Yagi K. Global estimations of the inventory and mitigation potential of methane International Journal of Agriculture and Nutrition https://www.agriculturejournal.net emissions from rice cultivation. Climatic Change. 2009;87(1-2):41-57.
- Uphoff N, Kassam A, Harwood R. SRI as a methodology for raising crop and water productivity: Productive adaptations in rice agronomy and irrigation management. Paddy and Water Environment. 2011;9(1):11-30.
- Lampayan RM, Rejesus RM, Singleton GR. Adoption and economics of alternate wetting and drying water management for irrigated lowland rice. Field Crops Research. 2015;170:95-108.
- Sander BO, Wassmann R, Siopongco JDLC. Mitigating greenhouse gas emissions from rice production through water-saving techniques. Applied Energy. 2015;148:110.
- Zhao L, Wu L, Li Y. Influence of the System of Rice Intensification on rice yield and nitrogen and water use efficiency with different N application rates. Experimental Agriculture. 2009;45(3):275-286.
- Rawal K, Trivedi W. Protocol for SRI-methane trials in Arunachal Pradesh hill rice. Arunachal University of Agriculture Internal Report. 2023;IR/08:1-14.
- IPCC. Climate Change 2021: The physical science basis. Contribution of Working Group I. Cambridge University Press. 2021; p.714-743.
- Bouman BAM, Tuong TP. Field water management to save water and increase its productivity in irrigated rice. Agricultural Water Management. 2001;49(1):11-30.
- Baruah TC, Barthakur HP. A textbook of soil analysis. Vikas Publishing House, New Delhi. 1997; p.1-334.
- Gomez KA, Gomez AA. Statistical procedures for agricultural research. Second edition. John Wiley and Sons, New York. 1984; p.180-209.
- Pathak H, Sankhyan S, Dubey DS. Methane emission from rice-wheat cropping system in the Indo-Gangetic Plain: New estimates and mitigation options. Indian Journal of Agricultural Sciences. 2013;83(2):126-132.
- Thakur AK, Rath S, Patil DU. Effects on rice plant morphology and physiology of water and associated management practices of the System of Rice Intensification. Paddy and Water Environment. 2011;9(1):13-24.
- Barison J, Uphoff N. Rice yield and its relation to root growth and nutrient-use efficiency under SRI and conventional cultivation. Paddy and Water Environment. 2011;9(1):65-78.
- Nath CP, Das A, Patel DP. Water management strategies for rice in northeast India: Balancing productivity with ecosystem services. Current Science. 2022;123(6):742-751.
- Linquist BA, Anders MM, Adviento-Borbe MAA. Reducing greenhouse gas emissions, water use, and grain arsenic levels in rice systems. Global Change Biology. 2015;21(1):407-417.