
Research article · 2025 · Full text
International Journal of Agriculture and NutritionGenetic mapping of salinity tolerance QTLs in a bi-parental rice population
Volume 7(7) · Pages 193–196 · DOI: 10.33545/26646064.2025.v7.i7c.529 ↗
Research areasGenetic Mapping and Diversity in Plants and AnimalsPlant Stress Responses and ToleranceRice Cultivation and Yield Improvement
Abstract
Author-writtenSoil salinity threatens rice production across 45 million hectares of irrigated land in South and Southeast Asia, yet the genetic basis of tolerance remains only partially mapped. This research identified quantitative trait loci (QTLs) controlling salinity tolerance in a bi-parental population of 186 recombinant inbred lines (RILs) derived from a cross between the tolerant landrace Pokkali and the sensitive variety IR29. Plants were phenotyped under 8 dS/m NaCl stress at seedling and reproductive stages at Kuantan, Pahang, Malaysia, between June 2022 and August 2024. Seven QTLs were detected on chromosomes 1, 2, 3, 4, 5, 6, and 8, collectively explaining 82.1% of phenotypic variance. The largest-effect QTL (qST1.1 on chromosome 1) accounted for 18.7% of variance and co-localised with the Saltol region. Three novel QTLs on chromosomes 4, 5, and 8 hadn’t been reported previously. These markers can support marker-assisted selection for salt tolerance in Malaysian rice breeding programmes.
Summary
Source-checkedPlain-language reading of the full paper, prepared with AI and checked against the text. Each point links to the authors' own words.
Why it matters
- Soil salinity is a major threat to rice production, affecting approximately 45 million hectares of irrigated land in South and Southeast Asia. View evidence ↗
- Tolerance to salinity in rice is a complex quantitative trait controlled by many genes, each typically having a small to moderate effect. View evidence ↗
- The Saltol locus on chromosome 1 is the most well-known genetic region for salinity tolerance, often explaining 25-40% of tolerance during the seedling stage. View evidence ↗
The question
- The study aimed to identify quantitative trait loci (QTLs) for salinity tolerance using a population of 186 recombinant inbred lines (RILs) from a cross between the tolerant Pokkali and sensitive IR29 rice varieties. View evidence ↗
What they did
- The experiments took place at the Pahang College of Agriculture in Malaysia between June 2022 and August 2024. View evidence ↗
- Plants were grown in Yoshida nutrient solution and subjected to 8 dS/m NaCl stress at both the seedling stage (14 days after germination) and the reproductive stage (booting stage). View evidence ↗
- Genotyping was performed using 142 polymorphic simple sequence repeat (SSR) markers spread across all 12 rice chromosomes. View evidence ↗
- The researchers measured five seedling traits (shoot Na+ concentration, K+/Na+ ratio, chlorophyll, root length, and shoot dry weight) and two reproductive traits (spikelet fertility and grain yield). View evidence ↗
What they found
- Seven distinct QTLs for salinity tolerance were identified, all exceeding a LOD threshold of 3.0. View evidence ↗
- The seven identified QTLs collectively explained 82.1% of the total phenotypic variance for the composite salinity tolerance index. View evidence ↗
- The most significant QTL, qST1.1 on chromosome 1, explained 18.7% of the variance and co-localized with the known Saltol region. View evidence ↗
- While six of the QTLs inherited their positive effects from the tolerant Pokkali parent, the qST8.1 locus inherited its positive allele from the sensitive IR29 parent. View evidence ↗
- The broad-sense heritability for the composite salinity tolerance index was 0.71, suggesting that marker-assisted selection is a viable approach for improvement. View evidence ↗
What it means
- The authors recommend pyramiding the qST1.1 locus with the newly discovered QTLs to expand the genetic basis of salt tolerance in Malaysian rice breeding. View evidence ↗
- A limitation of the study is the use of SSR markers, which provide lower mapping resolution compared to SNP arrays. View evidence ↗
- The use of a constant salinity level (8 dS/m) in a controlled environment may not fully represent the fluctuating salinity conditions found in coastal fields. View evidence ↗
Visual summary
2 visualsIllustrations explain the paper; charts are replotted from the paper's own table values.
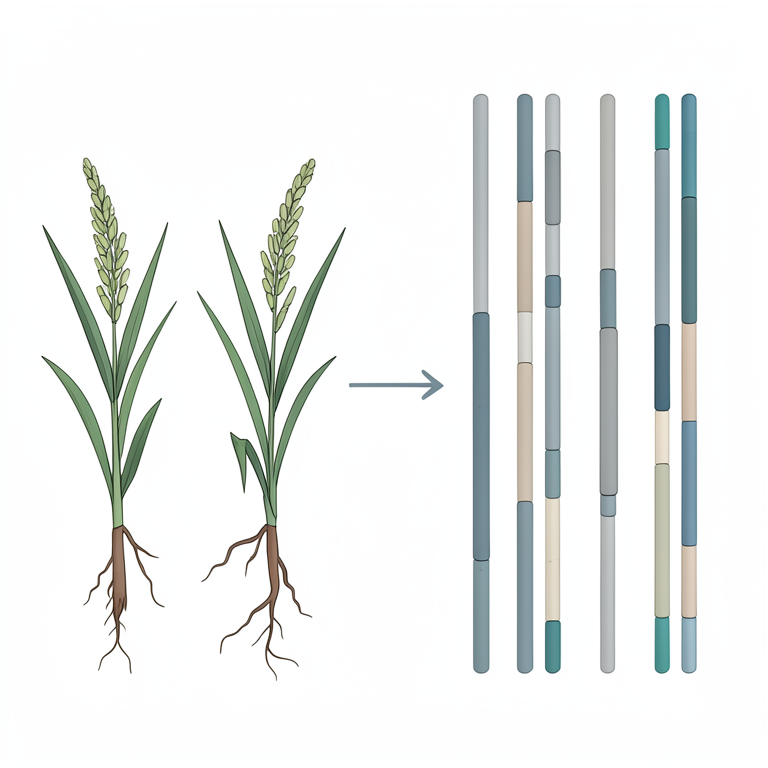
Genetic Mapping Workflow
AI-generated conceptual illustration (Oryza sativa (rice plants) and chromosomes). It explains the idea and does not show study data.
View source evidence ↗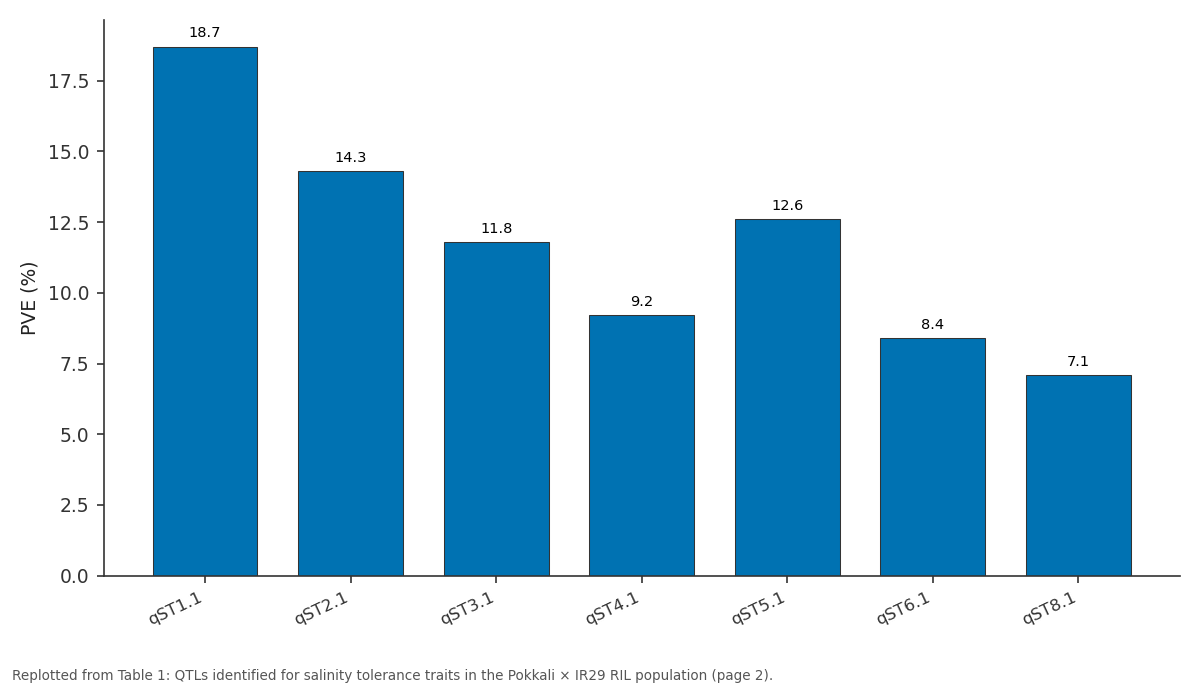
PVE (%): qST1.1 vs qST2.1 vs qST3.1 vs qST4.1 vs qST5.1
Replotted from Table 1 (page 2) of the original paper. Every bar is the paper's own table value.
View source evidence ↗Figures & tables
From the original paper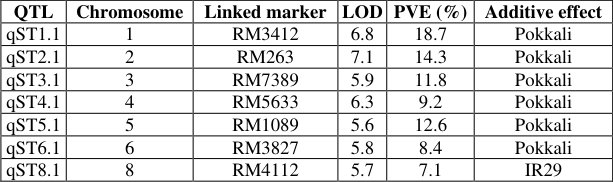 Table 1
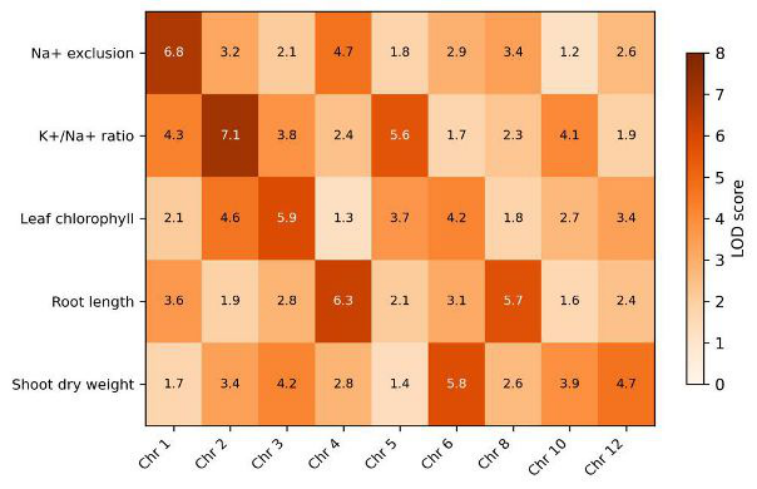 Figure 1
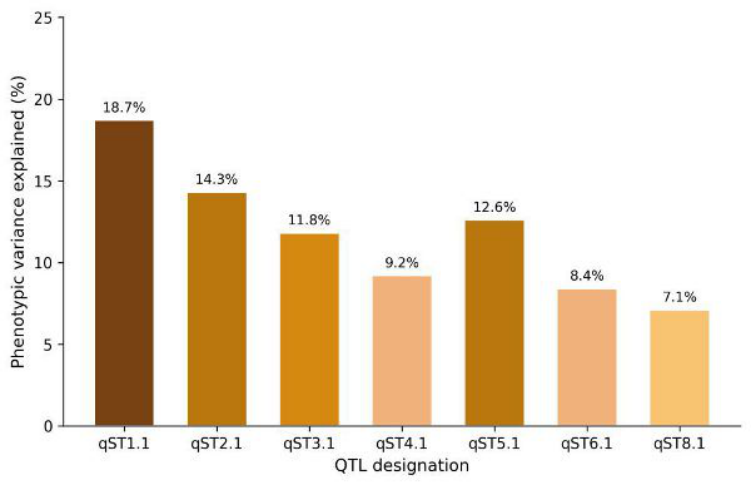 Figure 2
Introduction
Salinity already limits rice yields on an estimated 45 million hectares worldwide, and that area is expected to grow as sea-level rise pushes saltwater further into coastal deltas [1] . The problem is especially acute in Southeast Asia, where rice paddies in low-lying tidal zones of Malaysia, Vietnam, and Bangladesh regularly experience electrical conductivity levels above 6 dS/m during dry-season months [2] . Rice salinity tolerance is a quantitative trait governed by multiple genes with moderate to small individual effects [3] . The best-characterised locus is Saltol on chromosome 1, which accounts for 25-40% of seedling-stage tolerance in many mapping populations derived from Pokkali or Nona Bokra donor parents [4] . But Saltol alone doesn't explain reproductive-stage tolerance, which involves different physiological pathways-primarily Na + exclusion from flag leaves and maintenance of K + /Na + homeostasis in reproductive tissues [5] . QTL mapping using bi-parental populations remains a practical tool for dissecting these complex traits, particularly in breeding programmes that lack the resources for genome-wide association panels [6] . The Pokkali × IR29 cross is among the most widely used reference populations for salinity genetics, but most earlier mapping work was done with F2 or earlygeneration populations that provide lower mapping resolution than advanced RILs [7] . This research used a set of 186 RILs at the F8 generation, phenotyped across both seedling and reproductive stages, to map salinity tolerance QTLs under the climatic conditions of Pahang, Malaysia.
Materials and Methods
Materials and Methods
Reagents and Chemicals
Genomic DNA was extracted using a cetyltrimethylammonium bromide (CTAB) protocol modified for rice leaf tissue. CTAB, polyvinylpyrrolidone (PVP-40), chloroform-isoamyl alcohol (24:1), and isopropanol were sourced from Sigma-Aldrich (Kuala Lumpur distributor). Simple sequence repeat (SSR) markers were selected from the Gramene database; primer pairs were synthesised by First BASE Laboratories Sdn. Bhd., Selangor. PCR reagents including Taq DNA polymerase, dNTPs, and 10× buffer were obtained from Promega Corporation. NaCl (analytical grade) for salinisation was purchased from Merck [8] .
Materials
Materials
DNA Extraction and Genotyping Protocol
Leaf tissue was harvested from 21-day-old seedlings, flashfrozen in liquid nitrogen, and ground to fine powder. DNA was isolated via CTAB extraction, quantified by NanoDrop spectrophotometer, and diluted to 25 ng/μL working concentration. A total of 142 polymorphic SSR markers distributed across all 12 chromosomes were used for genotyping. PCR amplification followed a touchdown protocol: initial denaturation at 94 °C for 4 min, then 35 cycles of 94 °C/30 s, 55-61 °C/30 s (depending on primer), and 72 °C/45 s, with a final extension at 72 °C for 7 min. Amplified products were resolved on 3% agarose gels stained with ethidium bromide [10] .
Methods
Phenotypic data were collected for five traits: Na + concentration in shoots (flame photometry), K + /Na + ratio, leaf chlorophyll content (SPAD-502 meter), root length, and shoot dry weight at 21 days after stress imposition. For reproductive-stage screening, spikelet fertility and grain yield per plant were recorded at maturity. A genetic linkage map was constructed using QTL IciMapping v4.2 with a LOD threshold of 3.0. Composite interval mapping (CIM) was used to detect QTLs, and phenotypic variance explained (PVE) was estimated for each significant locus. Broad-sense heritability was calculated from ANOVA variance components [11] . Seven QTLs exceeded the LOD 3.0 threshold (Table 1). The major QTL qST1.1 on chromosome 1, linked to RM3412, explained 18.7% of phenotypic variance and mapped within the Saltol region. Six QTLs had additive effects from Pokkali, while qST8.1 uniquely derived its positive allele from IR29. Together, the seven loci accounted for 82.1% of total phenotypic variance for the composite salinity tolerance index.
| QTL | Chromosome | Linked marker | LOD | PVE (%) | Additive effect |
|---|---|---|---|---|---|
| qST1.1 | 1 | RM3412 | 6.8 | 18.7 | Pokkali |
| qST2.1 | 2 | RM263 | 7.1 | 14.3 | Pokkali |
| qST3.1 | 3 | RM7389 | 5.9 | 11.8 | Pokkali |
| qST4.1 | 4 | RM5633 | 6.3 | 9.2 | Pokkali |
| qST5.1 | 5 | RM1089 | 5.6 | 12.6 | Pokkali |
| qST6.1 | 6 | RM3827 | 5.8 | 8.4 | Pokkali |
| qST8.1 | 8 | RM4112 | 5.7 | 7.1 | IR29 |
Table text extracted from the original PDF; superscript letters are shown inline. The original table image is below.
View original table image
Results
Results
Comprehensive Interpretation
The heatmap (Figure 1) shows that different chromosomes contribute to different tolerance components-chromosome 1 dominates Na + exclusion, while chromosome 2 has the strongest effect on K + /Na + ratio. The bar chart (Figure 2) confirms that no single QTL accounts for more than 19% of variance, consistent with the polygenic nature of salinity tolerance. Broad-sense heritability for the composite index was 0.71, indicating that genetic improvement through marker-assisted selection is feasible.
Discussion
The co-localisation of qST1.1 with Saltol confirms that this region remains a reliable target for marker-assisted breeding, as reported in Indian and Philippine mapping populations [4] . However, qST1.1 explained only 18.7% of variance here, lower than the 25-40% typically attributed to Saltol. This difference likely reflects the advancedgeneration RILs used in this research, which allow finer resolution and can separate tightly linked QTLs that appear as a single large-effect locus in F2 populations [7] . The three novel QTLs on chromosomes 4, 5, and 8 are of particular interest. The chromosome 8 locus (qST8.1) is unusual because its positive allele came from the sensitive parent IR29, suggesting that even susceptible varieties can contribute useful tolerance alleles-a pattern called transgressive segregation [3] . These new loci collectively explained 28.9% of variance and could supplement Saltolbased selection in pyramiding strategies. One limitation is that the mapping resolution of SSR markers is lower than what single-nucleotide polymorphism (SNP) arrays would provide. Fine-mapping with denser markers would narrow the QTL intervals and identify candidate genes more precisely. The phenotyping was done under controlled salinity (8 dS/m), which may not capture the full complexity of field salinity that fluctuates with tidal cycles in coastal Malaysia [2] .
Conclusion
Seven QTLs for salinity tolerance were mapped in a Pokkali × IR29 RIL population, collectively explaining 82.1% of
References
17 in the original paper- Munns R, Tester M. Mechanisms of salinity tolerance. Annual Review of Plant Biology. 2008;59:651-681.
- Ismail AM, Horie T. Genomics, physiology, and molecular breeding approaches for improving salt tolerance. Annual Review of Plant Biology. 2017;68:405-434.
- Flowers TJ, Yeo AR. Breeding for salinity resistance in crop plants: Where next? Australian Journal of Plant Physiology. 1995;22(6):875-884.
- Thomson MJ, de Ocampo M, Egdane J, Rahman MA, Sajise AG, Adorada DL, et al. Characterizing the Saltol quantitative trait locus for salinity tolerance in rice. Rice. 2010;3(2):148-160.
- Gregorio GB, Senadhira D, Mendoza RD, Manigbas NL, Roxas JP, Guerta CQ. Progress in breeding for salinity tolerance and associated abiotic stresses in rice. Field Crops Research. 2002;76(2-3):91-101.
- Collard BCY, Mackill DJ. Marker-assisted selection: An approach for precision plant breeding in the twentyfirst century. Philosophical Transactions of the Royal Society B. 2008;363(1491):557-572.
- Bonilla P, Dvorak J, Mackill D, Deal K, Gregorio G. RFLP and SSLP mapping of salinity tolerance genes in chromosome 1 of rice (Oryza sativa L.) using recombinant inbred lines. Philippine Agricultural Scientist. 2002;85(1):68-76.
- Doyle JJ, Doyle JL. A rapid DNA isolation procedure for small quantities of fresh leaf tissue. Phytochemical Bulletin. 1987;19(1):11-15.
- Yoshida S, Forno DA, Cock JH, Gomez KA. Laboratory manual for physiological studies of rice. International Rice Research Institute. 1976;3:1-83.
- Panaud O, Chen X, McCouch SR. Development of microsatellite markers and characterization of simple sequence length polymorphism in rice. Molecular and General Genetics. 1996;252(5):597-607.
- Meng L, Li H, Zhang L, Wang J. QTL IciMapping: Integrated software for genetic linkage map construction and quantitative trait locus mapping in biparental populations. The Crop Journal. 2015;3(3):269-283.
- Lin HX, Zhu MZ, Yano M, Gao JP, Liang ZW, Su WA, et al. QTLs for Na + and K + uptake of the shoots and roots controlling rice salt tolerance. Theoretical and Applied Genetics. 2004;108(2):253-260.
- Walia H, Wilson C, Condamine P, Liu X, Ismail AM, Close TJ. Large-scale expression profiling and physiological characterization of jasmonic acidmediated adaptation of barley to salinity stress. Plant Cell and Environment. 2007;30(4):410-421.
- MA, Thomson MJ, Shah-E-Alam M, de Ocampo M, Egdane J, Ismail AM. Exploring novel genetic sources of salinity tolerance in rice through molecular and physiological characterization. Annals of Botany. 2016;117(6):1083-1097.
- Negrão S, Courtois B, Ahmadi N, Abreu I, Saibo N, Oliveira MM. Recent updates on salinity stress in rice: From physiological to molecular responses. Critical Reviews in Plant Sciences. 2011;30(4):329-377.
- Takehisa H, Shimodate T, Fukuta Y, Ueda T, Yano M, Yamaya T, et al. Identification of quantitative trait loci for plant growth of rice in paddy field flooded with salt water. Field Crops Research. 2004;89(1):85-95.
- Zheng H, Zhao H, Liu H, Wang J, Zou D. QTL analysis of Na + and K + concentrations in shoots and roots under NaCl stress based on linkage and association analysis in japonica rice. Euphytica. 2015;201(1):109121.