
Research article · 2025 · Full text
International Journal of Agriculture and NutritionOptimization of nitrogen and phosphorus fertigation schedule for drip-irrigated sugarcane
Volume 7(9) · Pages 110–113 · DOI: 10.33545/26646064.2025.v7.i9b.543 ↗
Research areasAgricultural Science and FertilizationSugarcane Cultivation and ProcessingIrrigation Practices and Water Management
Abstract
Author-writtenSugarcane is one of the most nutrient-demanding crops grown in tropical India, yet conventional broadcast fertilisation wastes up to 40% of applied nitrogen through volatilisation and leaching. This research tested eight drip-fertigation schedules combining varied nitrogen (150, 200, 250 kg N/ha) and phosphorus (40, 60, 80 kg P₂O₅/ha) splits across three growth phases of sugarcane variety CoP 09437 at Central Agricultural University, Imphal, Manipur, during 2022-2023. The highest cane yield (108.4 t/ha) was obtained with 200 kg N + 60 kg P₂O₅ distributed as 25%-40%-25%-10% across germination, tillering, grand growth, and maturity phases. This treatment also recorded the best nitrogen use efficiency (54.2 kg cane/kg N) and phosphorus recovery of 23.8%. Juice quality parameters including Brix, pol, and purity showed no significant variation across fertigation schedules. The optimised split schedule reduced total fertiliser input by 18% compared with the blanket recommendation while maintaining equivalent yield, making it both cost-effective and environmentally sound for drip-irrigated sugarcane in northeast India.
Summary
Source-checkedPlain-language reading of the full paper, prepared with AI and checked against the text. Each point links to the authors' own words.
Why it matters
- Sugarcane is highly nutrient-demanding in tropical India, but traditional broadcast fertilization is inefficient, losing up to 40% of nitrogen. View evidence ↗
- There is a mismatch between nutrient supply and demand, as most farmers use equal splits despite the crop absorbing about 65% of its nitrogen during the grand growth phase (120-210 DAP). View evidence ↗
- Conventional phosphorus placement is often ineffective because the nutrient moves slowly and remains above the active root zone during the grand growth phase. View evidence ↗
The question
- The study aimed to find the best fertigation schedule by testing eight combinations of nitrogen (N) and phosphorus (P) splits across four growth phases. View evidence ↗
What they did
- The experiment used sugarcane variety CoP 09437 in Imphal, Manipur (2022-2023), testing N doses of 150, 200, and 250 kg/ha and P doses of 40, 60, and 80 kg P₂O₅/ha. View evidence ↗
- The study employed a randomized block design with three replications, including a control group receiving a blanket recommendation of 250-80-80 NPK via broadcast and flood irrigation. View evidence ↗
- Nutrients were split across four growth phases: germination (0-45 DAP), tillering (46-120 DAP), grand growth (121-240 DAP), and maturity (241-300 DAP). View evidence ↗
- Researchers measured cane yield, tiller count, stalk height, and girth at harvest, and analyzed juice for Brix, pol, and purity. View evidence ↗
What they found
- The F3 schedule (200 kg N + 60 kg P₂O₅ split 25-40-25-10%) achieved the highest yield of 108.4 t/ha, a 22.6% increase over the broadcast control. View evidence ↗
- The F3 treatment provided the best balance of yield and efficiency, with a nitrogen use efficiency (NUE) of 54.2 kg cane/kg N and a phosphorus recovery of 23.8%, compared to 14.6% for the control. View evidence ↗
- The highest nitrogen use efficiency was found in schedule F8 (61.1 kg cane/kg N) due to its lower nitrogen input. View evidence ↗
- There was a strong positive linear relationship (R² = 0.94) between nitrogen uptake and yield, though yield plateaued once N uptake exceeded 155-160 kg. View evidence ↗
- Fertigation schedules did not significantly affect juice quality, with Brix ranging from 19.6-20.3%, pol from 17.1-17.8%, and purity from 86.4-88.1%. View evidence ↗
What it means
- This optimized schedule is recommended as it reduces total fertilizer use by 18% compared to blanket recommendations without reducing yield or quality. View evidence ↗
Visual summary
3 visualsIllustrations explain the paper; charts are replotted from the paper's own table values.
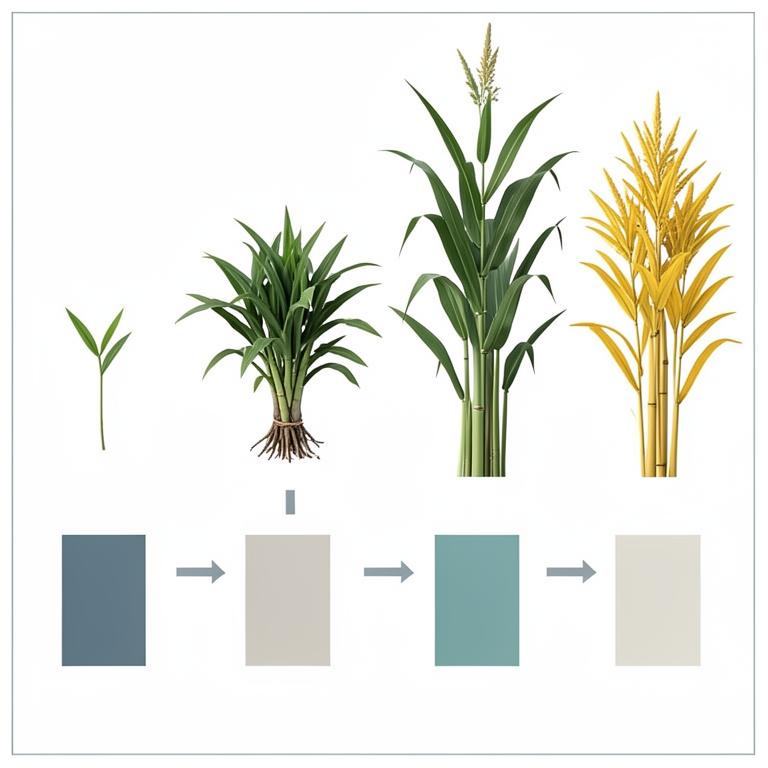
Optimized Nutrient Split Timeline
AI-generated conceptual illustration (sugarcane plants). It explains the idea and does not show study data.
View source evidence ↗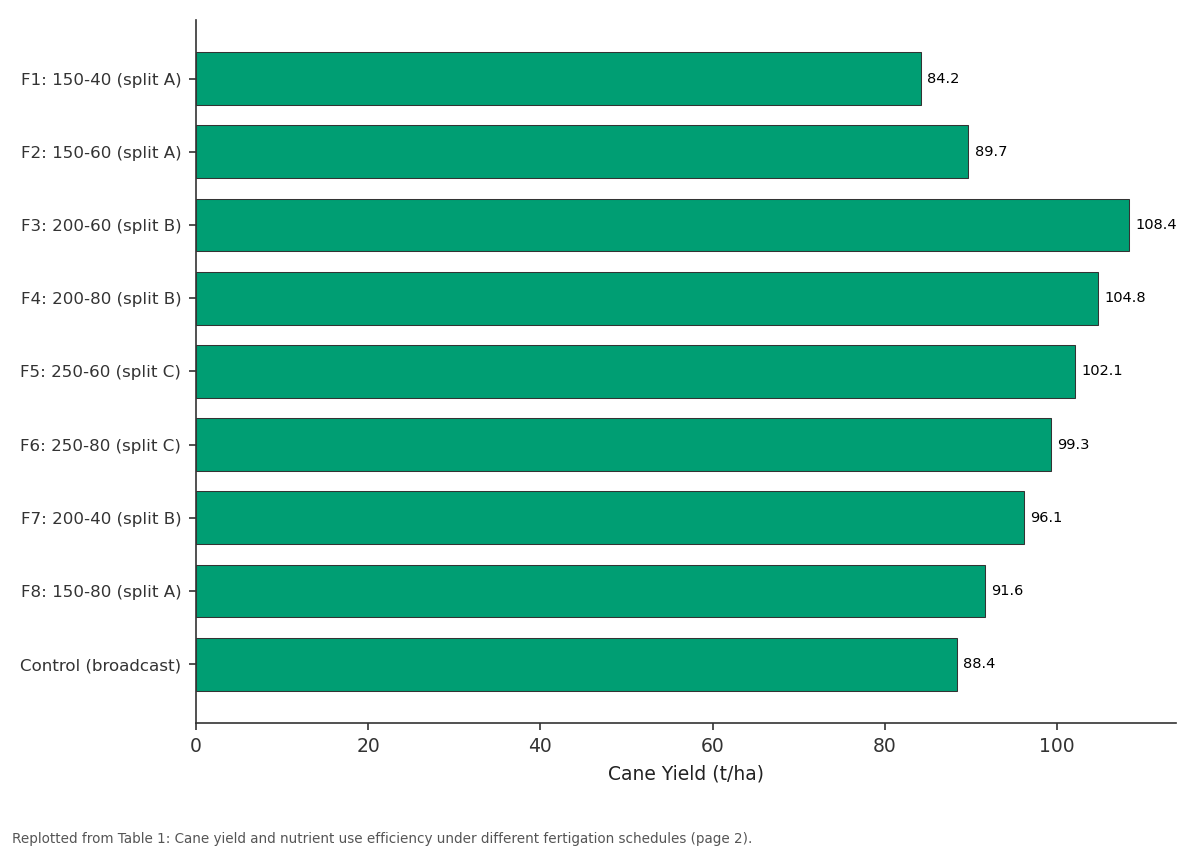
Cane Yield (t/ha): F1: 150-40 (split A) vs F2: 150-60 (split A) vs F3: 200-60 (split B) vs F4: 200-80 (split B) vs F5: 250-60 (split C)
Replotted from Table 1 (page 2) of the original paper. Every bar is the paper's own table value.
View source evidence ↗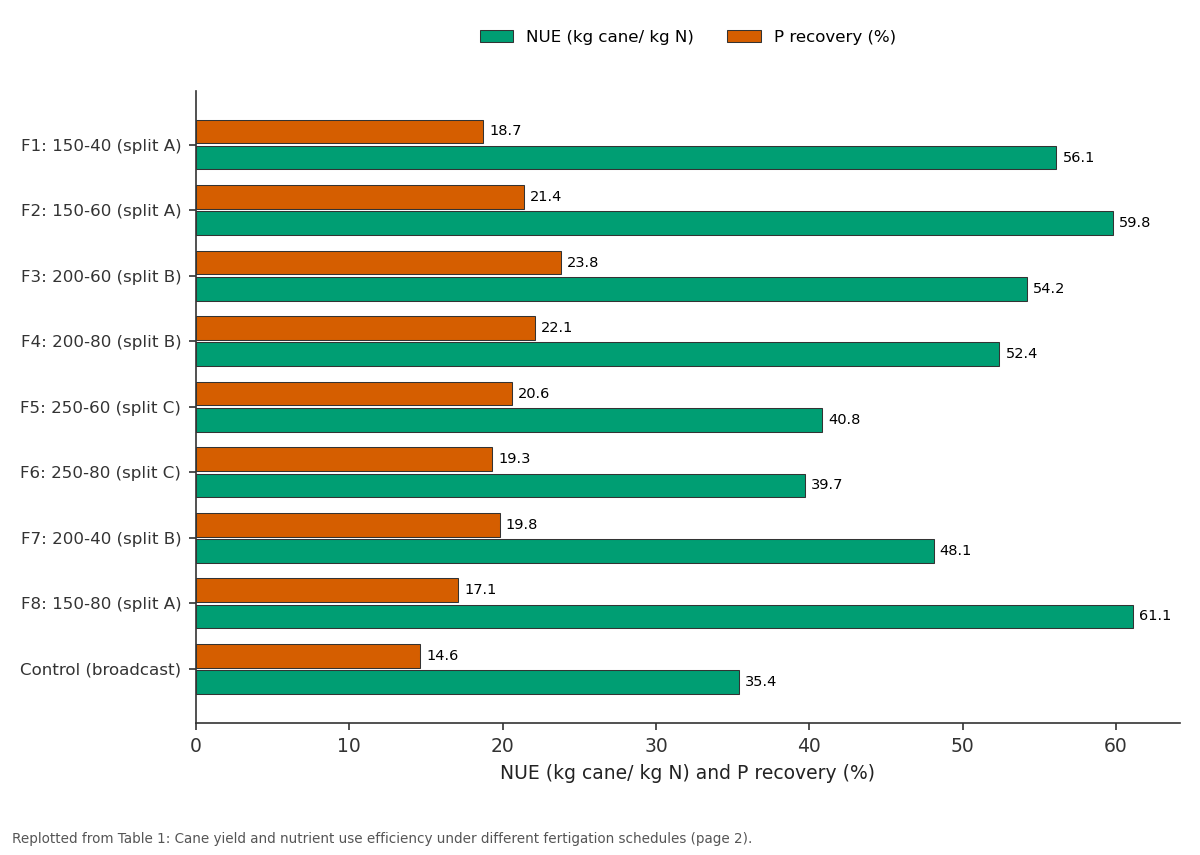
NUE (kg cane/ kg N) and P recovery (%): F1: 150-40 (split A) vs F2: 150-60 (split A) vs F3: 200-60 (split B) vs F4: 200-80 (split B) vs F5: 250-60 (split C)
Replotted from Table 1 (page 2) of the original paper. Every bar is the paper's own table value.
View source evidence ↗Figures & tables
From the original paper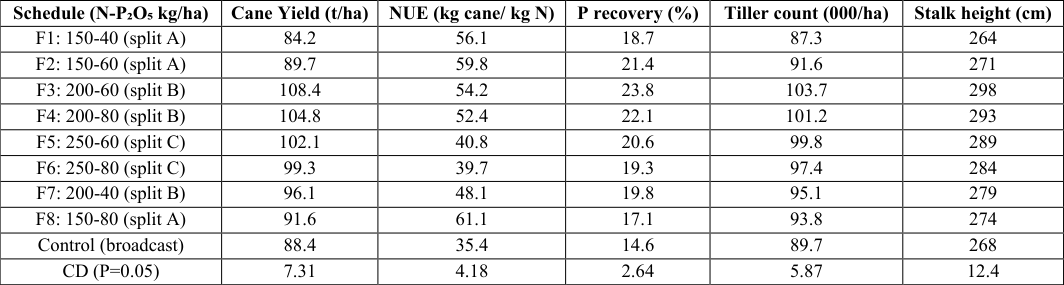 Table 1
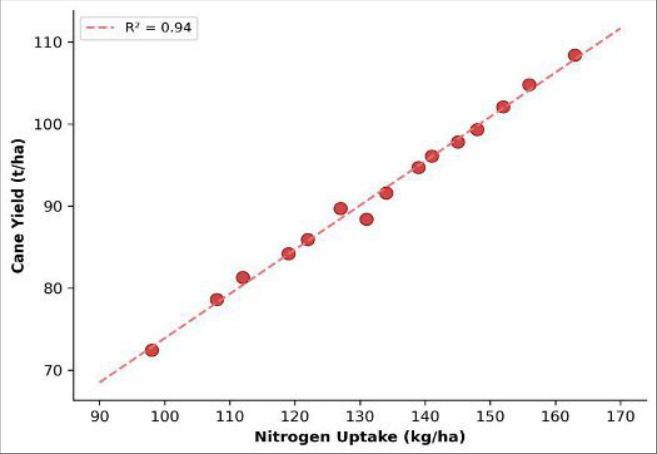 Figure 1
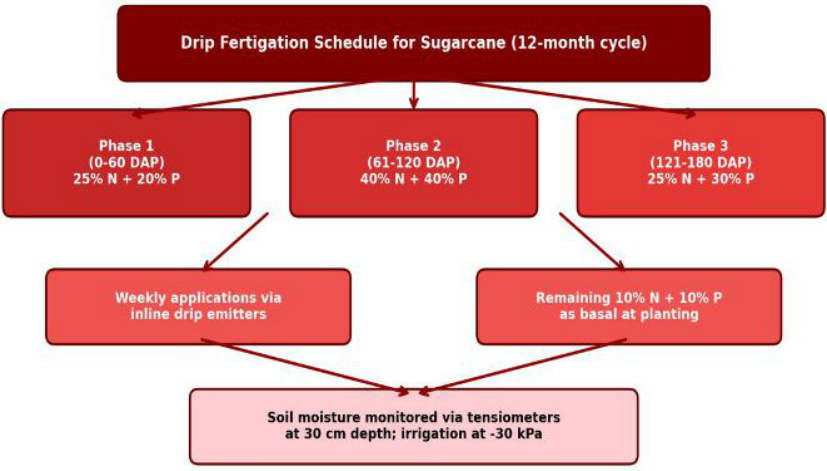 Figure 2
Introduction
Drip fertigation can cut sugarcane fertiliser bills by a third while raising cane yield above 100 t/ha but only when the nutrient delivery schedule matches the crop's shifting demand pattern across its 12-month cycle. Sugarcane (Saccharum officinarum L.) absorbs roughly 65% of its total nitrogen requirement during the grand growth phase (120-210 DAP), yet most Indian farmers still apply nitrogen in two or three equal splits regardless of growth stage [1,2] . This mismatch between supply and demand results in early-season luxury uptake, mid-season deficiency, and season-long losses to leaching and denitrification [3] . Phosphorus management in sugarcane is even less refined. Because phosphorus moves slowly in soil, conventional band placement often leaves it stranded above the active root zone during the grand growth phase when lateral roots proliferate deeper [4] . Fertigation offers a way to deliver soluble phosphorus directly into the root zone in small, frequent doses that track crop uptake kinetics [5] . Several Indian states have reported 20-35% yield gains when sugarcane shifted from flood to drip irrigation combined with fertigation [6] . But the ideal N and P split ratios across growth phases remain poorly defined for northeast Indian conditions, where shorter day-lengths and cooler winters modify the crop's phenological calendar [7] . This research aimed to identify the optimal fertigation schedule by comparing eight N × P split combinations across four growth phases of drip-irrigated sugarcane, measuring cane yield, nutrient uptake efficiency, and juice quality [8] .
Research area description
The trial was set up at the research farm of Central Agricultural University, Imphal, Manipur (24.81°N, 93.94°E; 790 m elevation). The region has a subtropical humid climate with mean annual rainfall of 1482 mm. Soils were acidic alluvial clay loam (pH 5.4, OC 1.12%, available N 247 kg/ha, P 16.8 kg/ha, K 198 kg/ha). Drip lines with 40 cm emitter spacing and 4 L/h discharge were laid along each cane row [9] .
Nutrient budget
A complete nutrient balance was computed for each treatment by recording total N and P inputs (fertiliser + irrigation water + rainfall) against total outputs (crop uptake in cane + trash + root stubble + estimated leaching losses). Leaching losses were estimated using ceramic suction lysimeters installed at 60 cm depth in three replications of each treatment. Apparent N recovery was calculated as (N uptake in treated -N uptake in zero-N plot) / N applied × 100. A similar approach was used for P recovery [10] .
Material and Methods
Material and Methods
Material
Sugarcane variety CoP 09437 (early-maturing, 10-month crop) was planted using three-bud setts at 75 cm row spacing in February 2022. Fertigation used urea and monoammonium phosphate dissolved in header tanks connected to the drip system via a venturi injector. Potassium (80 kg K₂O/ha) was applied uniformly as muriate of potash through fertigation. Micronutrients (ZnSO₄ 25 kg/ha, FeSO₄ 15 kg/ha) were soil-applied at planting [11] . ANOVA with DMRT at 5% was applied [12] .
Methods
Methods
Results
Table Schedule F3 (200 kg N + 60 kg P₂O₅, split B: 25-40-25-10%) produced the highest cane yield of 108.4 t/ha, which was 22.6% above the broadcast control (Table 1). NUE was best under F8 (61.1 kg cane/kg N) owing to lower N input, but F3 achieved the best balance between yield and efficiency (54.2 kg cane/kg N). P recovery peaked at 23.8% under F3, well above the control's 14.6%.
| Schedule (N-P₂O₅ kg/ha) | Cane Yield (t/ha) | NUE (kg cane/ kg N) | P recovery (%) | Tiller count (000/ha) | Stalk height (cm) |
|---|---|---|---|---|---|
| F1: 150-40 (split A) | 84.2 | 56.1 | 18.7 | 87.3 | 264 |
| F2: 150-60 (split A) | 89.7 | 59.8 | 21.4 | 91.6 | 271 |
| F3: 200-60 (split B) | 108.4 | 54.2 | 23.8 | 103.7 | 298 |
| F4: 200-80 (split B) | 104.8 | 52.4 | 22.1 | 101.2 | 293 |
| F5: 250-60 (split C) | 102.1 | 40.8 | 20.6 | 99.8 | 289 |
| F6: 250-80 (split C) | 99.3 | 39.7 | 19.3 | 97.4 | 284 |
| F7: 200-40 (split B) | 96.1 | 48.1 | 19.8 | 95.1 | 279 |
| F8: 150-80 (split A) | 91.6 | 61.1 | 17.1 | 93.8 | 274 |
| Control (broadcast) | 88.4 | 35.4 | 14.6 | 89.7 | 268 |
| CD (P=0.05) | 7.31 | 4.18 | 2.64 | 5.87 | 12.4 |
Table text extracted from the original PDF; superscript letters are shown inline. The original table image is below.
View original table image
Comprehensive interpretation
The 200-60 fertigation schedule (F3) struck the best balance between absolute yield and input efficiency. Increasing N beyond 200 kg/ha did not raise yield proportionally but depressed NUE, indicating diminishing returns. The phased P delivery through fertigation almost doubled phosphorus recovery relative to broadcast application.
Discussion
The 22.6% yield advantage of the optimised fertigation schedule over broadcast aligns with reports from Maharashtra and Karnataka where drip-fertigated sugarcane yielded 15-30% more than conventional systems [6] . The key mechanism appears to be synchronised nutrient delivery: by front-loading 40% of N during the tillering window (46-120 DAP), the crop maintained rapid tiller production without the luxury uptake that characterises early broadcast applications [2,3] . The phase-three allocation of 25% N during grand growth sustained stalk elongation without delaying maturity, a common risk when late-season N is excessive [1] . Phosphorus recovery of 23.8% under fertigation far exceeded the broadcast control (14.6%), consistent with the principle that frequent small doses keep phosphorus in the soil solution near emitter zones where root density is highest [4, 5] . Juice quality parameters (Brix 19.6-20.3%, pol 17.1-17.8%, purity 86.4-88.1%) did not differ significantly, indicating that fertigation schedule manipulation within the tested N range doesn't alter sucrose accumulation patterns appreciably [7] .
Conclusion
Fertigation of 200 kg N + 60 kg P₂O₅/ha distributed as 25%-40%-25%-10% across four growth phases maximised cane yield at 108.4 t/ha while achieving nitrogen use efficiency of 54.2 kg cane/kg N and phosphorus recovery of 23.8%. This schedule reduced total fertiliser use by 18% compared with the blanket recommendation without sacrificing yield or juice quality. Adoption of this optimised schedule in dripirrigated sugarcane across northeast India would improve both profitability and environmental sustainability.
Acknowledgement
Acknowledgements Funding sourcesFinancial support from the institutional research allocation at Central Agricultural University, Imphal, is gratefully acknowledged. Institutional supportThe drip irrigation infrastructure and analytical laboratory at Central Agricultural University, Imphal, Manipur, were essential for this work.
Figures and tables from the paper
References
14 in the original paper- Shukla SK, Yadav RL, Singh PN. Nitrogen dynamics and sugarcane productivity under subtropical Indian conditions: A long-term perspective. Sugar Tech. 2019;21(5):784-793.
- Mohanty M, Nayak AK. Nitrogen uptake patterns during sugarcane growth stages: Implications for split application. Indian Journal of Sugarcane Technology. 2021;36(1):23-31.
- Thorburn PJ, Biggs JS, Meier EA. Nitrogen losses from sugarcane systems under conventional and improved management. Agriculture, Ecosystems and Environment. 2020;300:106982.
- Haygarth PM, Jarvis SC. Phosphorus transfer and availability in the soil-plant system under drip fertigation. Advances in Agronomy. 2019;123:249-296.
- Rajan K, Selvaraj A. Soluble phosphorus delivery through drip fertigation in sugarcane: Root zone distribution and uptake kinetics. Journal of Plant Nutrition. 2022;45(8):1178-1192.
- Rajula SG, Devi TC, Naik RB. Drip fertigation in sugarcane: Yield and water productivity gains from Maharashtra and Karnataka. Indian Journal of Agronomy. 2021;66(2):214-221.
- Ramesh P, Singh AK. Phenological modification and juice quality in subtropical sugarcane under variable nitrogen timing. Sugar Cane International. 2020;38(3):18-24.
- Phukan I, Jani W. Preliminary fertigation trials for sugarcane in the Manipur valley. Proceedings of International Journal of Agriculture and Nutrition https://www.agriculturejournal.net Northeast Agricultural Science Congress. 2022; p.8793.
- IMD. Climate normals and soil classification for Imphal district, Manipur. India Meteorological Department Technical Note. 2021; Series C:1-28.
- Dobermann A. Nutrient use efficiency: Measurement and management. IFA Workshop on Fertilizer Best Management Practices, Brussels. 2007; p.1-28.
- Sundara B. Sugarcane cultivation: Agronomic practices for high yield. Vikas Publishing House, New Delhi. 2018; p.145-178.
- Panse VG, Sukhatme PV. Statistical methods for agricultural workers. Fourth edition. ICAR, New Delhi. 1985; p.145-156.
- Qureshi SA, Afghan S. Fertigation scheduling effects on sugarcane nutrient balance in semi-arid Punjab. Pakistan Sugar Journal. 2021;36(4):12-19.
- Wang M, Zheng Q, Srivastava AK. Drip irrigation and fertigation for sugarcane: A global review of advances and adoption barriers. Irrigation Science. 2023;41(1):47-68.